Comparison of Liquid–Liquid Extraction (LLE) and Supported Liquid Extraction (SLE): Equivalent Limits of Quantification with Smaller Sample Volumes
The Application Notebook
In this application, we demonstrate the use of supported liquid extraction (SLE) for the extraction of beta blockers and NSAIDS from plasma compared with traditional liquid–liquid extraction. SLE was demonstrated to yield consistent LOQs using lower sample volumes.
In this application, we demonstrate the use of supported liquid extraction (SLE) for the extraction of beta blockers and NSAIDS from plasma compared with traditional liquid–liquid extraction. SLE was demonstrated to yield consistent LOQs using lower sample volumes.
Introduction
Traditional liquid–liquid extraction (LLE) provides very clean extracts. In many cases lower recoveries, laborious liquid handling issues and difficulty during automation can limit the success of LLE in sample preparation. Supported liquid extraction (SLE) is a 96-well high throughput technique that is analogous to traditional LLE. In SLE, the extraction interface occurs between the buffered sample, absorbed onto an inert solid support and a water immiscible solvent. The high surface area of the material provides excellent extraction efficiency, while alleviating many of the liquid handling issues associated with traditional LLE. This application note compares ISOLUTE SLE+ with traditional LLE in terms of recoveries and demonstrates equivalent limits of quantification with smaller sample volumes using the supported liquid extraction (SLE+) approach.
Sample Preparation Procedure
Supported liquid extraction procedure
Plate: ISOLUTE SLE+ 400 supported liquid extraction plate, part number 820-0400-P01.
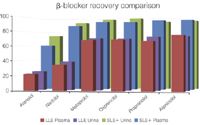
Figure 1: SLE1/LLE β-blocker recovery comparison (200 pg/mL).
Sample pre-treatment:
Acidic analytes (NSAIDs): Plasma (200 μL) pre-treated 1:1 v/v with 1% formic acid aq.
Basic analytes (β-blockers): Plasma (200 μL) pre-treated 1:1 v/v with 0.5 M ammonium hydroxide.
Sample application: The pre-treated plasma (total 400 μL) was loaded onto the plate, a pulse of vacuum applied to initiate flow and the samples left to absorb for 5 minutes.
Analyte elution: Addition of 2 × 900 μL of either MTBE (NSAIDs) or EtOAc (β-blockers).
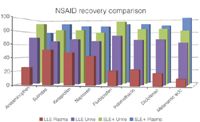
Figure 2: SLE1/LLE NSAID recovery comparison (10ng/mL)
Liquid–liquid extraction procedure
Plasma (500 μL) was pre-treated 1:1 v/v with: 1% formic acid aq. and extracted with 1.8 mL of MTBE (NSAIDs); or 0.5 M ammonium hydroxide and extracted with EtOAc (β-blockers). The layers were left to separate and the organic aliquot removed.
Post extraction: The extract was evaporated to dryness and the analytes reconstituted in 500 μL of appropriate H2O/MeOH mixtures prior to analysis.
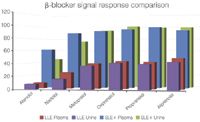
Figure 3: SLE1/LLE β-blocker spiked signal comparison (100 pg/mL).
HPLC conditions
Instrument: Waters 2795 Liquid Handling System (Waters Assoc., Milford, Massachusetts, USA)
Column: Zorbax Eclipse XDB C18 3.5 μm analytical column (100 × 2.1 mm i.d., 3.5 μm) (Agilent Technologies, Berkshire, UK).
Guard column: C8 guard column (Agilent Technologies, Berkshire, UK).
Mobile phase: 0.1% formic acid aq. and MeCN (acetonitrile) at a flow-rate of 0.25 mL/minute using various gradients.
Injection volume: 15–25 μL
Temperature: Ambient
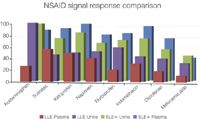
Figure 4: SLE1/LLE NSAID spiked signal comparison (10 ng/mL).
Mass spectrometry
Instrument: Ultima Pt triple quadrupole mass spectrometer (Waters Assoc., Manchester, UK) equipped with an electrospray interface for mass analysis. Positive and negative ions were acquired in the multiple reaction monitoring mode (MRM). All β-blockers were analysed in positive ion mode, whereas, the NSAIDs required both positive and negative MRM transitions.
Desolvation temperature: 350 °C
Ion source temperature: 100 °C
Collision gas pressure: 2.4 × 10⁻³ mbar
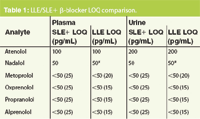
Table 1: LLE/SLE1 β-blocker LOQ comparison.
Results
Figures 1 and 2 show SLE+ and LLE recovery data for the β-blockers and NSAID's, respectively. This data is based on the recovery compared to blank plasma sample fortified post extraction at the same concentration. Figures 3 and 4 show spiked sample response against a standard at the same concentration for the β-blockers and NSAIDs, respectively. This data takes into account the recovery and suppression observed using the two techniques. Tables 1 and 2 show limits of quantification observed for the β-blockers and NSAIDs, respectively. Some analyte LOQ's were lower than the lowest level extracted and as a result the level was estimated based on the lowest signal-to-noise ratio.
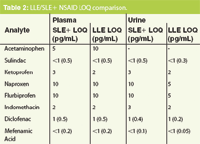
Table 2: LLE/SLE1 NSAID LOQ comparison.
Conclusions
- ISOLUTE SLE+ provided higher recoveries than traditional LLE for all analytes and ISOLUTE SLE+ also demonstrated a better spiked signal response compared with traditional LLE for all analytes.
- ISOLUTE SLE+ demonstrated similar LOQs for a number of the analytes screened when extracting 200 μL compared to 500 μL plasma extractions using LLE. This illustrates that lower sample volumes can be used with ISOLUTE SLE+ compared to traditional LLE.
- Lower LOQs were possible for some analytes with LLE. However, the differences were not significant and similar levels could be obtained using a higher plasma to buffer ratio with ISOLUTE SLE+.

Biotage GB Ltd
Kungsgatan 76, SE-753 18 Uppsala, Sweden
tel. +46 18 56 57 10 fax +46 18 56 57 05
Website: www.biotage.com

.png&w=3840&q=75)

.png&w=3840&q=75)


.png&w=3840&q=75)


.png&w=3840&q=75)


