GC×GC–TOF-MS with Fisher Ratios for Metabolic Profiling in Urine
The Application Notebook
Comprehensive multidimensional gas chromatography time-of-flight mass spectrometry has emerged as an excellent instrumental option for the characterization of small metabolite profiles.
Introduction
Comprehensive multidimensional gas chromatography time-of-flight mass spectrometry has emerged as an excellent instrumental option for the characterization of small metabolite profiles. This application note presents a data mining strategy from results obtained from a diabetic and non-diabetic trimethylsilyl (TMS) derivatized urine study analysed by GC×GC–TOF-MS. A Fisher ratio plot was also generated from grouped sample comparison results.
Experimental Conditions
Sample preparation
4 urine samples
2 non-diabetic control subjects
1 type I diabetic
1 type II diabetic
Sample extraction procedure
10 mL aliquots acidified to pH2 with concentrated H2SO4. 6 samples from each subject were extracted with 2 mL methylene chloride.
Approximately 2 mg of sodium sulphate was added to each extract.
BSTFA derivatization procedure
200 uL extract was placed in a 2 mL amber glass autosampler vial containing 0.5 mg of sodium sulphate.
30 uL of pyridine was added to the vial.
100 uL of BSTFA was placed in the vial.
Samples were heated at 60 °C for 1 hour.
Derivatized samples were then analysed by GC×GC–TOF-MS on the same day as prepared.
GC × GC–TOF-MS analysis parameters
GC: Agilent 7890 with LECO quad jet dual stage cryogenic modulator and secondary oven
Primary column: 30 m × 0.25 mm i.d. × 0.25 μm film thickness Rtx-5ms (Restek Corp., Bellefonte, Pennsylvania, USA)
Secondary column: 1.5 m × 0.18 mm i.d. × 0.20 μm film thickness Rtx-200 (Restek Corp., Bellefonte, Pennsylvania, USA)
Carrier: He, set @ 1.5 mL/min
Injection mode: Splitless injection volume: 3 uL
Primary column temperature programme: Initial temperature set @ 40 °C for 1 min ramped @ 6 °C/min to 290 °C, final hold time 10 min
Secondary column temperature programme: Initial temperature set @ 50 °C for 1 min ramped @ 6 °C/min to 300 °C, final hold time 10 min
Total run time: 52.67 minutes
GC × GC parameters
Column temperature offset: 10 °C
Modulator temperature offset: 25 °C
Modulation period: 5 s; Hot pulse time: 0.8 s
Cool time between stages: 1.7 s
Mass spectrometer: LECO Pegasus 4D
Acquisition rate: 200 spectra/s
Electron energy: –70 eV
Contact LECO for complete parameters.

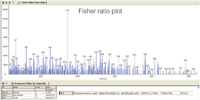
Figure 1: Fisher ratio plot showing unknown chemical differences between non-diabetic and diabetic sample groups.
Results and Conclusions
The results demonstrate that significantly increased analytical performance is achieved by using GC×GC–TOF-MS for the characterization of small molecule metabolite profiles. TOF-MS provides non-skewed mass spectra and fast acquisition needed to deconvolute complex overlapping peaks as well as the data density required to characterize GC×GC analysis. The data was refined through background elimination of erroneous peaks produced by column bleed and derivatization reagents. Data alignment was then performed by the statistical compare feature contained in LECO's ChromaTOF software and a Fisher ratio plot (Figure 1) calculated for each analyte of the compound table was used to identify metabolites with the highest variance. The high variance data was subsequently exported as a spreadsheet and applied to multivariate principal component and clustering analysis.

LECO ETC (European Technical Centre)
Marie-Bernays-Ring 31, 41199 Monchengladbach, Germany
tel. +49 2166 687 104 or 107 fax +49 2166 687 100
E-mail: Sepsci@leco.de
Website: www.leco.com

New Method Explored for the Detection of CECs in Crops Irrigated with Contaminated Water
April 30th 2025This new study presents a validated QuEChERS–LC-MS/MS method for detecting eight persistent, mobile, and toxic substances in escarole, tomatoes, and tomato leaves irrigated with contaminated water.

.png&w=3840&q=75)

.png&w=3840&q=75)


.png&w=3840&q=75)


.png&w=3840&q=75)


