High Resolution Characterization of Hydroxyethyl Starch (HES) by GPC/SEC-MALLS
Hydroxyethyl starch (HES) is one of the most important plasma expanders.
Introduction
Hydroxyethyl starch (HES) is one of the most important plasma expanders. HES' major component (close to 100%) is amylopectin, which has been partly hydroxyl-ethylated to increase solubility. Various degrees of hydrolysis, also called substitution grade, make HES a heterogeneous polymer.
HES is classified according to its molar mass and its substitution grade: there are high molar mass (approx. 400 kDa), medium molar mass (approx. 200 kDa or 130 kDa) and low molar mass (approx. 70 kDa) products available. The corresponding substitution grades vary from 0.7 to 0.4 and they are determined using 1 H-NMR spectroscopy.
The molar mass distribution (MMD) is important because the HES' circulation time in the blood depends on it. Although FFF-MALLS has also been used to measure the MMD of HES, GPC/SEC-MALLS is still the standard method because of easier experimental set-up and better recovery rates. Also low molar mass fractions, that are under suspect to be responsible for adverse effects, are detectable precisely with GPC/SEC.
To measure HES with GPC/SEC the use of efficient separation columns suitable for light scattering and covering a wide molar mass range without showing column mismatch is required.

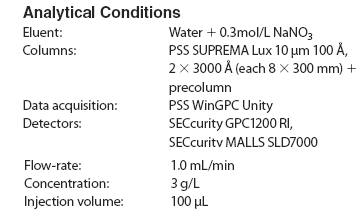
Precise light-scattering data evaluation always requires the knowlegde of the refractive index increment, dn/dc. For HES dn/dc values in the range of 0.136 to 0.151 mL/g have been published. Here an dn/dc of 0.144 mL/g has been used with respect to the degree of substitution.
Results
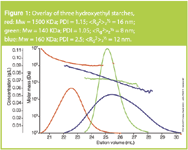
Figure 1 shows three different HES samples. The elution profiles of all three samples are differ and the measured molar mass varies between 140 KDa and 1500 KDa. Also the PDI shows that the HES products are very heterogeneous.The on-line generated MALLS calibration curves (log M vs Ve) for the samples are very different with respect of slope, position and ratio.

Figure 1
For example: At a given elution volume of 24 mL, the calibration curves for the three HES samples, show a variation in molar mass between 1 × 10⁵ Da and 5 × 10⁶ Da. This indicates that the degree of branching for the measured HES samples is very inhomogeneous. At this point the degree of branching for the red sample (highest molar mass) seems to be higher as for the blue and the green sample. For the blue sample the degree of branching decreases with decreasing molar mass, indicated by the slope of the calibration curve. Below a molar mass of 1 × 10⁵ Da the green sample shows a more compact structure than the blue sample because of a higher degree of branching.
Conclusion
Differences in various HES batches can be effortlessly detected and quantified by GPC/SEC, measuring their molar mass against Dextran and/or Pullulan calibration standards. A simple comparison of the elugrams or the apparant molar masses indicates differences in the batches.
For a more sophisticated analysis, the simultaneous determination of molar mass and structure information GPC-MALLS coupling is recommended. The determination of the radius of gyration (<Rg2 >z½ ) allows conclusions on the structure, degree of substitution and the branching.

PSS Polymer Standards Service GmbH
In der Dalheimer Wiese 5, D-55120 Mainz/Germany
tel. +49 6131 96239 60 fax +49 6131 96239 11
E-mail: Thofe@polymer.de Website: www.polymer.de

Determining Enhanced Sensitivity to Odors due to Anxiety-Associated Chemosignals with GC
May 8th 2025Based on their hypothesis that smelling anxiety chemosignals can, like visual anxiety induction, lead to an increase in odor sensitivity, a joint study between the University of Erlangen-Nuremberg (Erlangen, Germany) and the Fraunhofer Institute for Process Engineering and Packaging (Freising, Germany) combined behavioral experiments, odor profile analysis by a trained panel, and instrumental analysis of odorants (gas chromatography-olfactometry) and volatiles (gas chromatography-mass spectrometry).
Investigating 3D-Printable Stationary Phases in Liquid Chromatography
May 7th 20253D printing technology has potential in chromatography, but a major challenge is developing materials with both high porosity and robust mechanical properties. Recently, scientists compared the separation performances of eight different 3D printable stationary phases.
Detecting Hyper-Fast Chromatographic Peaks Using Ion Mobility Spectrometry
May 6th 2025Ion mobility spectrometers can detect trace compounds quickly, though they can face various issues with detecting certain peaks. University of Hannover scientists created a new system for resolving hyper-fast gas chromatography (GC) peaks.

.png&w=3840&q=75)

.png&w=3840&q=75)


.png&w=3840&q=75)


.png&w=3840&q=75)


