BioPharma Compass: A Fully Automated Solution for Characterization and QC of Intact and Digested Proteins
The Application Notebook
BioPharma Compass? is a fully automated solution for the rapid characterization of biopharmaceutical products such as proteins, peptides, RNA, and DNA. This push button solution assists nonspecialist operators to generate high quality, accurate data for automatic comparison with laboratory reference standards. Automated, visual reports are then generated for each sample and important information regarding a products purity and identity can be observed at a glance. In this application note, we will apply the BioPharma Compass workflow to the QC characterization of two proteins including intact IgG1 and digested transferrin.
Christian Albers, Laura Main, Carsten Bäßmann, and Wolfgang Jabs, Bruker Daltonik GmbH
BioPharma Compass™ is a fully automated solution for the rapid characterization of biopharmaceutical products such as proteins, peptides, RNA, and DNA. This push button solution assists nonspecialist operators to generate high quality, accurate data for automatic comparison with laboratory reference standards. Automated, visual reports are then generated for each sample and important information regarding a products purity and identity can be observed at a glance. In this application note, we will apply the BioPharma Compass workflow to the QC characterization of two proteins including intact IgG1 and digested transferrin.
Characterization of protein therapeutics and comparison with reference standards for the analysis of biotherapeutics usually includes accurate analysis of the intact protein mass followed by complete amino acid sequence coverage, usually obtained by digestion of the protein by an enzyme and analysis by mass spectrometry. These two complementary workflows ensure that the correct product has been produced with the correct modifications and detects any unexpected impurities that may affect the efficacy or safety of the protein drug. In this application note, we will demonstrate the BioPharma Compass QC workflow (as shown in Figure 1) in combination with two industry leading platforms, the Dionex UltiMate 3000 UHPLC system and the maXis UHR-TOF as samples of intact IgG1 and digested transferring are analyzed.
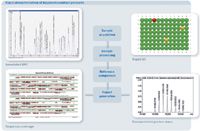
Figure 1: Overview of BioPharma Compass, describing the steps involved in a typical protein QC characterization workflow. These steps are completely automated. After comparison with reference standards and the setting of individual QC criteria, reports are automatically generated. The reports shown here display the deconvoluted intact protein mass, protein sequence coverage, BPC annotated with peptide sequences and a rapid QC screening report.
Experimental
For protein profiling experiments, human IgG1 from Sigma-Aldrich was used without further purification. A batch of 20 samples were prepared; 18 vials contained IgG1 with a concentration of 1 µg/µL, 1 vial contained a mixture of IgG1 and IgG4 and 1 vial only IgG4. 4 µL were injected from each vial.
UHPLC Dionex RSLC
Guard cartridge: Dionex Acclaim 120, C8, 5 µm, 2 × 10 mm
Analytical column: Dionex Acclaim 120 C8 column, 3 µm, 2.1 × 150 mm
Column oven: 70 °C
Flow rate: 300 µL/min
Solvent A: 0.1% FA in H2O
Solvent B: 0.1% FA in ACN
Run time: 15 min applying a gradient from 5 to 90% B followed by 3 min equilibration with 2% B
Mass spectrometer: Bruker maXis UHR-TOF
For peptide mapping experiments, transferrin was reduced, alkylated, and digested using trypsin according to the standard protocols. 48 vials per protein digest were prepared; the peptide concentration was 1 pmol/µL. 5 µL were injected from each vial.
LC–MS instrumentation for peptide mapping experiments: UHPLC Dionex RSLC
Analytical column: Dionex Acclaim RS LC120 C18 column, 2.2 µm, 2.1 × 100 mm
Column oven: 40 °C
Flow rate: 300 µL/min
Solvent A: 0.1% formic acid in H2O
Solvent B: 0.1% formic acid in ACN/H2O 90:10
Results
QC analysis of Intact IgG1 and digested transferrin were performed in a fully automated fashion with BioPharma Compass. As soon as the IgG1 batch acquisition is started, a QC result table is generated as shown in Figure 2. Each row in the QC table in Figure 2 represents one IgG sample analysis. In this example the pass/fail criteria was based simply on mass accuracy. However, QC criteria may be adjusted to suit individual analysis requirements. Figure 3 represents an example of the automated report output available with BioPharma Compass.
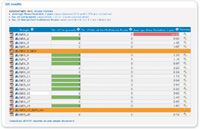
Figure 2: Table view summarizing the QC result of 20 IgG1 intact protein samples. Each row contains the result of one LCâMS experiment; in the columns are values of different quality control criteria. Two samples are highlighted due to the presence of an unexpected impurity, another sample highlighted in red has failed to meet the QC criteria based on mass accuracy. This table also provides access to more-detailed pdf reports.
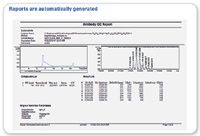
Figure 3: Part of the automatically generated pdf QC report from an intact IgG1 protein sample. The identity of the sample is displayed in the header. In the second section the total ion chromatogram (TIC) and the chromatographic peaks (Compound List) are reported. The spectrum, deconvoluted with the Maximum Entropy algorithm, indicates the different glycosylated isoforms of the antibody. The deconvoluted mass peaks are compared with a reference standard and the result of this comparison is reported in the Result List.
For rapid throughput, samples can also be viewed in a 96 well format (Figure 4). Again, samples that have failed QC criteria are highlighted in red, those requiring further investigation are shown as amber, and samples that successfully meet QC criteria are shown in green. In this instance, the first 48 wells correspond to the analysis of digested transferrin.
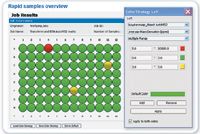
Figure 4: Rapid view, QC result of digested Transferrin protein samples. In this example the mass deviation was chosen as quality criterion. The sample is represented in green if the deviation is smaller than 3 ppm, yellow when the deviation is in the range between 3 and 5 ppm and red when it is above 5 ppm. Generation of the QC table begins as soon as the first sample has been acquired.
Conclusion
Biopharma Compass provides a fully automated workflow for the characterization of biopharmaceutical products such as proteins, peptides, RNA, and DNA. Sample acquisition, processing, comparison with reference standards, and report generation are achieved in parallel thus dramatically increasing productivity and sample throughput.
In combination with the outstanding sensitivity, mass accuracy, and resolution of the maXis UHR-TOF, BioPharma Compass assists nonspecialist operators to rapidly generate high quality data to confirm the identity and purity of biopharmaceutical compounds to ensure drug safety and efficacy.
Bruker Daltonics
Billerica, MA
tel. (978) 663-3660, fax (978) 667-5993
Email: ms-sales@bdal.com
Website: bruker.com/biopharma
Polysorbate Quantification and Degradation Analysis via LC and Charged Aerosol Detection
April 9th 2025Scientists from ThermoFisher Scientific published a review article in the Journal of Chromatography A that provided an overview of HPLC analysis using charged aerosol detection can help with polysorbate quantification.
Analyzing Vitamin K1 Levels in Vegetables Eaten by Warfarin Patients Using HPLC UV–vis
April 9th 2025Research conducted by the Universitas Padjadjaran (Sumedang, Indonesia) focused on the measurement of vitamin K1 in various vegetables (specifically lettuce, cabbage, napa cabbage, and spinach) that were ingested by patients using warfarin. High performance liquid chromatography (HPLC) equipped with an ultraviolet detector set at 245 nm was used as the analytical technique.
Removing Double-Stranded RNA Impurities Using Chromatography
April 8th 2025Researchers from Agency for Science, Technology and Research in Singapore recently published a review article exploring how chromatography can be used to remove double-stranded RNA impurities during mRNA therapeutics production.


