2D Analysis of Thermoplastic Elastomers TPE
The Application Notebook
Polymer Standard Service
Introduction
Blockcopolymers such as SBS (styrene-butadiene-styrene) are an important product class and a typical example of complex polymers. In addition to the molar mass distribution, a chemical composition distribution may also be present in copolymers. While GPC/SEC is the established method for the determination of molar mass averages and distribution, gradient HPLC can be applied to separate based on chemical composition.
Gradient HPLC can be hyphenated with GPC/SEC in a fully automated setup to measure both distribution simultaneously with a high peak capacity and to detect differences in batches (cf. Figure 1).


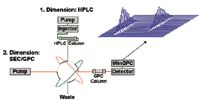
Figure 1: Scheme of two-dimensional chromatography.
Experimental
All experiments were performed on PSS SECcurity equipment using the following conditions:
Eluent 1st dim.: n-Hexane/THF p.a. gradient
Column 1st dim.: PSS Si-60 5 μm
Flow-rate 1st dim.: 0.1 mL/min
Injection volume: 20 μL
Transfer: PSS 2D tandem transfer valve with two 100 μL loops
Eluent 2nd dim.: THF p.a.
Column 2nd dim.: PSS HighSpeed SDV 5 μm, 10000 Å
Flow-rate 2nd dim.: 6.25 mL/min
Detection: SECcurity VWD 1260 UV at 254 nm
Calibration: PSS Polystyrene ReadyCal Standards, PSS Polybutadiene standards
Data system: PSS WinGPC Unity 7.5
Results
The 2D approach is the only way to determine two property distributions independently and unambiguously. The online combination of gradient HPLC and GPC/SEC increases the peak capacity of the separations and those peaks which cannot be separated by either method alone to be examined more closely. The HPLC conditions are selected to separate according to polybutadiene content.
Figure 2 shows the contour plot for a thermoplastic elastomer that shows one narrow main peak in GPC/SEC. However, 2D separation reveals that four different compositions are present that co-elute in the GPC/SEC experiment. The species differ in composition and polybutadiene content. The colour code indicates the concentration of each peak. Simultaneous molar mass results and composition results can be measured using the calibrated GPC/SEC and HPLC axis.

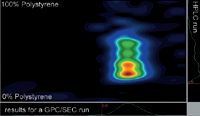
Figure 2: Contour plot of a thermoplastic elastomer.
PSS Polymer Standards Service GmbH
In der Dalheimer Wiese 5, D-55120 Mainz, Germany
tel.+49 6131 96239 0 fax +49 6131 96239 11
E-mail: Pkilz@polymer.de
Website: www.pss-polymer.com


Removing Double-Stranded RNA Impurities Using Chromatography
April 8th 2025Researchers from Agency for Science, Technology and Research in Singapore recently published a review article exploring how chromatography can be used to remove double-stranded RNA impurities during mRNA therapeutics production.


The Effect of Time and Tide On PFAS Concentrations in Estuaries
April 8th 2025Oliver Jones and Navneet Singh from RMIT University, Melbourne, Australia discuss a recent study they conducted to investigate the relationship between tidal cycles and PFAS concentrations in estuarine systems, and offer practical advice on the sample preparation and LC–MS/MS techniques they used to achieve the best results.


