Method Development for Reversed-Phase Separations of Peptides: A Rational Screening Strategy for Column and Mobile Phase Combinations with Complementary Selectivity
This review article summarizes the results obtained from the combined efforts of a joint academic and industrial initiative to solve the real-life challenge of determining low levels of peptide-related impurities (typically 0.05–1% of the drug substance) in the presence of the related biologically active peptide at a high concentration. A rational screening strategy for pharmaceutically important peptides has been developed that uses combinations of reversed‑phase ultrahigh-pressure liquid chromatography (UHPLC) columns and mobile phases that exhibit complementary reversed-phase chromatographic selectivity using either UV- or mass spectrometry (MS)-compatible conditions. Numerous stationary and mobile phases were categorized using the chemometric tool of principal component analysis (PCA), employing a novel characterization protocol utilizing specifically designed peptide probes. This was successfully applied to the development of a strategy for the detection of impurities (especially isomers) in peptide drug substances using two-dimensional liquid chromatography coupled with MS detection (2D-LC–MS).
The movement from small molecule-based new drug entities to larger and more complex biomolecules, such as peptides and proteins, has increased in recent years (1,2). This has led to a re-evaluation of how chromatographers perform efficient, rapid, and rational development of purity methods for peptide-based pharmaceuticals—that is, samples that consist of a biologically active peptide present at a high level and a number of related peptide impurities present at a low level (typically 0.05–1% of the drug substance). Peptides present a different analytical challenge compared with small molecules because of their size and unique physical-chemical properties. Reversed‑phase chromatographic separations with either UV absorbance (UV) or mass spectrometric (reversed‑phase chromatography–MS) detection are the most important analytical techniques for the analysis of intact peptides and their related impurities (oxidation, deamidation, racemization, isoAsp formation). There is even a current drive to replace several traditional analytical methods (reversed‑phase chromatography, ion-exchange chromatography [IEC], imaged capillary isoelectric focusing [icIEF], CE-SDS [capillary electrophoresis in which proteins are denatured with sodium dodecyl sulphate and then separated based on size in a gel (for example, dextran, polyvinyl alcohol, polyethylene oxide, polyethylene glycol)], hydrophilic interaction liquid chromatography [HILIC], enzyme-linked immunosorbent assay [ELISA]) with one reversed-phase chromatography–MS method that is fit for purpose for the characterization of larger proteins, antibodies, and their related impurities as digests—this is referred to as multiple attribute monitoring (MAM) (3). There are several challenges related to peptide analysis; however, the “Achilles’ heel” of liquid chromatography (LC)–MS lies in its inability to accurately determine isobaric compounds such as isomers—which are difficult to separate chromatographically and have identical mass-to-charge ratios (m/z). It is therefore vital to have a better understanding of the separation of peptide impurities— especially isomers—as a function of column and mobile phase conditions (both UV- and MS-compatible).
This article summarizes the findings of our recent research to:
1) Develop a column and mobile phase reversed-phase chromatography characterization protocol employing relevant peptide probes.
2) Utilize the characterization results to identify column and mobile phase combinations that provide complementary selectitives for method development purposes or similar selectivities for the identification of “equivalent” columns.
3) Define and demonstrate a strategy for detection of impurities (especially isomers) in therapeutic peptides using two-dimensional (2D)-LC–MS.
The work described in this review article is an example of combining the expertise within both the pharmaceutical industry and academia to solve a real-life challenge (4–10). The reader is directed to the original papers for more details relating to the studies.
Experimental
For complete details of the experimental conditions, readers are referred to references 4–10.
Development of a Peptide Reversed-Phase Chromatography Characterization Protocol (4,5)
Column characterization protocols employing small molecules have been used successfully for decades to classify reversed-phase chromatography stationary phases and provide a better understanding of potential mechanisms of interaction between the stationary phase and analytes. The most common are the hydrophobic subtraction model, developed by Snyder et al. (11), and the extended Tanaka protocols, enhanced by Euerby and Petersson (12,13). However, for the reversed‑phase chromatography of peptides, it was deemed imperative to use relevant peptide probes to categorize the stationary phases classed as suitable for peptide analysis. This was proven by the fact that the small molecule databases failed to correlate with the Peptide RPC Column Characterization Protocol (6).
[Ile27]-Bovine GLP-2, which contains a 33 amino acid sequence (see reference 4, table 2), was selected as the base sequence to develop the peptide probes. The peptide was synthesized in two parts: a more hydrophilic portion (1-15) and a more hydrophobic segment (16-33) were modified systematically at one position at a time along the peptide chain. These modifications were made to investigate the effects of hydrophobicity, aromaticity, and changes in charge, as well as changes that reflect common degradative pathways (isomerization, racemization, and deamidation products that can prove difficult to resolve) (see reference 5, table 1 for the peptides used in the final protocol). For a full rationale for the selection of [Ile27]-Bovine GLP-2 and the design of the probes, see reference 4.
The characterization protocol was performed at both low and intermediate pH conditions to alter the ionization state of the stationary phase and peptide probes. Solutions of 0.1% v/v formic acid and ammonium formate (native pH values of 2.7 and 6.5, respectively) were employed. The use of the ion‑pairing reagent trifluoroacetic acid (TFA) as a mobile phase additive was not considered for use in the characterization protocol because it suppresses any potential selectivity differences between the stationary phases (4,7).
Selectivity between two probes of interest was measured as the difference in normalized retention times (that is, delta values). In this way, any contribution from instrument dwell or column volumes could be eliminated, and variations caused by analyst, mobile phase, or laboratory differences reduced. In total, 33 delta values were obtained for each mobile phase. The Peptide RPC Characterization Protocol was then applied to 14 stationary phases. The results were evaluated using the chemometric tool of principal component analysis (PCA), which condenses the data into a selected number of principal components (PCs), where the number of PCs is less than the number of experimental variables. In our case, it was found that the first two PCs carried 56% of the measured variance in the delta values. Based on the prior knowledge of the stationary phases, the manufacturer’s information, the Tanaka column characterization data, and their position within the score plot, the stationary phases could be classified into three groupings, as described in the next section. From the PCA loading plot, numerous duplications of data from the variables (delta retention time values) were revealed, and so many measurements could be removed without any loss of information. The characterization protocol could therefore be streamlined by reducing the number of delta values determined from 66 to eight measurements and using nine instead of 26 peptides (see reference 6, table 2).
The retentivity and selectivity of the peptide probes were observed to be dominated by hydrophobicity, and then electrostatic/polar interactions. Despite the random coil nature of the peptides in mobile phases, it was observed that they changed conformation within the stationary phase (4). The second order structure of the peptides contributed significantly to the elution of the peptide, which was highlighted by large selectivity differences. This further complicated an interpretation of the retention mechanisms between the stationary phase and peptides.
Based on a statistical analysis of data from a reduced factorial design, the Peptide RPC Column Characterization Protocol was shown to be robust. This allowed specifications for the preparation of the mobile phases to be set, as well as critical appraisal of the impact of small fluctuations in operating conditions, batch-to-batch variability in columns, and instrument characteristics. The results indicated that the spatial differences observed in the characterization score plots were caused by real selectivity differences between stationary phases, and not variations in experimental conditions. For a full list of the steps employed to improve the reproducibility and reliability of the procedure, as well as the definitive protocol, see reference 5.
Characterization of Stationary Phases for Peptide Analysis (6)
The Peptide RPC Characterization Protocol was then applied to a more extensive range of stationary phases (43 differing phases to date) covering a range of ligand functionalities. The results were assessed using PCA, and the first two PCs carried 80% of the variance in the dataset (Figure 1). The stationary phases were divided into the three categories based on manufacturer information, the extended Tanaka small molecule column characterization results, and their position within the PCA score plot. These categories were similar to those that emerged in the preliminary study: 1) neutral phases; 2) phases possessing negative charge/polar character; and 3) those with a positive charge character.
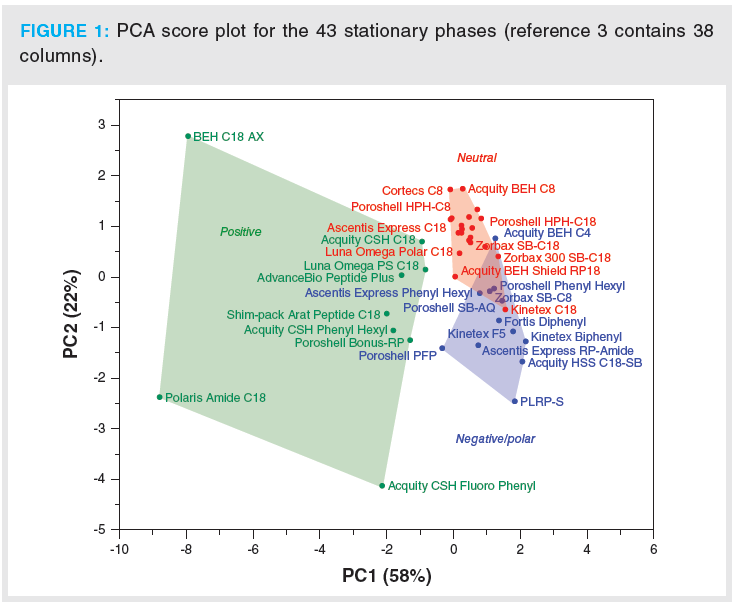
The neutral phases (marked in red) were clustered in the top right quadrant of the score plot. These phases possessed alkyl moieties with a high ligand density and endcapping. The negative/polar phases (marked in blue) were located predominantly in the lower right quadrant. These phases typically had lower ligand density, lacked endcapping, or possessed a ligand architecture that promoted access to the silica surface. The third group had some form of positive character (marked green) on the stationary phase, either via the ligand functionality, or positively charged sites on the silica surface. These phases were scattered within the upper and lower left-hand quadrants. These results were in line with the position of the delta values in the PCA loading plots. For example, stationary phases with a positive character in the left-hand side are dominated by Δ(9,1) FA (negative character), which probes the positive character of the stationary phase. Those phases on the right are dominated by the Δ(26,13) values (positive character), which explores the negative character of the stationary phase. For a full explanation of the PCA results, readers are directed to reference 6.
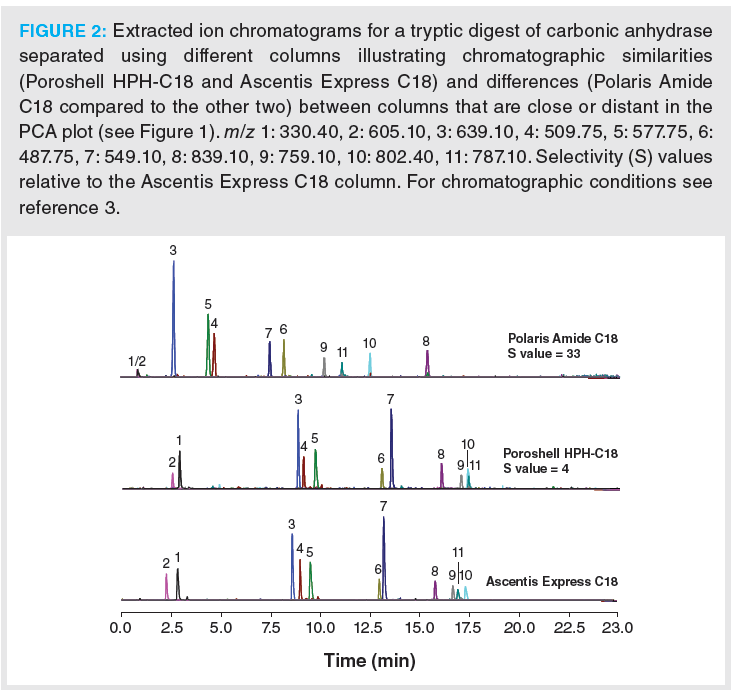
Stationary phases that are within close spatial proximity to one another in the PCA score plot should provide similar chromatographic profiles, while stationary phases spatially separated in the PCA score plot should provide different chromatographic elution profiles. Both scenarios were demonstrated using tryptic digested peptides, as shown in Figure 2. The selectivity (S) values (14) for the dissimilar (S value = 33) and similar (S value = 4) phases relative to a standard C18 were of a similar magnitude to those previously observed for small molecular weight analytes (15). The Peptide RPC Column Characterization database should be freely available on the ACD/Lab website later in the year (16).
Characterization of Mobile Phases for Peptide Analysis (7)
In liquid chromatography, the mobile phase is known to have a major impact on selectivity. In our work, 51 novel and routinely used mobile phases, suitable for both MS- and non-MS-compatible conditions, were evaluated. Mobile phases with pHs ranging between 2.3–7.5 were adjusted with NaCl, kosmotropic (Na2SO4 and [NH4]2SO4) or chaotropic (sodium perchlorate [NaClO4] and ammonium hexafluorophosphate [NH4PF6]) salts, or ion-pair reagents (triethylamine [TEA], TFA, heptafluorobutyric acid [HFBA], and sodium 1-butanesulfonate [BuSO3Na]). Other mobile phases covering a pH range of 1.8–7.8 were also assessed and included typical acids such as TFA, as well as less commonly used additives such as difluoroacetic acid (DFA) and methanesulfonic acid (MSA). Higher pH mobile phases were not investigated due to their potential to cause deamidation and isomerization/racemization of peptides. In addition, low retention of the peptide probes was observed at high pH due to mutual repulsion of the negatively charged peptide and stationary phase. For the full list, rationale, and preparation of the mobile phases, see reference 7. The study was performed using a general gradient elution profile with a new generation “low acidity” C18 column, which was representative of a neutral, reversed-phase column.
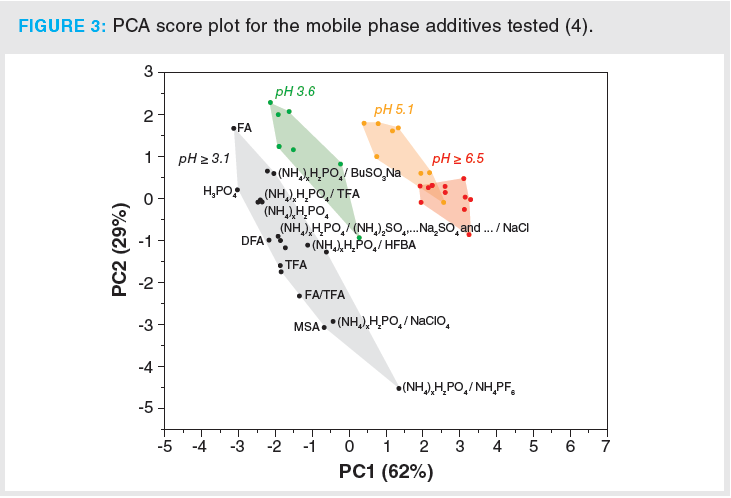
The first two PCs carried 91% of the measured variance in the dataset (Figure 3), with a clear link to electrostatic interactions represented by the first principal component, based on the positions of Δ(9,1) and Δ(26,13) values. The first principal component was also dominated by aromatic, phenolic, and hydrogen bonding interactions due to the location of Δ(16,13), Δ(24,13), and Δ(8a,1) values, respectively. In Figure 3, the left‑hand side of the score plot is governed by the low pH conditions (pH ≤ 2.7), with a clear increase in pH across to the right-hand side of the score plot (pH ≥ 6.5). There is also a convergence as the pH increases, indicating that as the pH increases, the selectivity differences due to other factors are not as large as those observed at low pH conditions. The second principal component reflected steric interactions (Δ[14,13] and Δ[15,13]). The results indicated that pH is a major contributor to selectivity differences and should be evaluated in any method development screening approach.
Kosmotropic and chaotropic salts are a particularly interesting range of additives due to their ability to make or break water structure, which can affect the solvation shell around peptides and proteins. The chaotropic salts appeared to provide greater selectivity differences than the kosmotropic salts. Despite the potential selectivity differences provided by the perchlorate (ClO4-) additive, there are some disadvantages that could limit its widespread use—namely, health, safety, and environmental concerns. The nonvolatile ammonium hexafluorophosphate additive is a viable alternative that offers even larger selectivity differences under low pH conditions, without the explosive properties of perchlorates.
The ion-pairing reagents are an interesting subset of additives that can vastly alter the elution profiles based on the various interactions of the ion-pairing reagent with analyte and stationary phase. The hydrophobicity of the ion-pair can also be advantageous for peptides with different polarities, highlighting the importance of evaluating several ion-pair reagents. The ion-pair reagents TFA, TEA, HFBA, and butanesulfonate (BuSO3-) were compared against no ion-pair reagent, at the four different pH conditions (pH 2, 3.6, 5.1, and 7.5). As hexafluorophosphate and perchlorate possess ion-pairing properties, these additives were also included in the comparison; however, the ionic strength was significantly higher, therefore the value of this comparison is somewhat limited. The increase in retention of the peptide probes due to the addition of a given ion-pair reagent correlated with the hydrophobicity of the ion-pair reagent: none < TFA < BuSO3- < HFBA. At pH 2.3, the BuSO3- and HFBA ion‑pair reagents had the largest spatial difference in the score plot. However, with the inclusion of the chaotropic salts at pH 2.3, this distance was extended substantially, suggesting considerable selectivity differences. The TFA-containing mobile phase was located closest to the non‑ion‑pair reagent mobile phase, suggesting minimal selectivity differences between the two conditions. As the pH was increased, the selectivity differences for the peptide probes diminished— particularly when using the anionic ion-pair reagents TFA, HFBA, ClO4-, and BuSO3-. At pH 2.3, the peptide probes possessed more positive character than negative charge, which facilitated ion-pair formation, whereas under pH 7.5 conditions, the peptides possessed a mixture of negative and positive residues in the chain. As such, the peptides possessed an overall neutral or slightly negative surface charge, which would not interact sufficiently with the anionic ion-pair reagents.
Although the mobile phase characterization was based on a C18 column, there was a good indication that the results may be applicable to a wide range of commercially available stationary phases that includes those possessing a neutral, polar/negative, or positive character (see reference 7, supplementary material figure 2).
Establishment of a Screening Strategy for Development of Methods for Assessment of Pharmaceutical Peptide Purity (8)
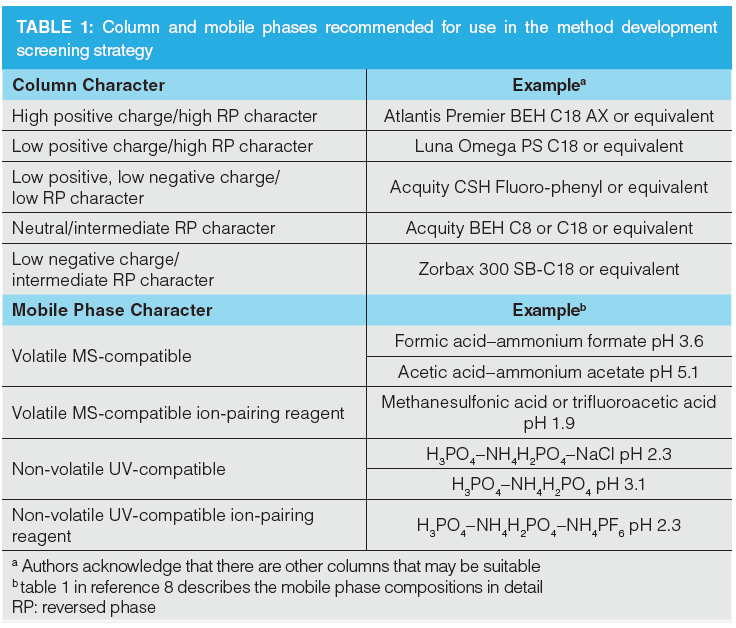
The findings from the column and mobile phase characterization were combined into a reversed-phase ultrahigh-pressure liquid chromatography (UHPLC) method development screening strategy for the rapid assessment of peptide‑based pharmaceutical purity (8) using automated column and mobile phase screening technologies (see next section). The protocol recommends the use of five disparate columns with varying degrees of charge—positive and negative/ hydrophobic character—and six volatile/ nonvolatile mobile phases within the pH range of 2.3 to 5.1 (see Table 1). The ion‑pair/chaotropic reagent ammonium hexafluorophosphate at pH 2.3 was shown to be an extremely useful mobile phase additive, as it produced highly complementary selectivity and good peak shape. Methanesulfonic acid was found to be a good alternative to the ubiquitously employed TFA, which failed to generate acceptable separation for the many peptides investigated, highlighting the importance of screening disparate mobile phase additives. However, TFA was found to be vital for acceptable chromatography of highly basic peptides such as melittin.
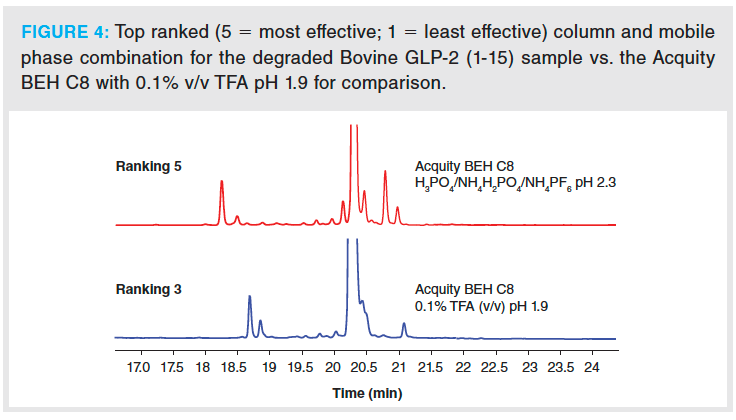
The success of the method development strategy was demonstrated using a range of degraded peptides and peptide diastereomers corresponding to a racemization of a single amino acid in the target sequence. The protocol was found to be highly effective for identifying UHPLC conditions that generate complementary selectivity, good peak shape, and a high probability of separating the peptide impurities (see Figure 4). For this type of sample, it is important to use mobile phases with high ionic strength to mitigate mass overload, which can lead to a very broad/asymmetric main peak; this is turn can result in the possible masking of closely eluting impurities (7). The screening also identified partial separation of all the diastereomeric products (see Figure 5), which could form the basis of a good starting point for further optimization.
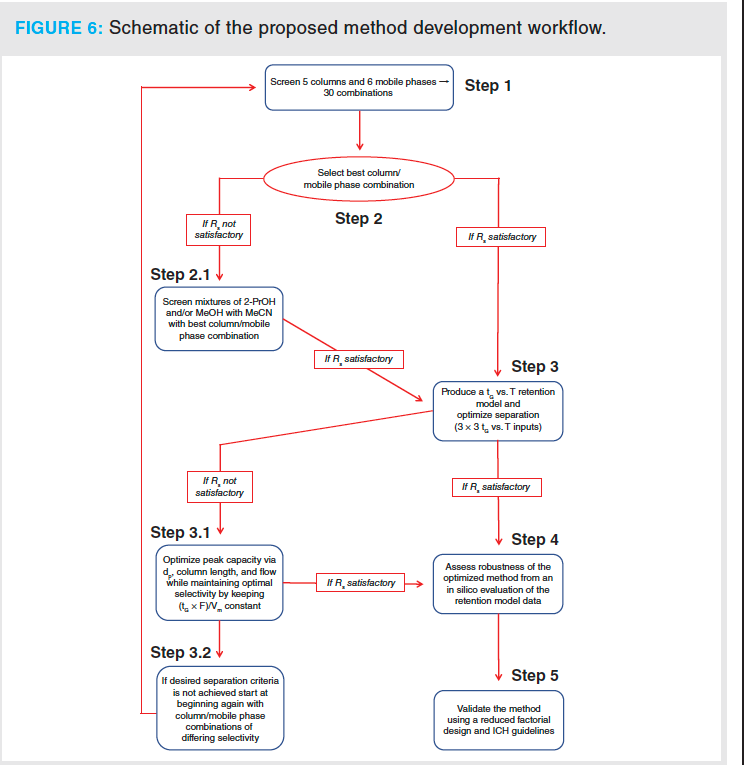
Recommended Method Development Strategy (Figure 6)
From the initial screening of five columns and six mobile phases (Step 1, 30 total combinations), the best column/mobile phase combination that satisfied the pre-set separation criteria (Step 2) was used to construct a 3 × 3 (Step 3, nine input experiments) gradient time vs. temperature (tG vs T) retention model (17). If adequate resolution is not achieved, different organic modifiers, such as isopropanol (2‑PrOH) or methanol (MeOH) in place of or in combination with acetonitrile (MeCN) as an optional step (Step 2.1), can be investigated. Due to the high viscosity of 2-PrOH, it is typically used in combination with MeCN, for example, 20:60:20 (v/v/v) 2-PrOH–MeCN–H2O.
There were relatively large differences in retention of GLP-2 (1-15), insulin, angiotensin I, and melittin when using the different column and mobile phase combinations (see reference 8 and 9 and Figure 5). Most column and mobile phase combinations have a retention relative to the C8 column, with TFA within ±20%. The largest differences in relative retention were observed for acetic acid–ammonium bicarbonate buffer (AA–NH4HCO3 pH 7.0) in combination with the fluorophenyl columns (56% decrease in retention compared with the C8 column). This information is important for the design of column and mobile phase screens. Based on the retention for a scouting gradient employing the C8 column with TFA, it is possible to either extend or shift the screening gradient to achieve sufficient retention with the fluorophenyl column.
Our data from the use of ammonium hexafluorophosphate and methanesulfonic acid have shown that these additives do not adversely affect the stability of C18 columns, nor cause any irreversible adsorption/memory effects. No pH hysteresis effects were observed with any of the stationary phases on mobile phase pH cycling. Although no major problems have been observed with the use of the novel mobile phase additives ammonium hexafluorophosphate and methanesulfonic acid, the authors would recommend that these mobile phases be used with caution until their appropriateness for long-term, routine use has been established.
From the two-dimensional model of the dependence of retention on gradient time and temperature, the elution conditions (temperature, initial and final %B in the gradient, and the gradient slope) can be adjusted to produce a candidate separation (Step 3). This separation can then be further fine-tuned to increase the resolution or shorten the analysis by investigating the resolution as a function of particle size (dp), column length, and flow rate while maintaining a constant optimal selectivity by keeping (tG × F)/ Vm constant (18) (Step 3.1). Once the optimum method has been located, the robustness of the proposed methodology can be assessed from the retention model (Step 4). The effect of small permittable changes to the gradient slope and temperature on the separation criteria can be rapidly performed in silico to provide both graphical (calculated chromatograms) and numerical (δtR/ δ%MeCN and δtR/δT) guidance for system suitability adjustments. If the methodology appears to be robust, it can be validated experimentally using a reduced factorial design (19) and ICH guidelines (20) (Step 5). If the desired separation criteria have not been met (Step 3.2), then another set of column and mobile phases with different selectivity should be chosen, and the process restarted (Step 1).
2D-LC–MS-Based Determination of Peak Purity (9,10)
The final two papers in the series (9,10) describe a strategy for determination of peak purity using 2D-LC–MS, based on the findings from papers (4–8), where the focus was on isomer selectivity using volatile mobile phases to allow MS detection. The objective was to identify column and mobile phase combinations that can be coupled in the first (1D) and second dimension (2D) separation to maximize the probability of determining isomers that may coelute in the 1D separation. One typical application for peak purity analysis using 2D‑LC–MS would be during the validation of reversed-phase chromatography methods used for the analysis of peptide-based pharmaceuticals, to investigate whether an isomeric impurity coelutes with the main peak.
Furthermore, in addition to the need to identify suitable column and mobile phase combinations, an additional challenge involves defining the very shallow gradient required for the 2D separation. To achieve this, retention modelling (18) was investigated to assess if this could be employed to define such gradients in a rational way. Reference 9 focuses on the selection of suitable columns and mobile phases, whereas reference 10 aims to define and illustrate proof-of-concept for a workflow that yields appropriate gradient conditions for the second dimension.
Our findings suggest that a logical peak purity strategy based on 2D‑LC–MS would consist of coupling the existing 1D peak purity methodology (as currently used in the laboratory) with a 2D separation consisting of a neutral character C8/C18 column and acetic acid–ammonium acetate (AA–NH4AA pH 5.1), which has been shown to be highly effective for the separation of isomers (for example, see Figure 7). If poor peak shape is obtained with AA–NH4AA pH 5.1, an alternative mobile phase that could be employed would be TFA. Formic acid–ammonium formate (FA–NH4FA pH 3.6) is also an alternative, but TFA is more likely to give improved peak shape for basic peptides due to its ion-pairing properties. If the 1D method that is being evaluated for peak purity involves a mobile phase consisting of AA–NH4AA pH 5.1, then it is recommended that the 2D separation utilizes TFA or FA–NH4FA pH 3.6 mobile phases.
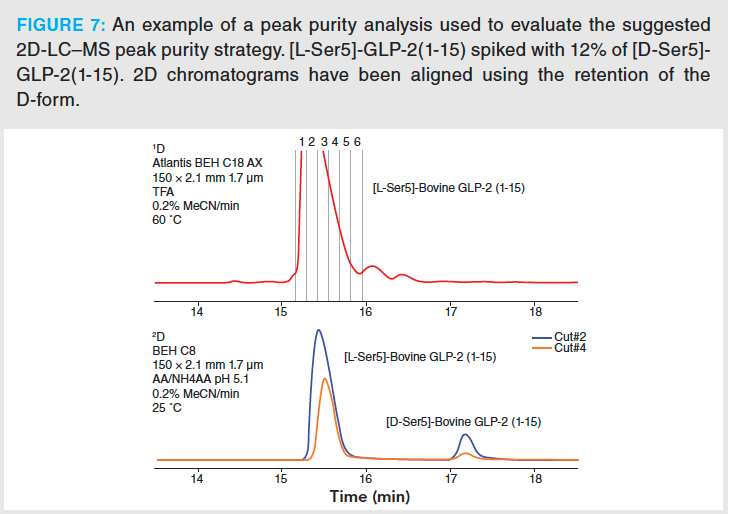
Previous investigations concluded that the MS response for peptides when using mobile phases buffered with FA–NH4FA pH 3.6, TFA, or AA–NH4AA pH 5.1 is approximately 20, 20, and 5% of the MS signal obtained with 0.1% formic acid (see reference 7, supplementary material table S1). With a typical sample load of approximately 3 μg of peptide on column, these responses should allow determination of isomers levels at <0.1% of the main component when using 2D‑LC–MS. An example of results obtained from this workflow for the development of a 2D‑LC–MS method is shown in Figure 7.
Conclusion
A peptide reversed-phase chromatographic column and mobile phase characterization protocol was developed using peptide probes synthesized for the purpose of interrogating the effects of mobile and stationary phase chemistry on separation selectivity. These probe molecules reflect chemistries encountered in common degradation pathways of peptides that include isomerization, racemization, and deamidation products that are often challenging to separate. Forty‑four differing columns, all described by their manufacturers to be suitable for peptide analysis, and 51 different UV- and MS‑compatible mobile phases, covering a pH range of 1.8 to 7.8 (including ion‑pair reagents), have been characterized using the Peptide RPC Characterization Protocol. PCA was used to successfully categorize the columns into three sub-classes. This procedure was validated in that columns shown to be similar in the PCA score plots did, in fact, yield similar impurity profiles for several peptides. At the same time, columns judged to be dissimilar in the PCA score plots produced different selectivity profiles with several peptide samples. This allowed the selection of columns with complementary chromatographic selectivity for method development strategies, or similar ones in the case where “equivalent” columns were needed.
PCA of the data resulting from the study of different mobile phases highlighted that pH was a major contributor to selectivity. The chaotropic/ion-pair reagent ammonium hexafluorophosphate was found to generate interesting selectivity differences and merits further investigation. TFA, which has been ubiquitously employed in the analysis of peptides, was demonstrated to suppress selectivity differences between the stationary phases that are otherwise evident when using other mobile phases.
A reversed-phase chromatography method development strategy (30 total mobile/stationary phase combinations using screening technologies) based on the PCA findings was proposed and employed to separate a number of peptides and their impurities (including their diastereomers).
Finally, the work has identified columns and mobile phases that are sufficiently complementary and can be used in the second dimension of 2D-LC–MS methods for the purpose of assessing main peak purity in candidate reversed‑phase chromatographic methods.
Acknowledgements
Special thanks to Novo Nordisk for providing funding for research work by Jennifer Field and Ming Yui Cheung, and to Shimadzu and Agilent for providing UHPLC instrumentation used within this study. Dwight Stoll and Maria Sylvester were supported by an award from the Agilent Technologies University Relations Programme. We thank Agilent, Phenomenex, Supelco, and Waters Ltd for supplying the large number of columns required for this work. Finally, we thank Sartorius Ltd for providing the SIMCA PCA software and ACD/Labs for providing retention modelling software.
References
1) Top 10 Blockbuster Drugs In 2021, Nasdaq, accessed 24 Jan. 2022: https://www.nasdaq.com/articles/top-10-blockbuster-drugs-in-2021
2) The top selling prescription drugs by revenue, accessed 24 Jan. 2022: https://www.pharmaceutical-technology.com/analysis/top-selling-prescription-drugs/
3) R.S. Rogers, N.S. Nightlinger, B. Livingston, P. Campbell, R. Bailey, and A. Balland, mAbs 7, 881–890 (2015).
4) J.K. Field, M.R. Euerby, P. Petersson, J. Lau, and H. Thøgersen, J. Chromatogr. A 1603, 113–129 (2019).
5) J.K. Field, M.R. Euerby, and P. Petersson, J. Chromatogr. A 1603, 102–112 (2019).
6) J.K. Field, M.R. Euerby, and P. Petersson, J. Chromatogr. A 1622, 461093 (2020).
7) J.K. Field, M.R. Euerby, K.F. Haselmann, and P. Petersson, J. Chromatogr. A 1641, 461986 (2021).
8) M.Y. Cheung, J. Bruce, M.R. Euerby, J.K. Field, and P. Petersson, J. Chromatogr. A 1668, 462888 (2022).
9) P. Petersson, S. Buckenmaier, M.R. Euerby, and D.R. Stoll, submitted to J. Chromatogr. A (2022).
10) D.R. Stoll, M. Sylvester, S. Buckenmaier, M.R. Euerby, and P. Petersson, submitted to J. Chromatogr. A (2022).
11) L.R. Snyder, J.W. Dolan, and P.W. Carr, J. Chromatogr. A 1060, 77–116 (2004).
12) K. Kimata, K. Iwaguchi, S. Onishi, K. Jinno, R. Eksteen, K. Hosoya, M. Arki, and N. Tanaka, J. Chromatogr. Sci. 27, 721–728 (1989).
13) M.R. Euerby and P. Petersson, J. Chromatogr. A 994, 13–36 (2003).
14) U.D. Neue, J.E. O’Gara, and A. Méndez, J. Chromatogr. A 1127, 161–174 (2006).
15) M.R. Euerby, M. Fever, J. Hulse, M. James, P. Petersson, and C. Pipe, LCGC Europe 29, 8–21 (2016).
16) ACD/Labs Column Selector: https://www.acdlabs.com/resources/free-chemistry-software-apps/column-selector/
17) P. Petersson, J. Munch, M.R. Euerby, A. Vazhentsev, M. McBrien, S.K. Bhal, and K. Kassam, Chromatography Today 3, 15–18 (2014).
18) P. Petersson, B.O. Boateng, J.K. Field, and M.R. Euerby, LCGC Europe 31, 120–143 (2018).
19) B. Kovács, L.K. Kántor, M.D. Croitoru, É.K. Kelemen, M. Obreja, E.E. Nagy, B. Székely-Szentmiklósi, and Á. Gyéresi, Acta Pharm. 68, 171–183 (2018).
20) International Council for Harmonization, ICH Topic Q2 (R1): Validation of Analytical Procedures: Text and Methodology (ICH, Geneva, Switzerland, 2005).
ABOUT THE AUTHORS
Jennifer K. Field was a PhD student at the University of Strathclyde and is now a research scientist at the Shimadzu Centre of Excellence.
James Bruce is a senior lecturer in chemistry at the Open University.
Stephan Buckenmaier is a R&D principal scientist in the Liquid Phase Separation Division at Agilent Technologies.
Ming Yui Cheung was a research associate at the Open University; she has recently taken up a position as a mass spectroscopist at Oxford Nanopore Technologies.
Melvin R. Euerby is the principal scientist at the Shimadzu Centre of Excellence and visiting professor at the Open University and the University of Strathclyde.
Kim F. Haselmann is a principal scientist at Global Research Technology at Novo Nordisk.
Jesper F. Lau is scientific director in Research Chemistry, Global Research Technology at Novo Nordisk.
Dwight Stoll is professor of chemistry at the Gustavus Adolphus College in Minnesota, USA.
Marie Sylvester is a student at the Gustavus Adolphus College.
Henning Thøgersen was a principal scientist at the Diabetes Structural Biology Department, Global Research Technology at Novo Nordisk but has now retired.
Patrik Petersson has recently taken up a position as principal scientist at Ferring Pharmaceuticals.

Study Explores Thin-Film Extraction of Biogenic Amines via HPLC-MS/MS
March 27th 2025Scientists from Tabriz University and the University of Tabriz explored cellulose acetate-UiO-66-COOH as an affordable coating sorbent for thin film extraction of biogenic amines from cheese and alcohol-free beverages using HPLC-MS/MS.
Quantifying Microplastics in Meconium Samples Using Pyrolysis–GC-MS
March 26th 2025Using pyrolysis-gas chromatography and mass spectrometry, scientists from Fudan University and the Putuo District Center for Disease Control and Prevention detected and quantified microplastics in newborn stool samples.


