Pulsed Electrochemical Detection: Waveform Evolution
LCGC North America
Developments in pulsed electrochemical detection are traced through the progression of its waveforms.
Pulsed electrochemical detection (PED) is entering its fourth decade of existence, and through the years a diversity of waveforms has been described in the literature. The rise of PED for the direct and sensitive detection of polar, aliphatic compounds following liquid chromatography (LC) or electrophoresis separations can be chronicled through the evolution of its waveforms. Along the way, some waveforms have flourished to gain favor and acceptance in chemical and biochemical analysis, while others have become extinct. The purpose of this column is to trace the developments of PED through the progression of its waveforms.
The primordial soup from which pulsed electrochemical detection (PED) arose is that of dc amperometry (1,2), whose waveform is a constant applied potential over time (Figure 1). Using dc amperometry as a means of electrochemical (EC) detection following chromatographic separations has proven to be a powerful analytical technique for the determination of compounds that undergo oxidation and, less commonly, reduction. The first commercial EC detector for high performance liquid chromatography (HPLC), whose popularity can be directly attributed to its high sensitivity, often high selectivity, and wide linear range, was introduced in 1974. In addition to EC detectors' relatively simple construction and ruggedness, their electrochemical cells easily adapt to miniaturization (for example, capillary electrophoresis and lab-on-a-chip devices) because the response is dependent on electrode area and not pathlength, as in optical absorbance methods.
The earliest applications of dc amperometry in liquid chromatography (LC) were for the determination of neurotransmitters in complex biological samples (for example, brain extracts), drugs and their metabolites in physiological fluids, and contaminants in environmental samples. These analytes tend to have aromatic organic structures (for instance, phenols, aminophenols, catecholamines, and other metabolic amines), and, as a consequence, they are readily oxidized at inert electrodes (gold, platinum, and carbon, for example) by applying a constant applied potential due to stabilization of free-radical intermediates via electronic resonance, or p-resonance. This stabilization is derived from the molecule's extended conjugation, which significantly lowers the activation energy barrier for the electrochemical reaction. Hence, these compounds are considered to be self-stabilized. In contrast, self-stabilization of reaction intermediates is not available to polar aliphatic molecules (for example, carbohydrates and biogenic amines), and the rate of their oxidation is either very slow or nil even though oxidation of the molecule may be favored thermodynamically (3).
In dc amperometry, the electrode only functions to accept or donate electrons in the detection mechanism, and the working electrode ideally should be inert. Any electrochemical involvement of the electrode (for example, adsorption of reactants or products) is detrimental to the detection process and leads to electrode deactivation. Thus, glassy carbon electrodes are popular in dc amperometry because of their resistance to fouling, which often occurs over a period of hours or days. As a result, the electrode surface must be mechanically polished or some other method of electrode reactivation must be undertaken on a daily basis to maintain response sensitivity and reproducibility.
In "electrocatalytic" detection, the electrode does play an active role in the Faradaic detection process by exploiting the adsorption of reaction intermediates to the electrode surface, which lowers the activation energy barrier and facilitates oxidation of the analyte. This process often leads to a dramatic increase in the rate of electrode deactivation, or fouling, which can lead to complete passivation of the "working" electrode within seconds. Carbohydrates have been detected under alkaline conditions using dc amperometry at some transition metal (for example, Cu, Ag, Co, and Ni) electrodes with little or no evidence of short-term fouling. A seminal paper by Fleischmann and colleagues (4) in 1972 discussed the mechanism of oxidation of carbohydrates and amines at oxide-covered transition metal electrodes. These electrodes have found limited commercial use due to their long-term instability and lack of reproducibility. Noble metal (such as Au and Pt) electrodes also exhibit high activity toward polar, aliphatic compounds, but signals are short-lived because of rapid fouling of the electrode surface. To perform analytical relevant detections following a separation, noble metal electrodes must be continuously reactivated, or "cleaned," on-line; and of all the possible cleaning pretreatments, only electrochemical reactivation can be performed effectively.
The Dawn of a New Era: Detection of Polar, Aliphatic Compounds
The beauty of evolution is that often simple mutations can lead to more resilient and successful species. In this case, the origins of PED can be traced to a mutated dc amperometric waveform with added alternated positive and negative potential pulses, which proved to be an effective means of cleaning and reactivating noble metal electrodes on-the-fly. The advent of PED and the dawn of a new era of detection using pulsed potential waveforms began in 1981 with two foundational papers by Professor D.C. Johnson. These papers introduced the world to pulsed amperometric detection (PAD) for simple alcohols at Pt electrodes in flow-injection systems (5,6). The family of PED waveforms includes the genus of PAD. An in-depth review of all these techniques has been published in a book by LaCourse (7).
At about the same time, the separation of carbohydrates was coevolving in the field of chromatography with the introduction of polymer-based columns that resolved carbohydrates as anions under highly alkaline conditions. Interestingly, the detection of carbohydrates was accomplished at Au electrodes under alkaline conditions using a three-step potential-time waveform. This symbiotic relationship between separation and detection technologies led to high performance anion-exchange chromatography (HPAEC)–PAD for the direct and sensitive analysis of carbohydrate mixtures (8,9). The analytical significance of this technique is probably best reflected in that it continues to be the leading detection technique for carbohydrates and is available from numerous commercial manufacturers.
PAD applied to Au and Pt electrodes originally consisted of a three-step potential-time waveform (Figure 1) (10–13). In this waveform, detection occurs at potential Edet, during the period tdet, with sampling of the Faradaic signal over the time period tint after a delay of tdel to overcome capacitance currents. Thereafter, oxidative cleaning of the electrode occurs at potential Eoxd during the period toxd, followed by reductive reactivation at Ered during the period tred. Typically, the total waveform cycle (ttotal = tdet + toxd + tred) is approximately 1 s with a frequency of approximately 1 Hz. It should be noted that PAD has been implemented using a two-step potential waveform (14) for adaptation of its use to a wider variety of commercial potentiostats, but its inability to maintain long-term electrode activity limited its common usage. This PAD waveform was similar to a square wave with detection and anodic cleaning combined in the same potential step followed by the cathodic reactivation step.
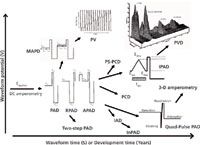
Figure 1: The evolution and diversity of PED waveforms or the PED family tree.
The output signal was originally the average of the current (amperes or coulombs per second) over tint of 16.7 ms (commercially labeled PAD-I), which minimized the contribution of 60-Hz line noise. Extension of this strategy led to the integration of an integral number of 16.7-ms periods, which resulted in a significant increase in analytical signal while maintaining a minimal contribution from line noise. A multiple of 12 periods, or 200 ms, soon became known commercially as PAD-II, which had the advantage of also being an integral multiple for reducing 50-Hz noise (a power system standard in other countries). Eventually the signal output was changed to the integrated charge (for example, units of coulombs), and the corresponding waveform and technique was called pulsed coulometric detection (PCD) (15,16). This small change would eventually allow for the development of more advanced PED waveforms.
Presently, integrations of any time period fall under the umbrella of PAD. Although longer integration intervals are possible, there is a limit to the benefits of extending the integration interval for two reasons. Firstly, the time constraints of the overall cycle of the PAD waveform will eventually become large enough to compromise chromatographic peak resolution. Secondly, the longer the analyte is detected the more electrode fouling occurs, and as a consequence, the signal-to-noise ratio (S/N) can actually worsen.
Although the original PAD waveform was optimized using pulsed voltammetry, vide infra, for high sensitivity, a four-potential step waveform that was termed the quadruple-potential waveform (Figure 1), was developed to improve long-term reproducibility (17). During the detection step of a PED waveform, soluble Au species are generated, which result in recession of the electrode over time. The quadruple-potential pulse waveform applies a large negative potential step Ered for a brief period tred after the detection step to reduce any partially solvated Au species back to metallic Au. In addition, this step invokes reductive "cleaning" of the electrode surface. The negative potential step is followed by a brief positive potential step (Eoxd, toxd) to activate the electrode surface, which is subsequently followed by a negative potential pulse to effect adsorption and preconcentration of the analyte on the electrode surface (Eads, tads). This highly evolved four-step potential waveform, which is commercially known as pulsed amperometry, has become the dominant PAD waveform for virtually all carbohydrate detection methods. Figure 2 shows the separation of a mixture of six monosaccharides typically found in mammalian glycostructures using HPAEC–PAD. This application revolutionized glycoprotein characterization.
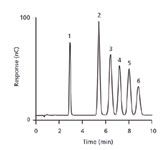
Figure 2: HPAEC separation of six carbohydrates typically found in mammalian glycoproteins using PAD with a four-step potential waveform at a gold working electrode. Peaks (1 nmol): 1 = fucose, 2 = galactosamine, 3 = glucosamine, 4 = galactose, 5 = glucose, 6 = mannose.
A requirement of all modes of detection in PED is adsorption of the analyte to the noble metal electrode. This key feature has led to the development of several approaches to indirect detection in PED, which involves the suppression of oxide formation by the analyte. It was first investigated by Polta and Johnson (18) and later Welch and colleagues (19,20). Unfortunately, the extent of oxide formation is highly sensitive to numerous system parameters (for example, pH, ionic strength, organic modifiers, and temperature), which is deleterious to system performance and reproducibility. In addition, many analytes have a Faradaic response at the potentials of oxide formation that further complicates accurate quantitation of even well-separated compounds.
Another form of indirect detection has been investigated that uses the suppression of mobile phase constituents. Doscotch and colleagues (21) tried to circumvent the problems of indirect detections by exploiting the suppression of the large reduction signal resulting from the electrochemical reduction of dissolved oxygen in the mobile phase. This approach was called indirect adsorption detection (IAD) and was found to be more tolerant to changes in pH than indirect detections based on oxide formation suppression, but it suffered from poor interday precision due to the inability to accurately control the amount of dissolved oxygen in the system. LaCourse and colleagues (7) presented an alternate mode of indirect detection using PED based on the controllable addition of a PED-active reagent to the mobile phase to generate a stable anodic background signal. This approach exploits the well-understood anodic response of polyols and carbohydrates that occur at potentials where oxide formation is minimal. Olson (22) applied this approach to the determination of amino acids and proteins with detection limits in the low picomole and low femtomole levels, respectively. This method, called indirect pulsed electrochemical detection (InPED), allows the use of a single, optimized waveform to detect a wide variety of compounds and depends on an easily controlled background signal.
It is important to remember that all indirect detection approaches in PED are based on the basic PAD waveform.
Special Adaptations: Dealing with Oxide-Catalyzed Reactions
The detection of carbohydrates and related analogues occurs in a potential region of the electrode that is essentially free of signal from oxide formation; hence the mechanism of detection is termed oxide-free detection. The oxidation of amine and S-containing analytes occurs via an oxide-catalyzed mechanism that requires the concomitant formation of surface to catalyze the anodic oxygen transfer process. The use of the PAD waveforms at the higher potentials required for oxide-catalyzed detections typically results in a large background signal that compromises the measurement of analyte response, is sensitive to variations in mobile phase conditions, and leads to post-peak dipping.
Modifications, or special adaptations, of PAD waveforms occurred in an effort to alleviate the detrimental effects of signal from oxide-formation during the detection process. Early work by Gilroy (23,24) showed that the growth of oxide on the electrode surface can be frozen if the potential is initially pulsed to a particular value and concertedly stepped to a lower potential, where oxide formation is still favored. Polta and Johnson (25) first exploited this effect by reversing the Eoxd and Ered potential pulses of a PAD waveform, which was coined reverse pulsed amperometric detection (RPAD) (Figure 1). The use of this waveform resulted in significantly lower baselines for the detection of sulfur compounds at a gold electrode. These results were corroborated by Williams and Johnson (26) for the oxidation of As(OH)3 at a Pt electrode under acidic conditions. Eventually it was shown that the RPAD waveform inherently provided insufficient oxidative cleaning of the electrode surface, which often resulted in distortion of chromatographic peaks in HPLC-RPAD.
The problem of RPAD was easily overcome by adding a fourth potential pulse (Eact) before Edet (Figure 1). This more complex waveform combines the effects of activating the oxide, as in RPAD, and of maintaining the cleaning and adsorption characteristics of the PAD waveform. The waveform was known as either activated pulsed amperometric detection (APAD) (26) or four-step PAD (27). Williams and Johnson (26) were able to achieve a transport-limited signal for the oxidation of As(OH)3 at a Pt electrode only by using an APAD waveform.
Both RPAD and APAD suffered from three drawbacks intrinsic to the basic premise that surface oxide formation stops completely if the applied potential is pulsed to a particular value and concertedly stepped to a lower potential, where oxide formation is still favored. First, Roberts and Johnson (28) determined that oxide formation does not completely stop when a gold electrode is used; and, unfortunately for PED, the majority of applications are performed at a gold electrode. Secondly, the length of time that oxide-formation can be stopped or lessened before it begins to grow significantly again is usually less than needed for optimal detection conditions. Finally, as oxidation of an analyte ensues, surface oxide is consumed, which results in either a changing background in the presence of the analyte or a less than maximal signal. The Welch group (19,20) has been the most prominent in testing advanced waveforms for oxide-catalyzed detections. They eventually found that PAD performance for the detection of penicillins and related compounds was as good as or superior to both RPAD and APAD.
Although RPAD and APAD are virtually extinct, a more successful mutation was the incorporation of a cyclic potential sweep into the detection (see Figure 1). This change in detection strategy resulted in the coulometric rejection of the large background signals originating from surface oxide formation (29–31). This waveform was originally called potential sweep-PCD (PS-PCD), but it is technically termed integrated pulsed amperometric detection (IPAD) (32) and commercially coined integrated amperometry. It is sometimes referred to as integrated voltammetric detection (IVD).
In the IPAD waveform, the potential is scanned in a rapid cyclic fashion between the values Edst to Edmx to Edndwith a concurrent and continuous electronic integration of the amperometric signal. The values of Edst, Edmx, and Ednd are chosen to correspond to potential regions before oxide formation occurs, maximal mass-transport dependent signal from the analyte oxidation, and postcathodic dissolution of the surface oxide, respectively. Hence, in theory, the anodic formation of the oxide required to catalytically stimulate the detection process does not contribute to the total integration of the amperometric signal. In other words, analyte and oxide formation signal minus oxide dissolution signal gives the response only for the analyte, which makes the detection appear to be independent of the oxide formation process. Because the anodic reactions of aliphatic compounds are highly irreversible, there is no cathodic contribution to the total integral from reduction of the detection products during the scan from Edmxto Ednd. A variation on the IPAD waveform incorporates a square wave in place of a triangular wave as part of the detection step.
The advantage of IPAD compared with PAD relates to maximization of the analyte signal and minimization of baseline magnitude and drift for oxide-catalyzed detections. There is no significant difference in S/N between PAD and IPAD for carbohydrates. On the other hand, the IPAD waveform has been highly successful for the determination of amine- and sulfur-containing compounds. The analytical utility of the IPAD waveform has been demonstrated from simple mixtures of amino acids separated isocratically using anion exchange chromatography (33) to its incorporation into a commercial system (AAA-Direct, Dionex Corporation, Sunnyvale, California), which uses an anion-exchange column with a quaternary gradient that incorporates both a pH and an organic modifier gradient to directly detect amino acids with quantitation limits of typically 1–50 pmol injected with comparable sensitivities for primary and secondary amino acids (Figure 3).
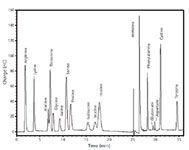
Figure 3: ICâPED chromatogram for a mixture of 17 amino acids (AA-S-18 standard from Sigma) using an AAA-Direct system (Dionex). Direct detection of primary and secondary amino acids was achieved by IPAD. Peaks at 500 pmol each.
As with amine-containing compounds, sulfur compounds are strongly adsorbed at the oxide-free surfaces of Au and Pt electrodes. As a consequence, sulfur-containing compounds are best detected using IPAD. Electrode fouling is more prevalent when detecting sulfur compounds than either alcohol or amine compounds, which often require the use of more aggressive waveforms (7). Because sulfur-containing compounds are amenable to sensitive and selective detection under mildly acidic conditions, almost all papers published using IPAD have used it following reversed-phase separations. The IPAD waveform typically gives limits of detection on the order of 1 pmol injected. Studies by LaCourse (34–37) have focused on the analysis of sulfur-containing compounds and antibiotics.
Pinnacles of Evolution: Information-Rich Waveforms
Numerous variations of PED waveforms (for example, PAD, RPAD, APAD, and IPAD) have been tested, and through the process of natural selection only those that can survive the rigors of the analytical testing environment have flourished and are still in existence. Even more complex waveforms have been employed to a limited degree to either afford greater sensitivity or enhanced selectivity.
LaCourse and Dasenbrock (37,38) focused on HPLC–IPAD analysis of sulfur-containing antibiotics for their determination within milk extracts using a modified IPAD waveform that incorporated five cyclic scans in the detection step. This multicycle detection step was shown to give lower LODs for many sulfur-containing species. This complex waveform more efficiently exploits the formation and utilization of transient oxide intermediates for oxide-catalyzed detections. In addition, the average of the signals from the individual cycles is outputted, which should result in an n½ increase in S/N. The expected increase in S/N is not totally realized because the use of fast consecutive cyclic sweeps does not allow for the complete adsorption of fresh analyte between each cycle, and the maximum benefit of multicycle waveforms is often achieved with four or five cycles. It is also important to remember to keep the overall cycle time of the IPAD waveform short enough to maintain chromatographic peak integrity. Figure 4 shows the isocratic separation on a reversed-phase column of eight sulfa drugs with detection at a gold electrode using a multicycle IPAD waveform.
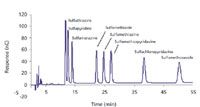
Figure 4: Detection of sulfa drugs (approximately 1 ppm) using IPAD with a multicycle detection step at a gold electrode following an isocratic reversed phase separation.
The ability to monitor the electrochemical response of a compound at two different potentials is analogous to a "dual-wavelength" UV absorption detector. Not only can one differentiate on the basis of voltammetric resolution (for example, different potentials monitored), but qualitative information is provided on a particular analyte in that the ratio of the responses at each potential will be characteristic of a compound's hydrodynamic voltammogram. In PAD, dual-potential monitoring can be accomplished easily at a single electrode by using multiplex-pulsed amperometric detection (MPAD). The MPAD waveform is essentially two three-step potential waveforms coupled together using two different Edet potentials, see Figure 1. The independently collected signals can be mathematically manipulated to improve selectivity or determine peak purity by plotting the ratio of the two potentials monitored.
Multicyle and MPAD waveforms eventually led to the appearance of pulsed voltammetry, or PV (Figure 1), which is commonly applied to a flow-through or rotating disk electrode that is under hydrodynamic control in a batch system (for instance, no separation system). By expanding the concept of MPAD to incorporating small incremental changes in a single parameter over a predefined range in a series of coupled PAD waveforms, optimal PAD waveforms parameters (for example, Edet) can be readily obtained. Previous applications of PV have focused primarily on the study of electrochemical response mechanisms at noble metal electrodes or on the optimization of Edet to be used in HPLC–PAD. LaCourse and Johnson (39) extended the concept of PV to study the effect of all waveform parameters on PAD response, and PV has been determined to be the definitive method for the optimization of PED waveforms to be applied in HPLC detection.
This information-rich branch of PED waveforms shows the speciation of the IPAD waveform into two very different analytical techniques. The IPAD waveform can be modified to record the current as a function of the applied scanning potential to generate three-dimensional data in the form of a current-potential, or i-E, plot at every chromatographic time. This PED technique, which allows for on-the-fly voltammetry, is known as pulsed voltammetric detection (PVD) (40). Figure 1 shows a surface plot of current vs. potential vs. time for the separation of lysine, galactosamine, serine, and sucrose using HPLC–PVD (7). These plots are background-corrected on-the-fly. Note that the amine-containing compounds (for example, lysine, galactosamine, and serine) have signals at high potentials, whereas the compounds with hydroxyl groups (for example, galactosamine, serine, and sucrose) have signals in the oxide-free region of the electrode. At any potential a chromatogram can be extracted to afford greater selectivity, and at any time point a voltammogram can be extracted to identify or characterize the analyte or peak. The results shown here illustrate the feasibility and doubtless importance of PVD to enhance selectivity and compound characterization, afford a limited degree of functional group identification with peak purity, and allow for quantitation of the compound of interest. The benefits of on-line voltammetric detection in chromatography have been previously reviewed (7,41,42).
In 2005, Dionex Corporation introduced 3-D amperometry (43), which essentially delivers current versus time plots at every chromatographic time point. This information-rich three-dimensional data output allows for signal optimization and compound fingerprinting. The data are viewed in wireframe or iso-amperometric displays to study reaction characteristics of analytes. Integration periods for pulsed amperometry are easily optimized post-run without having to reinject samples. This capability is especially useful for waveform optimization of Edet time parameters.
Conclusions
The evolution of PED waveforms over the past three decades has resulted in a diversity of waveforms. This richness is a product of the exploitation of electrocatalytic detection mechanisms at noble metal electrodes to visualize analytes following LC, ion chromatographic, and electrophoretic separations. Pulsed potential cleaning eliminates the need for daily polishing of the electrode, which renders PED more convenient experimentally than dc amperometry, and allows for the direct, sensitive, and reproducible detection of an expanding range of polar, aliphatic compounds (for example, carbohydrates, amines, and sulfur-containing compounds). Because electrochemical detection relies on a reaction at the electrode surface, detector cells can be miniaturized without sacrificing sensitivity. PED techniques have been applied to preparative, normal bore, micro, nano, and capillary chromatographic techniques, as well as capillary electrophoresis and lab-on-a-chip (44) devices.
Through evolution and speciation, significant advancements in PED have been made for the detection of amine and sulfur compounds with an emphasis on advanced, information-rich waveforms (for example, IPAD, PVD, and 3-D amperometry). The impressive accomplishments in HPLC–PED and IC–PED, thus far, have only accentuated the need for a deeper understanding of PED, its limits, and application of this technology to real-world bioanalytical problems of critical significance.
Acknowledgments
The author would like to gratefully acknowledge the many discussions and interactions with Professor Dennis C. Johnson, and appreciates the financial support from Dionex Corporation.
References
(1) R.N. Adams, Electrochemistry at Solid Electrodes (Marcel Dekker, New York, New York, 1969).
(2) P.T. Kissinger in Laboratory Techniques in Electroanalytical Chemistry, P.T. Kissinger and W.R. Heineman, Eds. (Marcel Dekker, New York, New York, 1984).
(3) S. Gilman in Electroanalytical Chemistry, A.J. Bard, Ed. (Marcel Dekker, New York, New York, Vol. 2., 1967).
(4) M. Fleischmann, K. Korinek, and D. Fletcher, J. Chem. Soc., Perkin Trans. 2, 1396–1403 (1972).
(5) S. Hughes, P.L. Meschi, and D.C. Johnson, Anal Chim. Acta 132, 1–10 (1981).
(6) S. Hughes and D.C. Johnson, Anal. Chim. Acta 132, 11–22 (1981).
(7) W.R. LaCourse, Pulsed Electrochemical Detection in High-Performance Liquid Chromatography (Wiley Interscience, New York, New York, 1997).
(8) P. Edwards and K.K. Haak, Amer. Lab., April, 78–87 (1983).
(9) R.D. Rocklin and C.A. Pohl, J. Liq. Chromatogr. 6, 1577–1590 (1983).
(10) R.W. Andrews and R.M. King, Anal. Chem. 62, 2130 (1990).
(11) W.R. LaCourse and D.C. Johnson, Carbohydr. Res. 215, 159 (1991).
(12) D.C. Johnson and W.R. LaCourse, Electroanalysis 4, 367–380 (1992).
(13) W.R. LaCourse and D.C. Johnson, Anal. Chem. 65, 50–55 (1993).
(14) G.G. Neuburger and D.C. Johnson, Anal. Chem. 59, 150–154 (1987).
(15) G.G. Neuberger and D.C. Johnson, Anal. Chim. Acta 192, 205–13 (1987).
(16) G.G.Neuburger and D.C. Johnson, Anal. Chem. 60, 2288 (1988).
(17) R.D. Rocklin, A.P. Clarke, and M. Weitzhandler, Anal. Chem. 70, 1496 (1998).
(18) J.A. Polta and D.C. Johnson, Anal. Chem. 57, 1373–1376 (1985).
(19) L. Koprowski, E. Kirchmann, and L.E. Welch, Electroanalysis 5, 473–482 (1993).
(20) E. Kirchmann and L.E. Welch, J. Chromatogr. 633, 111–118 (1993).
(21) M.A. Doscotch, J.A. Jones, and L.E. Welch, Anal. Chim. Acta 344, 55–64 (1997).
(22) M.P. Olson, L.R. Keating, and W.R. LaCourse, Anal. Chim. Acta 652, 198–204 (2009).
(23) D. Gilroy, J. Electroanal. Chem. 71, 257 (1976).
(24) D. Gilroy, J. Electroanal. Chem. 83, 329 (1977).
(25) T.Z. Polta and D.C. Johnson, J. Electroanal. Chem. 209, 159–69 (1986).
(26) D.G. Williams and D.C. Johnson, Anal. Chem. 64, 1785 (1992).
(27) S. Altunata, R.L. Earley, D.M. Mossman, and L.E. Welch, Talanta 42, 17–25 (1995).
(28) R. Roberts and D.C. Johnson, Electroanalysis 4, 741–749 (1992).
(29) G.G.Neuburger and D.C. Johnson, Anal. Chem. 60, 2288 (1988).
(30) L.E. Welch, W.R. LaCourse, D.A. Mead, Jr., D.C. Johnson, and T. Hu, Anal. Chem. 61, 555 (1989).
(31) A.P. Clarke, P. Jandik, R.D. Rocklin, Y. Liu, and N. Avdalovic, Anal. Chem. 71, 2774–2781 (1999).
(32) W.R. LaCourse, Analusis 21, 181 (1993).
(33) L.E. Welch, W.R. LaCourse, D.A. Mead Jr., and D.C. Johnson, Talanta 37(4), 377 (1990).
(34) W.R. LaCourse and G.S. Owens, Anal. Chim. Acta 307, 301–319 (1995).
(35) C.O. Dasenbrock and W.R. LaCourse, CHEMTECH January, 26 (1998).
(36) W.R. LaCourse and C.O. Dasenbrock, J. Pharm. and Biomed. Anal. 19, 239 (1998).
(37) C.O. Dasenbrock and W.R. LaCourse, Anal. Chem. 70, 2415 (1998).
(38) W.R. LaCourse and C.O. Dasenbrock, "High Performance Liquid Chromatography-Pulsed Electrochemical Detection for the Analysis of Antibiotics," in Advances in Chromatography, P.R. Brown and E. Gruska, Eds. (Marcel Dekker, New York, New York, 1997).
(39) W.R. LaCourse and D.C. Johnson, Anal. Chem. 65, 50–55 (1993).
(40) R.T. Kennedy and J.W. Jorgenson, Anal. Chem. 61, 436 (1989).
(41) P. Jandik, P.R. Haddad, and P.E. Sturrock, CRC Crit. Rev. Anal. Chem. 20, 1–74 (1988).
(42) P.R. Haddad and P. Jandik in Ion Chromatography, J.G. Tarter, Ed. (Marcel Dekker: New York, New York, 1987).
(43) Application Note 179. Dionex Corp, Sunnyvale, CA.
(44) W.R. LaCourse and Swati J. Modi, Electroanalysis 17(13), 1141–1152 (2005).
William R. LaCourse is Chair and Professor of Analytical Chemistry in the Department of Chemistry and Biochemistry at the University of Maryland, Baltimore County in Maryland. He is also a Kauffman Fellow of Entrepreneurship.

William R. LaCourse
Michael Swartz "Innovations in HPLC" Editor Michael E. Swartz, Ph.D., is Principal Scientist in Analytical Development at Ariad Pharmaceuticals, Cambridge, Massachusetts, and a member of LCGC's editorial advisory board. Direct correspondence about this column to "Innovations in HPLC," at lcgcedit@lcgcmag.com

Michael Swartz

Thermodynamic Insights into Organic Solvent Extraction for Chemical Analysis of Medical Devices
April 16th 2025A new study, published by a researcher from Chemical Characterization Solutions in Minnesota, explored a new approach for sample preparation for the chemical characterization of medical devices.
Sorbonne Researchers Develop Miniaturized GC Detector for VOC Analysis
April 16th 2025A team of scientists from the Paris university developed and optimized MAVERIC, a miniaturized and autonomous gas chromatography (GC) system coupled to a nano-gravimetric detector (NGD) based on a NEMS (nano-electromechanical-system) resonator.
Miniaturized GC–MS Method for BVOC Analysis of Spanish Trees
April 16th 2025University of Valladolid scientists used a miniaturized method for analyzing biogenic volatile organic compounds (BVOCs) emitted by tree species, using headspace solid-phase microextraction coupled with gas chromatography and quadrupole time-of-flight mass spectrometry (HS-SPME-GC–QTOF-MS) has been developed.
A Guide to (U)HPLC Column Selection for Protein Analysis
April 16th 2025Analytical scientists are faced with the task of finding the right column from an almost unmanageable range of products. This paper focuses on columns that enable protein analysis under native conditions through size exclusion, hydrophobic interaction, and ion exchange chromatography. It will highlight the different column characteristics—pore size, particle size, base matrices, column dimensions, ligands—and which questions will help decide which columns to use.


