A Sensitive, Specific, Accurate, and Fast LC–MS-MS Method for Measurement of 42 Ethyl Glucuronide and Ethyl Sulfate in Human Urine
A method is illustrated for the simultaneous analysis of ethyl glucuronide and ethyl sulfate in human urine samples.
A method is illustrated for the simultaneous analysis of ethyl glucuronide (EtG) and ethyl sulfate (EtS) in human urine samples. The method described uses a simple dilution of the urine sample followed by fast (<7-min) liquid chromatography–tandem mass spectrometry (LC–MS-MS) analysis with detection below 25 ng/mL. When tested with a large number of patient samples, the method was found to be rugged, reproducible, and free of interference by matrix contaminants.
Monitoring illicit drug use through laboratory testing has become a cornerstone in reducing substance abuse and focusing efforts on those stricken with addiction issues. Although many methods have been developed for detecting commonly abused drugs, monitoring individuals for alcohol consumption is hampered by the rapid metabolism of alcohol which makes abuse undetectable. Until recently this rapid metabolism has limited alcohol testing to a few hours after drinking stops. New developments have made it possible to detect alcohol abuse in the 3–5 days preceding the test by identifying the presence of alcohol metabolites. This detetection is especially important in monitoring alcohol use in settings in which alcohol use is prohibited: alcoholism and drug abuse treatment, professional assistance programs, abstinence as a condition of probation, child custody issues, or for people under the legal drinking age (1).
Beverage alcohol, also known as ethanol, is metabolized by the body through several pathways. One pathway metabolizes ethyl alcohol to ethyl glucuronide (EtG), and another to ethyl sulfate (EtS). Normally when alcohol is metabolized in the body, most is eliminated by enzymes that are part of the glycolysis pathway that converts sugar to cellular energy. An enzyme associated with the pathway, alcohol dehydrogenase, "takes away" electrons (oxidation) from the alcohol molecules, which results in final products of water and carbon dioxide and gives no information regarding alcohol consumption. EtG and EtS, however, are formed by "nonoxidative" pathways that, instead of breaking down the alcohol molecules, make them more complex by combining them with larger molecules, which makes it nontoxic. These nonoxidative metabolites, in the case of alcohol, EtG, and EtS, are then slowly eliminated in the urine, making them excellent markers for recent alcohol consumption (1).
The presence of EtG or EtS in urine is indicative that alcohol was consumed within the previous 3–4 days. Thus, EtG and EtS levels are a more accurate indicator of alcohol consumption over the course of several days, which makes the approach more amenable to long-term monitoring versus direct blood alcohol measurements. The detection of the combination of EtG and EtS in parallel offers greater sensitivity and accuracy for determination of recent ethanol ingestion than by detection of either biomarker alone. Finally, the identification of both EtG and EtS in a patient sample ensures that ethanol was ingested and was not produced as a result of in-vivo or in-vitro fermentation of urine.
Methods to detect EtG and EtS include immunoassay, gas chromatography–mass spectrometry (GC–MS) and liquid chromatography–mass spectrometry (LC–MS). Immunoassays have limited specificity and sensitivity with a limit of detection of approximately 1000 ng/mL. GC–MS offers more specificity than immunoassays with detection limits of approximately 500 ng/mL. LC–MS methods have improved specificity and detection limits to less than
100 ng/mL.
For alcohol, EtG and EtS cutoffs have become controversial because of the large number of widely used antimicrobial products (that is, gel hand cleaners) that contain alcohol. As a result, most regulatory entities have set cutoffs for EtG between 100 ng/mL and 1000 ng/mL and for EtS between 25 ng/mL and 100 ng/mL for reporting of an adverse finding. Our goal was to develop a specific and sensitive LC–MS-MS method for detecting EtG and EtS that fulfills these detection cutoffs.
Materials and Methods
All reagents and solvents were high performance liquid chromatography (HPLC) grade or analytical grade. HPLC-grade methanol and acetonitrile were purchased from Honeywell, Burdick & Jackson (Muskegon, Michigan). Purified water (Milli-Q, EMD Millipore, Billerica, Massachusetts) was used for reagent, sample, and mobile phase preparation. Ethyl -D-glucuronide (EtG) and ethyl -D-glucuronide-d5 (EtG-d5) were purchased from Cerilliant (Round Rock, Texas). Ethyl sulfate and ethyl sulfate-d5 (EtS-d5), were purchased from Athena Environmental Sciences, Inc. (Baltimore, Maryland). Ammonium formate (reagent grade, 97%) was purchased from Sigma-Aldrich (St. Louis, Missouri). Certified drug negative normal human urine was purchased from UTAK Laboratories, Inc. (Valencia, California).
The individual deuterated internal standard (IS) working solutions (100 µg/mL for EtG-d5 and 50 µg/mL for EtS-d5) were prepared in methanol and stored at 4 °C until use. A 5-µL aliquot of each internal standard was added to a 0.5-mL final diluted human urine specimen, yielding final urine IS concentrations of 1000 ng/mL for EtG-d5 and 500 ng/mL for EtS-d5. For calibrators, a stock solution of 1 mg/mL of each analyte was prepared in acetonitrile and stored at 4 °C until use. A working solution of 100 µg/mL was prepared by dilution with methanol. A calibration curve (25, 50, 100, 250, 500, 1000, and 2000 ng/mL) was generated by spiking different aliquots of the working stock solution into a blank drug negative normal human urine specimen.
Three quality control (QC) samples were prepared in triplicate with a different lot of working standard solution to yield QC concentrations of 80, 400, and 800 ng/mL in blank drug negative normal human urine specimens, respectively. The samples were prepared for analysis using "dilute and shoot" methodology.

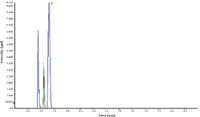
Figure 1: EtG and EtS analysis (standard spiked in 1:10 diluted human urine; standard concentrations = 2000 ng/mL). Peaks: 1 = EtG, 2 = EtS.
LC–MS analysis was performed on an Agilent 1200 Series HPLC system (Agilent Technologies, Santa Clara, California) interfaced with an API 4000 MS system with electrospray ionization (ESI) (AB Sciex, Foster City, California) operated in multiple reaction monitoring (MRM) negative ionization mode (ESI–). The HPLC column used for all analyses was a 100 mm × 2.0 mm Synergi 2.5-µm Hydro-RP (Phenomenex, Torrance, California). Mobile phase A was 10 mM ammonium acetate, pH 7.6, in water and mobile phase B was a 50:50 mixture of methanol and acetonitrile. The flow rate was 0.5 mL/min. A gradient method was used from 0 to 80% B in 4 min followed by a 3-min equilibration. Urine samples were diluted 10-fold with mobile phase A before injection, and the sample injection volume was 10 µL. The HPLC column was maintained at 25 °C. For MS detection various parent–daughter transitions were evaluated (for EtG 221.2: 75.0 [EtG-1] or 221.2:85.1 [EtG-2] and for EtS 124.9:80.1 [EtS-1] or 124.9:97.0 [EtS-2]) to obtain the best sensitivity free of matrix interference.
Results and Discussion
The use of a small-particle polar functional HPLC phase allowed for a fast elution of EtG and EtS at less than 2 min (Figure 1) using a near-neutral mobile phase. In ESI negative mode, EtG and EtS were detected by monitoring the mass transitions and their deuterium-labeled internal standards. Quantitative and qualitative data were generated for both transitions of EtG (EtG-1 and EtG-2) and EtS (EtS-1 and EtS-2). Based on the instrumentation used and samples analyzed, one can determine the transition that works best for specific application requirements.

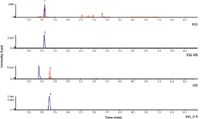
Figure 2: Extracted ion chromatograms for EtG, EtS, and their internal standards (EtG-d5 and EtS-d5) at a 100-ng/mL concentration in 1:10 diluted human urine.
The optimized HPLC method utilized a 7-min separation that included a gradient from a 100% aqueous solution to 80% organic in 4 min (Figure 2) followed by a 100% aqueous equilibration. The retention times of EtG and EtS are 1.10 and 1.30 min, respectively. Although the total run time is 7 min, the method's 2-min data window allows for multiplexing of HPLC runs to increase sample throughput and reduce MS idle time. This can be advantageous in a clinical setting where large numbers of samples need to be analyzed.

Figure 3: Patient urine profiles: (a) Patient 2 (EtG and EtS concentrations are at relatively low levels); (b) Patient 3 (EtG and EtS concentrations are at relatively medium levels); (c) Patient 6 (EtG and EtS concentrations are at very high levels).
The highly polar nature of EtG and EtS made typical LC methods difficult to achieve adequate retention using traditional C18 or phenyl phase columns. In addition, these polar analytes require loading conditions utilizing close to 100% aqueous mobile phase to achieve adequate retention and separation from matrix contaminants. High aqueous mobile phase reduces MS sensitivity and raises concerns of "phase collapse" phenomena that could compromise method reproducibility. The polar endcapped C18 column used for this method provides improved polar selectivity for adequate retention of EtG and EtS and yields clear separations away from matrix contaminants. EtG is clearly separated from a potential isobaric matrix component. The method is very rugged and demonstrates adequate selectivity even for concentrated standards (Figure 1) and high-level patient samples (Figure 3c). Standard calibration curves were generated over the concentration range of 25–2000 ng/mL by plotting the relative response (peak area of EtG and EtS divided by the peak area of internal standards) versus concentration. A linear fit with weighting factor of 1/x was used to counter the undue influence of high concentrations of EtG and EtS in the high calibrators. The standard calibration curves were linear over the calibration ranges with R2 values of 0.9989 for EtG-1 (Figure 4a), 0.9978 for EtG-2 (Figure 4b), 0.9969 for EtS-1 (Figure 4c), and 0.9959 for EtS-2 (Figure 4d).

Figure 4: Standard curves from 25 ng/mL to 1000 ng/mL for EtG and EtS in human urine: (a) EtG-1, (b) EtG-2, (c) EtS-1, and (d) EtS-2.
Sensitivity of the method was evaluated by determining the lowest level concentration with a signal-to-noise ratio of at least 10:1 for limit of quantification (LOD). At the lowest level standard concentration (25 ng/mL) the signal-to-noise ratios were 47.5 for EtG-1, 48.5 for EtG-2, 88.2 for EtS-1, and 205.3 for EtS-2 (Figure 5 and Table I). Thus, the LOQ values were estimated to be <25.0 ng/mL for EtG and EtS (Table I) which is well below the requirements for this assay. QC samples were prepared at levels of 80, 400, and 800 ng/mL. These concentrations were selected to represent low, medium, and high concentration across the calibration range for each analyte. The QC samples were diluted in the same way as the actual sample described above and analyzed in triplicate to assess reproducibility. The mean expected recovery of the lowest-level QC samples (80 ng/mL) were 118% for EtG-1, 103% for EtG-2, 113% for EtS-1, and 112% for EtS-2 (Table I). The percentage coefficients of variation (%CV) for the intra-assay precision ranged from 1.83% to 9.97% for levels of 80 ng/mL, 4.58 to 7.20% for levels of 400 ng/mL, and 0.98% to 2.33% for levels of 800 ng/mL (Table I). No endogenous signal was found in three normal urine specimens, which demonstrated the selectivity of the method. There was no carryover observed when blank urine samples were injected after the highest calibrator (2000 ng/mL). This optimized LC–MS procedure allows for the best recovery of the urinary EtG and EtS, and demonstrates good potential for high-throughput sample preparation and automation.

Figure 5: Extracted ion chromatograms: (a) EtG-1, (b) EtG-2, (c) EtS-1, and (d) EtS-2.
Conclusion
A rapid analysis of urinary EtG and EtS was developed that is rugged and accurate and can be easily automated and multiplexed for a high-throughput environment. The use of a polar endcapped C18 phase for this separation provided a shorter chromatographic analysis time and still separated both the EtS and EtG analytes away from matrix contaminants, which is of great importance for such "dilute-and-shoot" methods. In addition, by employing multiple parent–daughter ion transitions, the method provides additional flexibility based on the samples being analyzed and instruments being employed in the method.

Table I: Statistical data for EtG and EtS in urine obtained by LCâMS
Shuguang Li, Jeff Layne, Sky Countryman, and Michael McGinley are with Phenomenex Inc., Torrance, California.
Reference
(1) R.L. DuPont, G.E. Skipper, and W.L. White. Employee Assistance Digest 28, 15–21 (2008).

Understanding FDA Recommendations for N-Nitrosamine Impurity Levels
April 17th 2025We spoke with Josh Hoerner, general manager of Purisys, which specializes in a small volume custom synthesis and specialized controlled substance manufacturing, to gain his perspective on FDA’s recommendations for acceptable intake limits for N-nitrosamine impurities.


