Improving the Efficiency of Fatty Acid Methyl Ester Preparation Using Automated Sample Preparation Techniques
LCGC North America
An automated technique for esterifying fatty acids in canola oil compares favorably with a manual method.
An automated method for esterifying fatty acids in canola oil samples is presented in this article. Using an automated sample preparation instrument, a side-by-side comparison was undertaken comparing a method for the automated system adapted from a previously published method to an analogous method performed manually. Using the automated system, preparation of 10 fatty acid standards resulted in an average relative standard deviation (RSD) of 1.2% for an automated, acid-catalyzed reaction. This was compared to 10 standards prepared in the same way manually using pipettors, which resulted in an average RSD of 2.7%. Furthermore, by adapting the published method for use on the automated system the total volume of reagents used was decreased by 50-fold. The automated system also provided a simple, straightforward process for method development that resulted in a shorter reaction time. Overall, the automated method resulted in better precision and accuracy with smaller amounts of reagents used and less time required from the operator to complete the task.
The analysis of fatty acids is commonly performed in many industries, ranging from food to biomedical to chemical (1–5). With the increased awareness of fat as part of dietary health and its role in maintaining a healthy disposition, the determination of fatty acid composition has become increasingly common (1,2). Biomedical applications use fatty acid profiles as a diagnostic tool because fatty acid composition affects biological membranes (3,4,6,7). Fatty acids are also found in many household products and are used industrially in cosmetics and surfactants, among other things (2,8).
Gas chromatography (GC) has been the primary method used for analyzing fatty acids since the 1950s (3,4,9). While fatty acids can be separated and analyzed with the appropriate technique and analytical conditions, they present a number of challenges due to their polar nature and high boiling points. These characteristics generally result in long retention times and poor peak shape. For that reason, most methods use esterification reactions to convert fatty acids to fatty acid methyl esters (FAMEs), which are easier to separate and exhibit better peak shape.
Converting fatty acids to FAMEs, regardless of the matrix or application, can be achieved in a number of ways, and often involves a two-step process of saponification followed by methylation (1–5,10). This process can be incredibly time-consuming and resource intensive.
Automating these methods can be advantageous in many ways, and recently there have been more automated or microscale methods for converting fatty acids to FAMEs (10–14). Generally, automated methods use smaller volumes of reagents, reduce an operator's potential exposure to hazardous chemicals, and can reduce the time required to complete the task while providing intervention-free running for hours. Using an automated sample preparation instrument, two methods of extracting and methylating fatty acids in canola oil were examined: a base-catalyzed and an acid-catalyzed reaction. Both methods were adapted from a previously published manual method using 20-mL test tubes (5).
The automated method yielded recoveries between 94% and 101% with RSDs <5% which is comparable to most manual methods. Also, by modifying the manual methods for use in an automated system, the reaction time was reduced from 2 h to 20 min with a 50-fold decrease in reagent and solvent usage.
Experimental
Instrumentation
An automated sample preparation workstation (Agilent Technologies, Santa Clara, California) was used to prepare calibration curve standards and for sample preparation of fatty acid standards and canola oil samples. It was configured with a 25-μL syringe and a 500-μL syringe that allowed for finer control of the volumes dispensed. Analyses were performed with a gas chromatograph (Agilent Technologies) equipped with an automatic liquid sampler, a split–splitless inlet, and a flame ionization detector. The average of triplicate injections (nominally 1% RSD) was used to determine recovery and repeatability between samples.
Calibration Curve Generation
Before preparing samples, a calibration curve was generated from a FAME standard containing methyl pentanoate, methyl hexanoate, methyl heptanoate, methyl octanoate, methyl decanoate, methyl laurate, methyl myristate, methyl palmitate, methyl stearate, methyl eicosanoate, and methyl behenate at 1 mg/mL. Eight calibration standards were prepared via linear dilution using the automated system. The standards were made in approximately 100 μL of hexane, each twofold more diluted than the previous, and spanned 1–500 ppm.
Sample Preparation — Acid-Catalyzed Reaction
To an empty, capped 2-mL autosampler vial, 10 μL of sample and 10 μL of the internal standard (1 mg/mL decane, dodecane, tetradecane, and hexadecane) were added. The sample was either a free fatty acid standard consisting of caprylic acid, capric acid, lauric acid, myristic acid, palmitic acid, stearic acid, arachidic acid, and behenic acid at 1 mg/mL in hexane or a solution made of 0.4 mL of canola oil and 0.4 mL of a surrogate standard (1 mg/mL lauric acid). To that solution, 40 μL of 2 N sodium hydroxide in methanol was added and the mixture was vortexed using the onboard mixer at 1000 rpm for 30 s. The methylating reagent was added next, 80 μL of 14% boron trifluoride in methanol, after which the solution was vortexed again at 1000 rpm for 30 s. The solution was then heated with the onboard single vial heater for 20 min at 65 °C. After heating, the solution was allowed to sit at room temperature for 2 min to cool slightly. To the cooled mixture, 100 μL of 2 M sodium chloride in water and 100 μL of hexane were added to extract the newly formed FAMEs into the organic layer. The solution was mixed a final time for 20 s at 1000 rpm and the top layer (100 μL) was transferred to a new, empty, capped 2-mL autosampler vial and taken to the gas chromatograph for analysis.
Sample Preparation — Base-Catalyzed Reaction
Because base catalyzed reactions do not convert free fatty acids (16), the surrogate standard, a free fatty acid, was omitted and the method was only performed on an oil sample solution. The solution consisted of 0.4 mL of canola oil and 0.4 mL of the internal standard. To an empty, capped 2-mL autosampler vial 10 μL of sample (oil–internal standard solution) was added. To that, 500 μL of hexane and 100 μL of 2 N sodium hydroxide in methanol was added (to ensure an excess of sodium hydroxide) and the mixture was vortexed at 1000 rpm for 30 s. After waiting 2 min, the top layer (100 μL) was transferred to a new, empty, capped 2-mL autosampler vial and taken to the gas chromatograph for analysis. Unlike the acid-catalyzed reaction, this base-catalyzed reaction occurs in a single step and is complete within minutes.
Validation of the Acid-Catalyzed Reaction
Because the acid-catalyzed reaction works as well on lipid-bound fatty acids as it does on free fatty acids, the automated method was performed on the fatty acid standard in hexane. Five samples were prepared on three different days to determine repeatability between samples as well as day-to-day reproducibility.
The same procedure was followed when performing the reaction manually with the fatty acid standard. The volumes were added using adjustable pipettors and the reaction took place in a heated block for comparison. The manual procedure was performed alongside the automated procedure to give an accurate comparison between the manual and automated preparations.
Results and Discussion
Calibration
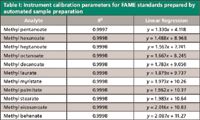
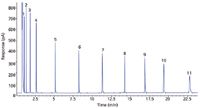
For the eight standards made with the automated system, excellent linearity was achieved. The calibration data are given in Table I. Because the standards were made with a selection of saturated FAME compounds, those were the only compounds that were identified and quantified in the oil and fatty acid standard samples (Figure 1).

Table I: Instrument calibration parameters for FAME standards prepared by automated sample preparation
Method Validation
Before oil samples were analyzed, the fatty acid standard was prepared with the automated method and manual method to validate the use of the automated instrument. The peak areas were normalized to lauric acid, the surrogate standard, which provided results indifferent to the dilution accuracy. Using normalized peak areas, relative standard deviation and recovery for the samples prepared both manually and with the automated method across the three days are presented in Table II. The recovery of methyl octanoate with automated sample preparation was lower due to its higher volatility (3,4). The vial caps are pierced during sample preparation on the instrument, which results in lower recovery of the more volatile compounds like methyl octanoate (3,4). This effect is not observed to the same extent in the manual method because the caps remain unpierced throughout the entire sample preparation step. By normalizing to methyl laurate, the effects of the final dilution on recovery are minimized, resulting in similar recoveries for both the manual and automated methods. However, the RSDs are higher for the manually prepared samples because of larger variances in dispensing the sample and the final diluent. The automated sample preparation resulted in an average RSD of 1.2%, and the manual method yielded an average RSD of 2.7%. The comparable recoveries and twofold better RSDs for the automated method demonstrate that the automated sample preparation instrument provided a viable solution for derivatizing fatty acids.

Figure 1: An example chromatogram of a standard containing the 11 calibrated compounds made with the automated sample preparation instrument. Peaks: 1 = methyl pentanoate, 2 = methyl hexanoate, 3 = methyl heptanoate, 4 = methyl octanoate, 5 = methyl decanoate, 6 = methyl laurate, 7 = methyl myristate, 8 = methyl palmitate, 9 = methyl stearate, 10 = methyl eicosanoate, 11 = methyl behenate.
Canola Oil Analysis
After validating the automated method using the fatty acid standard, the automated instrument was used to prepare oil samples. The original manual method followed the Association of Official Analytical Chemists Official Methods of Analysis and started with a 50-mg sample of canola oil in 20-mL test tubes and included two heating steps at 80 °C for 60 min each (5,15).

Table II: Results from the fatty acid standard prepared both manually and with the automated acid-catalyzed reaction using methyl laurate as the internal standard
When converting the method to an automated method, the scale of the reaction was necessarily reduced because the automated instrument accepts only 2-mL autosampler vials. The manual method was reduced approximately 50-fold.
Initially the oil, surrogate standard, and internal standard were added in separate steps. However, because of difficulty in achieving acceptable reproducibility in dispensing the oil, a solution consisting of 0.4 mL of the oil sample and 0.4 mL of the surrogate or internal standard was made. This greatly improved the reproducibility of the method. The higher viscosity of canola oil makes dispensing it accurately and reproducibly difficult. However, by diluting it in the surrogate standard or internal standard the viscosity of the new solution is closer to that of hexane, which can be dispensed with higher accuracy and precision.
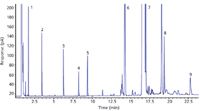
During a period of two days, 11 samples were prepared. Because a new solution was made each day, an average RSD for all 11 samples is not available. The average RSD for the six samples prepared on day one was 3.6%. The average RSD for the five samples prepared on day two was slightly lower at 2.5%. The results given in Table III are for the six samples prepared on day one with a representative chromatogram presented in Figure 2. The amount, standard deviation, and recovery were determined from the peak areas using an external standard, for example the aforementioned calibration curve. The RSD, however, is shown for both an external and internal standard (normalized to lauric acid). The external standard provides sample-to-sample repeatability and takes into account the dispensing accuracy and precision. The internal standard reduces weight of the errors incurred during the final dilution and highlights the differences in the reaction.

Table III: Results using both an external standard (ES) and internal standard (IS) from the canola oil sample prepared with the automated instrument and the acid-catalyzed reaction
As with the acid-catalyzed reaction, the manual preparation for the base-catalyzed reaction was too large to be prepared in a 2-mL autosampler vial because it started with a 100-mg oil sample in a 20-mL test tube (5). For this reaction to work with the automated instrument, it was reduced approximately 10-fold.

Figure 2: A typical chromatogram of a canola oil sample after automated acid catalyzed sample preparation and analysis by GC. Peaks: 1 = decane, 2 = dodecane, 3 = tetradecane, 4 = methyl laurate, 5 = hexadecane, 6 = methyl palmitate, 7 = methyl stearate, 8 = methyl eicosanoate, 9 = methyl behenate. Other unidentified, uncalibrated peaks are various unsaturated FAMEs.
The automated base-catalyzed reaction provided excellent results as well. A total of ten samples were prepared in one day and yielded similar reproducibility (Table IV). The average RSD across the four FAMEs for the 10 samples was 3.2%. Using the internal standard to normalize the peak areas did not sufficiently lower the RSDs as it did with the acid catalyzed reaction. This is likely because the final dilution of 500 μL for the base-catalyzed reaction is larger than that of the acid-catalyzed reaction, 100 μL. Therefore, small differences in the dispensing precision or accuracy are not as noticeable.

Table IV: Results using both an external standard (ES) and an internal standard (IS) from a canola oil sample prepared with the automated instrument and the base-catalyzed reaction
Precision and Accuracy of Dispensed Volumes
To provide a measure of the accuracy and precision of the automated system independent of the chromatography, reagent volumes were dispensed into tared, capped vials. A total of 10 samples were dispensed and weighed to determine the gravimetric precision. Overall, the dispensing capabilities of the automated system yielded excellent results. Using a 500-μL syringe, dispensing 40 μL of 2 N sodium hydroxide in methanol yielded an RSD of 0.3%. Dispensing 80 μL of 14% boron trifluoride in methanol gave an RSD of 0.3% as well. Dispensing 100 μL of either 2 N sodium hydroxide in methanol, 2 M sodium chloride in water, or hexane gave an RSD of 0.5%. Lastly, dispensing 500 μL of hexane with the 500 μL yielded an RSD of 0.3%. Using a 25-μL syringe to dispense 10 μL gave an RSD of 0.8%. Density was used to convert the measured masses to volumes for accuracy determination. The volumes dispensed with the 500-μL syringe were found to be accurate within 1%, with the exception of dispensing 40 μL of 2 N sodium hydroxide in methanol, which was accurate within 2%. Using the 25 μL syringe to dispense 10 μL of sample was found to be accurate within 10%. This is artificially high because of the limitations of the balance used; for example, only one significant figure could be measured for 10 μL dispensed.
From other unpublished studies, it has been observed that dispensing smaller volumes with the large-volume syringe (for example, 5 μL with a 500-μL syringe) gives much poorer performance. By operating within the limits of the syringe, excellent results can be achieved.
Benefits of Automated Sample Preparation
Automating this sample preparation procedure proves to be advantageous in many ways. Greater variability was observed in the manual method, resulting from multiple steps. Dispensing volumes with automatic pipettes is partially dependent on operator skill. By removing the human element from this step, greater reproducibility was achieved in dispensing reagent volumes across multiple samples, resulting in better results overall. Mixing in the manual method was done by hand and again had greater variability in comparison to the automated preparation in which the mixing operation is timed and the speed is well controlled. Finally, heating on the automated system is controlled to a better extent (±1 °C) in comparison to the manual method. The manual method used a heated block that lacked the fine control (±5 °C) of the heater on the automated system. By decreasing the variability of the method, errors are more easily tracked with the automated system, which also enables additional method development and optimization.
Translating the manual method to the automated system allowed for easier method development, resulting in a shorter reaction time. Reagent usage and reaction times could be easily modified on the automated system without much operator input. Because the automated system required no operator intervention after programming, multiple sample preparation methods could be loaded and run during the day, and the finished samples were analyzed overnight. This efficiency enabled the method to be optimized within one day with little to no operator intervention. The same procedure performed manually would have been more time-consuming and may not have achieved the same result due to the aforementioned variability in the heated block.
By adapting the originally published method to an automated one, the scale of the reaction was reduced. Were it not for the volume limitations of the automated system, the original manual method may not have been revisited. However, in reducing the scale of the reaction, good results were achieved with both the manual and automated methods, and the level of chemical exposure was reduced as well as the amounts of solvent and reagent used. These reductions increase the safety of the method and reduces the cost of the analysis.
Most importantly, the automated method resulted in higher quality results. The recoveries were comparable for the manual and automated methods, but the reproducibility of samples prepared improved. The automated method resulted in reproducibility twice as good as the manual method when comparing the normalized results. By improving the quality of the data, fewer errors were made and less rework was needed for the samples. These improved data, in combination with the optimized method, result in substantial time savings as well.
Conclusions
Two automated methods for derivatizing fatty acids were described here. The results obtained with the automated approach were as good or better than the manual method but required less operator intervention and featured a reduction in solvent and reagent usage.
Using an automated sample preparation instrument, manual esterification reactions were easily converted to automated methods with an observed increase in reproducibility; the RSD of the method was reduced on average from 2.7% for the manual method to 1.2% with the automated system. Furthermore, smaller volumes of solvents and reagents, up to 50-fold less, were used in the automated method, thus significantly reducing the cost per analysis. Excellent reproducibility and recovery was achieved for most compounds in both a fatty acid standard and a canola oil sample. Esterification of a fatty acid standard with the automated method gave an average RSD of 1.0% and recovery of 103% for methyl decanoate and higher. The acid catalyzed automated preparation yielded an average RSD of 1.3% and recovery of 101% for the internal and surrogate standards. The base-catalyzed preparation gave an average RSD of 3.1% and recovery of the internal standards of 94%. These results show that methods such as these can easily be adapted for use on an automated sample prep instrument with many advantages.
References
(1) M. Petrovic, N. Kezic, and V. Bolanca, Food Chemistry 122, 285–291(2010).
(2) K.M. Giffin and W.H. Wilson, "Preparation and Analysis of FAMEs by Automated Esterification/Capillary GC," Application Note 288-357, Hewlett-Packard No. (23) 5965–1110E (1996).
(3) K. Eder, J. Chromatogr., B 671, 113–131 (1995).
(4) G. Gutnikov, J. Chromatogr., B 671, 71–89 (1995).
(5) F. David, P. Sandra, and P. Wylie, "Improving the Analysis of Fatty Acid Methyl Esters Using Retention Time Locked Method and Retention Time Databases," Application Note 5990-4822EN, Agilent Technologies No. 5988–5871EN (2003).
(6) W. Welz, W. Sattler, H.-J. Leis, and E. Malle, J. Chromatogr., B 526, 319–329 (1990).
(7) N. Sanchez-Avila, J.M. Mata-Granados, J. Ruiz-Jimenez, and M.D. Luque de Castro, J. Chromatogr., A 1216, 6864–6874 (2009).
(8) R.W. Johnson in Fatty Acids, E. Pryde, Ed. (AOCS Press, Champaign, Illinois, 1979), p. 608 and Part VIII.
(9) T. Seppanen-Laakso, I. Laakso, and R. Hiltunen, Anal. Chim. Acta 465, 39–62 (2002).
(10) L. Mondello, P. Quinto Tranchida, P. Dugo, and G. Dugo, J. Pharm. Biomed. Anal. 41, 1566–1570 (2006).
(11) R. Perkins, K. Summerhill, and J. Angove, Chromatography Today, Sept/Oct, 17–19 (2008).
(12) M. Athar Masood and N. Salem Jr., Lipids 43, 171–180 (2008).
(13) E. Ballesteros, M. Gallego, and M. Valcarcel, Anal. Chim. Acta 282, 581–588 (1993).
(14) P.W. Park and R.E. Goins, J. Food Sci. 59, 1262–1266 (1994).
(15) AOAC Official Methods of Analysis (1990), method 969.33.
(16) W.W. Christie in Advances in Lipid Methodology – Two, W.W. Christie, Ed. (Oily Press, Dundee, Michigan, 1993), pp. 69–111.
Rebecca A Veeneman is an R&D chemist at Agilent Technologies in Wilmington, Delaware.

Extracting Estrogenic Hormones Using Rotating Disk and Modified Clays
April 14th 2025University of Caldas and University of Chile researchers extracted estrogenic hormones from wastewater samples using rotating disk sorption extraction. After extraction, the concentrated analytes were measured using liquid chromatography coupled with photodiode array detection (HPLC-PDA).
Polysorbate Quantification and Degradation Analysis via LC and Charged Aerosol Detection
April 9th 2025Scientists from ThermoFisher Scientific published a review article in the Journal of Chromatography A that provided an overview of HPLC analysis using charged aerosol detection can help with polysorbate quantification.
Removing Double-Stranded RNA Impurities Using Chromatography
April 8th 2025Researchers from Agency for Science, Technology and Research in Singapore recently published a review article exploring how chromatography can be used to remove double-stranded RNA impurities during mRNA therapeutics production.


