New Perspectives on Comparative Analysis for Comprehensive Two-Dimensional Gas Chromatography
Because of the growing number of analysis scenarios involving complex samples, comprehensive two-dimensional gas chromatography coupled with time-of-flight mass spectrometry (GC×GC–TOF-MS) is now a prominent technique for characterization. However, the limitations on time, expenses, and sample quantities, as well as the need for specialized expertise in comparative analysis, can prevent the discovery of analytes that distinguish multiple samples. This article provides an overview of the development and current status of comparative analysis for GC×GC–TOF-MS data and how key limitations can be overcome with a novel tile-based pairwise analysis method.
Gas chromatography (GC) is routinely used in a variety of fields such as forensics, metabolomics, environmental science, petroleomics, and food analysis to resolve the volatile profile of these complex samples. In any of these fields, GC can be used in targeted studies to quantify pre-selected, known analytes or in nontargeted studies to provide a fingerprint (a chemical signature) of the entire sample (1). The main difference between these two types of studies is that in nontargeted studies, analytes of interest are not necessarily known a priori; rather, these analytes are to be “discovered” by the data analysis workflow. In recent years, the use of GC in nontargeted studies for sample characterization and comparison has surged. However, a key requirement for these comparative analysis studies is having a high peak capacity (1), which can be a limitation of one-dimensional GC (1D-GC) (2). Fortunately, the development of comprehensive two-dimensional GC (GC×GC), pioneered by Liu and Phillips in 1991, delivers a 10-fold or greater peak capacity compared to its 1D counterpart (3,4). With GC×GC, a sample is separated on two columns with complementary stationary phases, providing increased selectivity along with enhanced peak capacity. When GC×GC is coupled with time-of-flight mass spectrometry (GC×GC–TOF-MS), this separation technique provides an ideal instrumental platform for comparative analysis.
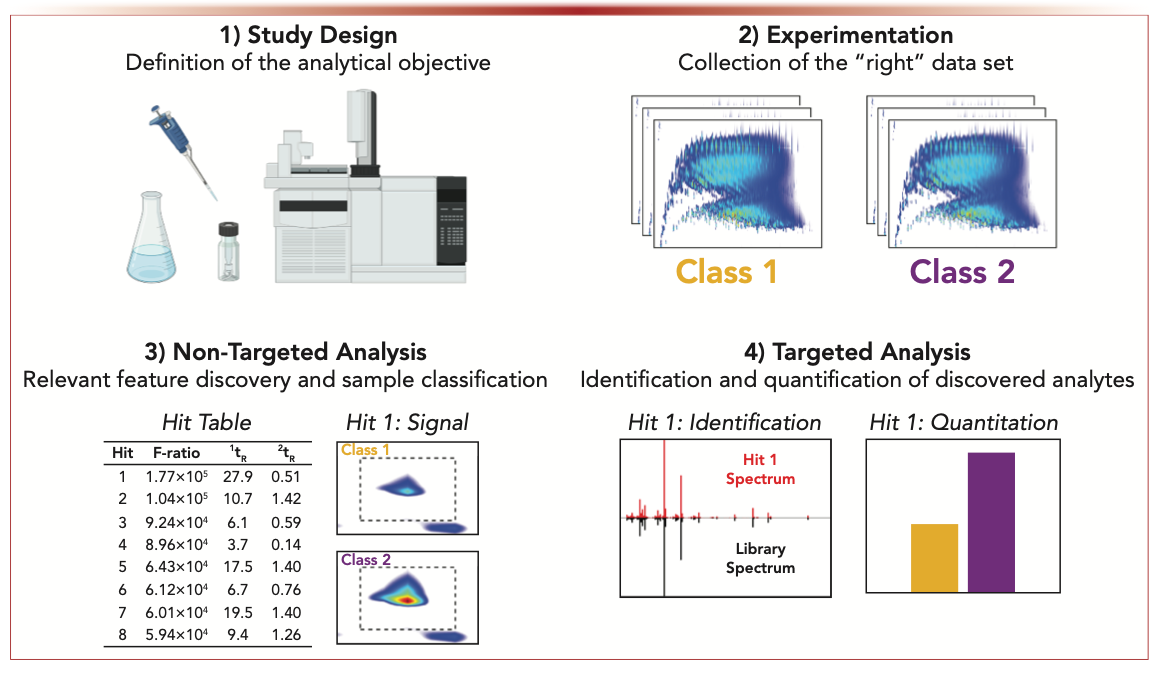
Although GC×GC–TOF-MS does improve the characterization of complex samples, the data can be onerous to interpret, especially considering that one chromatogram can contain up to 1 GB of information. The research questions posed by several application fields are also becoming intricate enough that manual identification and quantitation of every peak in a single chromatogram, let alone for the tens or hundreds of samples in a data set, is impractical. However, chemometrics can perform these identification and quantitation tasks while achieving similar, or better, results with minimal human intervention. Chemometrics refers to the use of advanced statistical analysis or linear algebra, or both, to extract meaningful chemical information from either a single chromatogram or entire data set. Figure 1 demonstrates the typical workflow for comparative analysis of GC×GC–TOF-MS data using chemometrics. The application of chemometrics to chromatographic data first begins with designing an experimental framework to address the given analytical objective. For comparative analysis, the study should be designed to guarantee that the chromatograms collected will reflect the true similarities and differences between the samples (5). After collecting high-quality GC×GC–TOF-MS data, the analyst can proceed to use nontargeted chemometrics to discover differences between the chromatograms (Figure 1). These nontargeted approaches are categorized as either unsupervised or supervised, where the latter leverages user-defined information of sample class membership to detect class- distinguishing analytes. The peaks discovered can then be identified and quantified using targeted chemometric approaches (Figure 1). Continued increases in the use of chemometrics for GC×GC–TOF-MS data analysis make this an exciting time for ongoing developments that bridge the chromatography and chemometrics communities, so it is worth reviewing foundational methods put forth in recent years and how they expand analysis possibilities for the future.
FIGURE 1: General comparative analysis workflow for GC×GC–TOF-MS chromatograms.
Fisher ratio (F-ratio) analysis has emerged as the nontargeted, supervised methodology of choice for comparative analysis studies. This method discovers class-distinguishing analytes that have large between-class variances relative to the pooled within-class variances and ranks them in a hit list for subsequent data analysis steps (6). F-ratio analysis can be applied using either a peak table-based (7,8), pixel-based (6,9), or tile-based approach (10,11). A peak table-based approach quantifies each peak in the chromatogram prior to calculating the F-ratio on those measured signals, whereas a pixel-based approach determines an F-ratio at every data point in each chromatogram. However, neither implementation is ideal because key analytes with a low signal-to-noise (S/N) ratio can be missed using peak tables and false positives from retention time misalignment, and detector fluctuations can arise with a pixel-based approach. Hence, tile-based F-ratio analysis was developed to address these challenges faced with GC×GC–TOF-MS data. The tile-based approach relies on dividing the chromatograms into rectangular sections, or “tiles,” and calculating F-ratios on the summed signal within each tile (10,11). Ultimately, the tile-based methodology mitigates retention time misalignment and provides a S/N enhancement compared to traditional pixel- or peak table-based approaches (10,11). Tile-based F-ratio analysis has been successfully applied to many fields, such as metabolomics (12–14), fuel quality (15), food analysis (16), and environmental analysis (17). Recently, this software has also become commercially available to further progress nontargeted studies (18,19). Hit-list generation for tile-based F-ratio analysis has also been improved to enhance class-distinguishing analyte discoverability by refining the definition and implementation of the F-ratio metric (13,17).
In addition to discovering class-distinguishing analytes with nontargeted approaches, confident conclusions on exactly what is changing—and by how much—between samples requires accurate identification and quantitation via targeted methods. Despite the higher peak capacity afforded by GC×GC–TOF-MS, chromatographic overlap inevitability challenges identification and quantitation efforts. Multivariate curve resolution–alternating least squares (MCR-ALS) and parallel factor analysis (PARAFAC) are commonly applied in these situations to mathematically resolve the analyte of interest from the interfering background. Recently, the capabilities of tile-based F-ratio analysis were expanded into this targeted analysis space with the development of class comparison enabled–mass spectrum purification (CCE-MSP) (20). Based on the class-based experimental design necessary for F-ratio analysis, the underlying principle of CCE-MSP is that the mass spectrum of the target analyte changes between classes while the background spectrum remains constant (20). To obtain the pure target analyte spectrum for a two-sample class comparison study, CCE-MSP first normalizes the spectra from both classes to a pure interferent m/z and then subtracts the two (20). The performance of CCE-MSP was demonstrated to be superior to standard methods like MCR-ALS and PARAFAC, especially under conditions where severe chromatographic overlap arises from large interfering peaks (20).
Even with these robust chemometric techniques, a desire remains for data analysis that can obtain similar—or better—results with fewer constraints on the number of necessary samples. For example, the minimum number of samples required for F-ratio analysis is often given from four to six per sample class (10,11). For many experiments, the capability of collecting this many replicates may not be available because of time, expense, and sample constraints. To address this challenge, a novel tile-based pairwise analysis workflow, referred to as 1v1 analysis, was recently developed (21). The same software platform as with tile-based F-ratio analysis is used with 1v1 analysis; however, instead of generating a hit list using the F-ratio metric, 1v1 analysis uses the sum-normalized difference between two chromatograms as the ranking metric (21). Both analysis methods serve to discover class- distinguishing analytes, but tile-based 1v1 analysis requires just a single chromatogram per “sample class” to achieve comparable performance to tile-based F-ratio analysis. Essentially, 1v1 analysis is an effective way to compare the results of two GC×GC–TOF-MS separations, with far superior results than other methods such as simply subtracting the two chromatograms. This notable performance was shown for two complex data sets: a diesel fuel spiked with non-natives at low concentrations and cacao beans affected by moisture damage (21). Additionally, tile-based 1v1 analysis was demonstrated to be easily coupled to CCE-MSP to obtain pure analyte spectra for identification, outperforming MCR-ALS and PARAFAC under various resolution and degrees of spectrum contamination (21).
With a full complement of nontargeted and targeted approaches at their disposal, researchers may now be able to push comparative analysis from strictly hypothesis-driven approaches to near real-time tracking of chemical changes or processes. In addition, the approaches discussed here likely have yet-unexplored capabilities in separation spaces beyond GC×GC such as 1D-GC or 1D- and 2D-liquid chromatography (LC). These current strategies in comparative analysis for chromatography are transforming the analytical community to dive deeper into their data to uncover hidden information. It will be exciting to see where this field will continue to lead us!
References
(1) V.G. van Mispelaar, H.-G. Janssen, A.C. Tas, and P.J. Schoenmakers, J. Chromatogr. A 1071(1-2), 229–237 (2005). https://doi.org/10.1016/j.chroma.2004.08.135
(2) J.M. Davis and J.C. Giddings, Anal. Chem. 55(3), 418–242 (1983). https://doi.org/10.1021/ac00254a003
(3) Z. Liu and J.B. Phillips, J. Chromatogr. Sci. 29(6), 227–231 (1991). https://doi.org/10.1093/chromsci/29.6.227
(4) M.S. Klee, J. Conchran, M. Merrick, and L.M. Blumberg, J. Chromatogr. A 1383, 151–159 (2015). https://doi.org/10.1016/j.chroma.2015.01.031
(5) P.-H. Stefanuto, A. Smolinska, and J.-F. Focant, TrAC Trends Anal. Chem. 139, 116251 (2021). https://doi.org/10.1016/j.trac.2021.116251
(6) K.J. Johnson and R.E. Synovec, Chemom. Intell. Lab. Syst. 60(1–2), 225–237 (2002). https://doi.org/10.1016/S0169-7439(01)00198-8
(7) H.D. Bean, J.E. Hill, and J.M.D. Dimandja, J. Chromatogr. A 1394, 111–117 (2015). https://doi.org/10.1016/j.chroma.2015.03.001
(8) P.-H. Stefanuto, K.A. Perrault, L.M. Dubois, B. L’Homme, C. Allen, C. Loughnane, N. Ochiai, and J.-F. Focant, J. Chromatogr. A 1507, 45–52 (2017). https://doi.org/10.1016/j.chroma.2017.05.064
(9) K.M. Pierce, J.C. Hoggard, J.L. Hope, P.M. Rainey, A.N. Hoofnagle, R.M. Jack, et al, Anal. Chem. 78(14), 5068–5075 (2006). https://doi.org/10.1021/ac0602625
(10) L.C. Marney, W.C. Siegler, B.A. Parsons, J.C. Hoggard, B.W. Wright, and R.E. Synovec, Talanta 115, 887–895 (2013). https://doi.org/10.1016/j.talanta.2013.06.038
(11) B.A. Parsons, L.C. Marney, W.C. Siegler, J.C. Hoggard, B.W. Wright, and R.E. Synovec, Anal. Chem. 87(7), 3812–3819 (2015). https://doi.org/10.1021/ac504472s
(12) N.E. Watson, B.A. Parsons, and R.E. Synovec, J. Chromatogr. A 1459, 101–110 (2016). https://doi.org/10.1016/j.chroma.2016.06.067
(13) S.E. Prebihalo, G.S. Ochoa, K.L. Berrier, K.J. Skogerboe, K.L. Cameron, J.R. Trump, et al, Anal. Chem. 92(23), 15526–15533 (2020). https://doi.org/10.1021/acs.analchem.0c03456
(14) L. Mikaliunaite and R.E. Synovec, Talanta 244, 123396 (2022). https://doi.org/10.1016/j.talanta.2022.123396
(15) B.A. Parsons, D.K. Pinkerton, B.W. Wright, and R.E. Synovec, J. Chromatogr. A 1440, 179–190 (2016). https://doi.org/10.1016/j.chroma.2016.02.067
(16) P.E. Sudol, M. Galletta, P.Q. Tranchida, M. Zoccali, L. Mondello, and R.E. Synovec, J. Chromatogr. A 1622, 462735 (2022). https://doi.org/10.1016/j.chroma.2021.462735
(17) S. Schöneich, G.S. Ochoa, C.M. Monzón, and R.E. Synovec, J. Chromatogr. A 1667, 462868 (2022). https://doi.org/10.1016/j.chroma.2022.462868
(18) LECO Corporation, ChromaTOF Tile Analytical Software. https://www.leco.com/product/chromatof-tile (accessed July 2022).
(19) SepSolve, ChromCompare+. https://www.sepsolve.com/chromcompare/ (accessed July 2022).
(20) G.S. Ochoa, P.E. Sudol, T.J. Trinklein, and R.E. Synovec, Talanta 236, 122844 (2022). https://doi.org/10.1016/j.talanta.2021.122844
(21) C.N. Cain, T.J. Trinklein, G.S. Ochoa, and RE. Synovec, Anal. Chem. 94(14), 5658–5666 (2022). https://doi.org/10.1021/acs.analchem.2c00223
Caitlin N. Cain is with the Department of Chemistry at the University of Washington, in Seattle, Washington.

Robert E. Synovec are with the Department of Chemistry at the University of Washington, in Seattle, Washington. Direct correspondence to: res9@uw.edu


New Study Reviews Chromatography Methods for Flavonoid Analysis
April 21st 2025Flavonoids are widely used metabolites that carry out various functions in different industries, such as food and cosmetics. Detecting, separating, and quantifying them in fruit species can be a complicated process.
University of Rouen-Normandy Scientists Explore Eco-Friendly Sampling Approach for GC-HRMS
April 17th 2025Root exudates—substances secreted by living plant roots—are challenging to sample, as they are typically extracted using artificial devices and can vary widely in both quantity and composition across plant species.

.png&w=3840&q=75)

.png&w=3840&q=75)


.png&w=3840&q=75)


.png&w=3840&q=75)


