Automated High-Throughput Formula Determination and Confirmation with "sub-ppm" Confidence
LCGC Asia Pacific
Combining an ultra fast LC system (e.g., Agilent 1200RRLC, Waters UPLC) with an accurate mass TOF mass spectrometer creates a powerful system for information-rich high-throughput analyses. However, for de novo formula generation and confirmation the residual mass accuracy tolerance of 3–5 ppm can still leave significant ambiguity in the proposed formula. Consequently, skilled manual inspection or further measurements deploying additional analytical techniques (NMR or MS–MS) are frequently required to arrive at a confident formula assignment.
Combining an ultra fast LC system (e.g., Agilent 1200RRLC, Waters UPLC) with an accurate mass TOF mass spectrometer creates a powerful system for information-rich high-throughput analyses. However, for de novo formula generation and confirmation the residual mass accuracy tolerance of 3–5 ppm can still leave significant ambiguity in the proposed formula. Consequently, skilled manual inspection or further measurements deploying additional analytical techniques (NMR or MS–MS) are frequently required to arrive at a confident formula assignment.
Novel technologies embodied in the micrOTOF mass spectrometer (Bruker Daltonics) allows precise measurement of both accurate mass and true isotopic pattern (TIP) over a wide dynamic range, allowing for the automated evaluation of analyses implemented in an open access system. This instrumentation enables chemists with limited LC–MS skills to rapidly confirm and identify pharmaceutical compounds with "sub-ppm" confidence in a fully automated workflow.
Open Access Software Design
Compass OpenAccess (Bruker Daltonics) has been implemented with client/server architecture. All information regarding samples, status of the jobs, data, reports and processing results are stored in an Oracle database. The database, located on a central server, serves multiple instruments and computers. Samples can be submitted easily from any PC in the intranet via a web interface. Available results can be viewed via a simple viewer in the Internet Explorer.
On the acquisition PC a very simple user interface hides the complexity of the LC–MS system and allows the user to easily queue the submitted samples for automatic acquisition and processing.
When the sample has been processed, spectra, chromatograms and formula suggestions are sent to the user as a report in pdf-format via email.
In this example a fully automated procedure using Compass OpenAccess/QC and the micrOTOF was used to both confirm the presence of an expected compound and identify detected impurities in 96 subsequent measurements.
Experimental
Sulphamethazine was spiked with two known impurities and analysed using an Agilent 1200 Rapid Resolution LC System interfaced with a micrOTOF mass spectrometer. The subsequent automated data evaluation first searched for the expected formula (calculating mass deviation and SigmaFit, a combination of accurate mass measurement and true isotopic analysis), and then suggested the most probable molecular formulae for all detected peaks. Additionally, the UV trace was used to calculate the UV purity of the expected compound according to its relative peak area.
To ensure robustness and repeatability of the system, 96 subsequent measurements were performed.
All datasets were automatically recalibrated with lithium formate using DataAnalysis software (Bruker Daltonics); possible molecular formulae were generated using accurate mass, true isotopic pattern and SigmaFit information with generic atomic search criteria (max. C100 H200 N50 O50 Cl10 Br10 S10). Result filter arguments were SigmaFit <0.1, ppm tolerance <6 ppm, max. 2 formulae suggestion, defined adducts (protonated and sodiated) for formula confirmation.
Results
Figure 1 shows an exemplary analysis report, as it is automatically sent to the user. All relevant chromatograms along with the results for the expected compound and the impurities are combined on a single page.
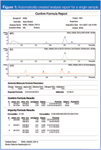
Figure 1
Figure 2 shows the base peak chromatograms of all 96 separations with an average peak width (FWHW) of 4 seconds.
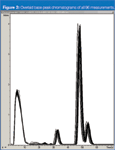
Figure 2
Confirm Formula:
The expected formula of sulphamethazine was confirmed in all 96 samples with an average mass error of 1.5 ppm (SD = 0.8 ppm) with external calibration. Evaluation of the isotopic pattern yielded an average SigmaFit value of 0.007 (SD = 0.002). The average UV purity was determined as 63.6% (SD = 0.4%).
Figure 3 shows the sample rack view, which gives a quick overview of all combined results by means of user definable colour coding. In this example mass deviations for the expected formula are highlighted (green 0–2 ppm; yellow 2–3 ppm; red >3 ppm).
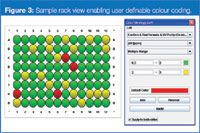
Figure 3
Impurity Formula Determination:
In 78% of the samples the formula of the impurity was the first one in the list, in 99% it was under the first two hits.
Conclusion
De novo formula generation using accurate mass, true isotopic pattern and SigmaFit information allows rapidly confirming and identifying pharmaceutical compounds with "sub-ppm" confidence. This provides a robust base for fully automated formula high-throughput determination and formula confirmation workflows as implemented in Compass OpenAccess/QC.
Sebastian Götz, Thomas Zey, Malte Vahlenkamp and Carsten Baessmann, Bruker Daltonik GmbH, Bremen, Germany.

Bruker Daltonics Inc. Region Asia Pacific
E-mail: Bruker.AsiaPacific@bdal.com
Website: www.bdal.com
Bruker Daltonik GmbH
Fahrenheitstrasse 4, 28359 Bremen, Germany
tel. +49 421 2205 0 fax +49 421 2205 104

The Benefits of Custom Bonded Silica
April 1st 2025Not all chromatography resins are created equal. Off-the-shelf chromatography resins might not always meet the rigorous purification requirements of biopharmaceutical manufacturing. Custom bonded silica from Grace can address a wide range of separation challenges, leading to real performance improvements. Discover more about the latest innovations in chromatography silica from Grace, including VYDAC® and DAVISIL®.
5 Things to Consider When Selecting a Chromatography Silica
April 1st 2025Particularly in the pharmaceutical industry, drug purity isn’t just a goal – it’s essential for achieving safety, stability and efficacy. However, purification is easier said than done, especially with challenging molecules like DNA and RNA “oligonucleotides,” due in large part to their diversity and the range of impurities that can be generated during production. Enter DAVISIL® chromatographic silica, with a wide range of pore diameters and particle sizes to meet your specific application, performance and sustainability requirements. Before you choose the chromatography resin for your next purification application, take a look at these 5 considerations.
Automating Protein Purification: Efficiency, Yield, and Reproducibility
March 27th 2025Recent advancements in automated protein purification stress the importance of efficiency, scalability, and yield consistency. This eBook compares different purification platforms, highlighting their impact on downstream applications and demonstrating how automation enhances throughput and process control.
MilliporeSigma: Ultrapure Water for Sensitive LC-MS Analysis of Pesticides
March 25th 2025The aim of the study was to illustrate the efficiency of Milli-Q® water purification systems in eliminating pesticides from tap water, thereby producing and delivering reliable and consistent-quality ultrapure water suitable for pesticides analysis


