Sonication Impacts and Sonolytic Pathways for Some Organic Solvents Used in Pharmaceutical Analyses
In pharmaceutical residual solvents analyses, some organic solvents are generally used as sample diluents (or sample solvents) (1–4). Interferences from sample diluents should be monitored in method development and routine use. Gas chromatography (GC) is the technique that is widely used for testing gaseous or volatile substances. Many residual solvents are suitable to be analyzed by static headspace–gas chromatography (HS-GC) (1–4). In preparing solid samples for analysis, vortexing, shaking, and sonication are general approaches used in laboratories to accelerate the sample disintegrating and dissolving processes, increase sample extractions, and improve test accuracies. During method development for a drug extended-release tablet product, several whole tablets were used as samples to avoid solvent losses from ground powders and ensure sample representativity. First, it was found that the tablets were not effectively disintegrated when mechanical shaking was used for sample preparation. Therefore, sonication was further applied, and the result was that the disintegrating processes were significantly improved. Unfortunately, some unknown peaks at early retention times in chromatograms of samples were noticed. Further investigations indicated that these unknown peaks were generated from the used organic sample diluents during sonication.
The principles of sonication to accelerate particle disintegration are briefly summarized here. Sonication is the technique of utilizing ultrasounds. When ultrasounds radiate through a medium like water, they cause alternating high pressures and low pressures. During the low-pressure stages, rarefaction forces can overcome the intermolecular forces, break down the connection of molecules, and create cavities (cavitation bubbles). Millions of microbubbles can form and grow during the low-pressure stages. During high-pressure stages under strong compression, many of these bubbles can explode vigorously and release enormous expanding forces and high-speed liquid microjets (5–7). Therefore, when the liquid is close, or adhering to the particle surface or even further infiltrating the tiny pores, sonication can cause powerful disintegration.
Sonication can also cause chemical effects. Along with vigorous disintegrating powers, the cavitation processes of sonication can produce high temperatures and pressures within the bubbles even if there are no significant temperature changes in bulk solutions. The local temperature and pressure created by bubble cavitation can be 5000 K and
1000 atm, respectively (5–7). Recent studies showed that the acoustic cavitation could cause even much higher intrabubble temperatures and form plasmas comprised of ions and high-energy electrons (8,9). Therefore, under such extreme circumstances, the thermal energies produced by high temperatures can cause chemical bond dissociation and create free radicals. For this reason, thermal decomposition, or pyrolysis, were commonly adopted to describe the sonication destruction processes. After being captured by spin trapping chemicals, the formed free radicals can be detected by techniques of electron paramagnetic resonances (also called electron spin resonances) (10,11). The free radicals in solutions are not stable and can be rearranged to form stable molecules which are different from the originals. Many results of sonication on aqueous and nonaqueous solutions analyzed by various techniques have been reported (10–15). Sonication products of acetic acid and benzyl alcohol, analyzed with GC techniques, have also been reported (16,17).
In this project, the sonication effects on some daily used organic solvents in pharmaceutical residual solvents analyses, such as N,N-dimethylformamide (DMF), N,N-dimethylacetamide (DMA), dimethyl sulfoxide (DMS), and benzyl alcohol (BA), were studied. To avoid any loss of gaseous and volatile products, the sealed headspace vials were used during solvent sonication and then injected directly into the static HS-GC systems with different columns and detectors. Their sonolytic products were detected, resolved, and identified. Their sonolytic pathways, radical formations, radical rearrangements, and peak patterns were further discussed. Besides thermal decomposition or pyrolysis, knowledge of electron ionization–mass spectrometry (EI-MS) was used to provide specific explanations for the sonication radical formation processes.
Materials and Experimental
Materials and Instrument
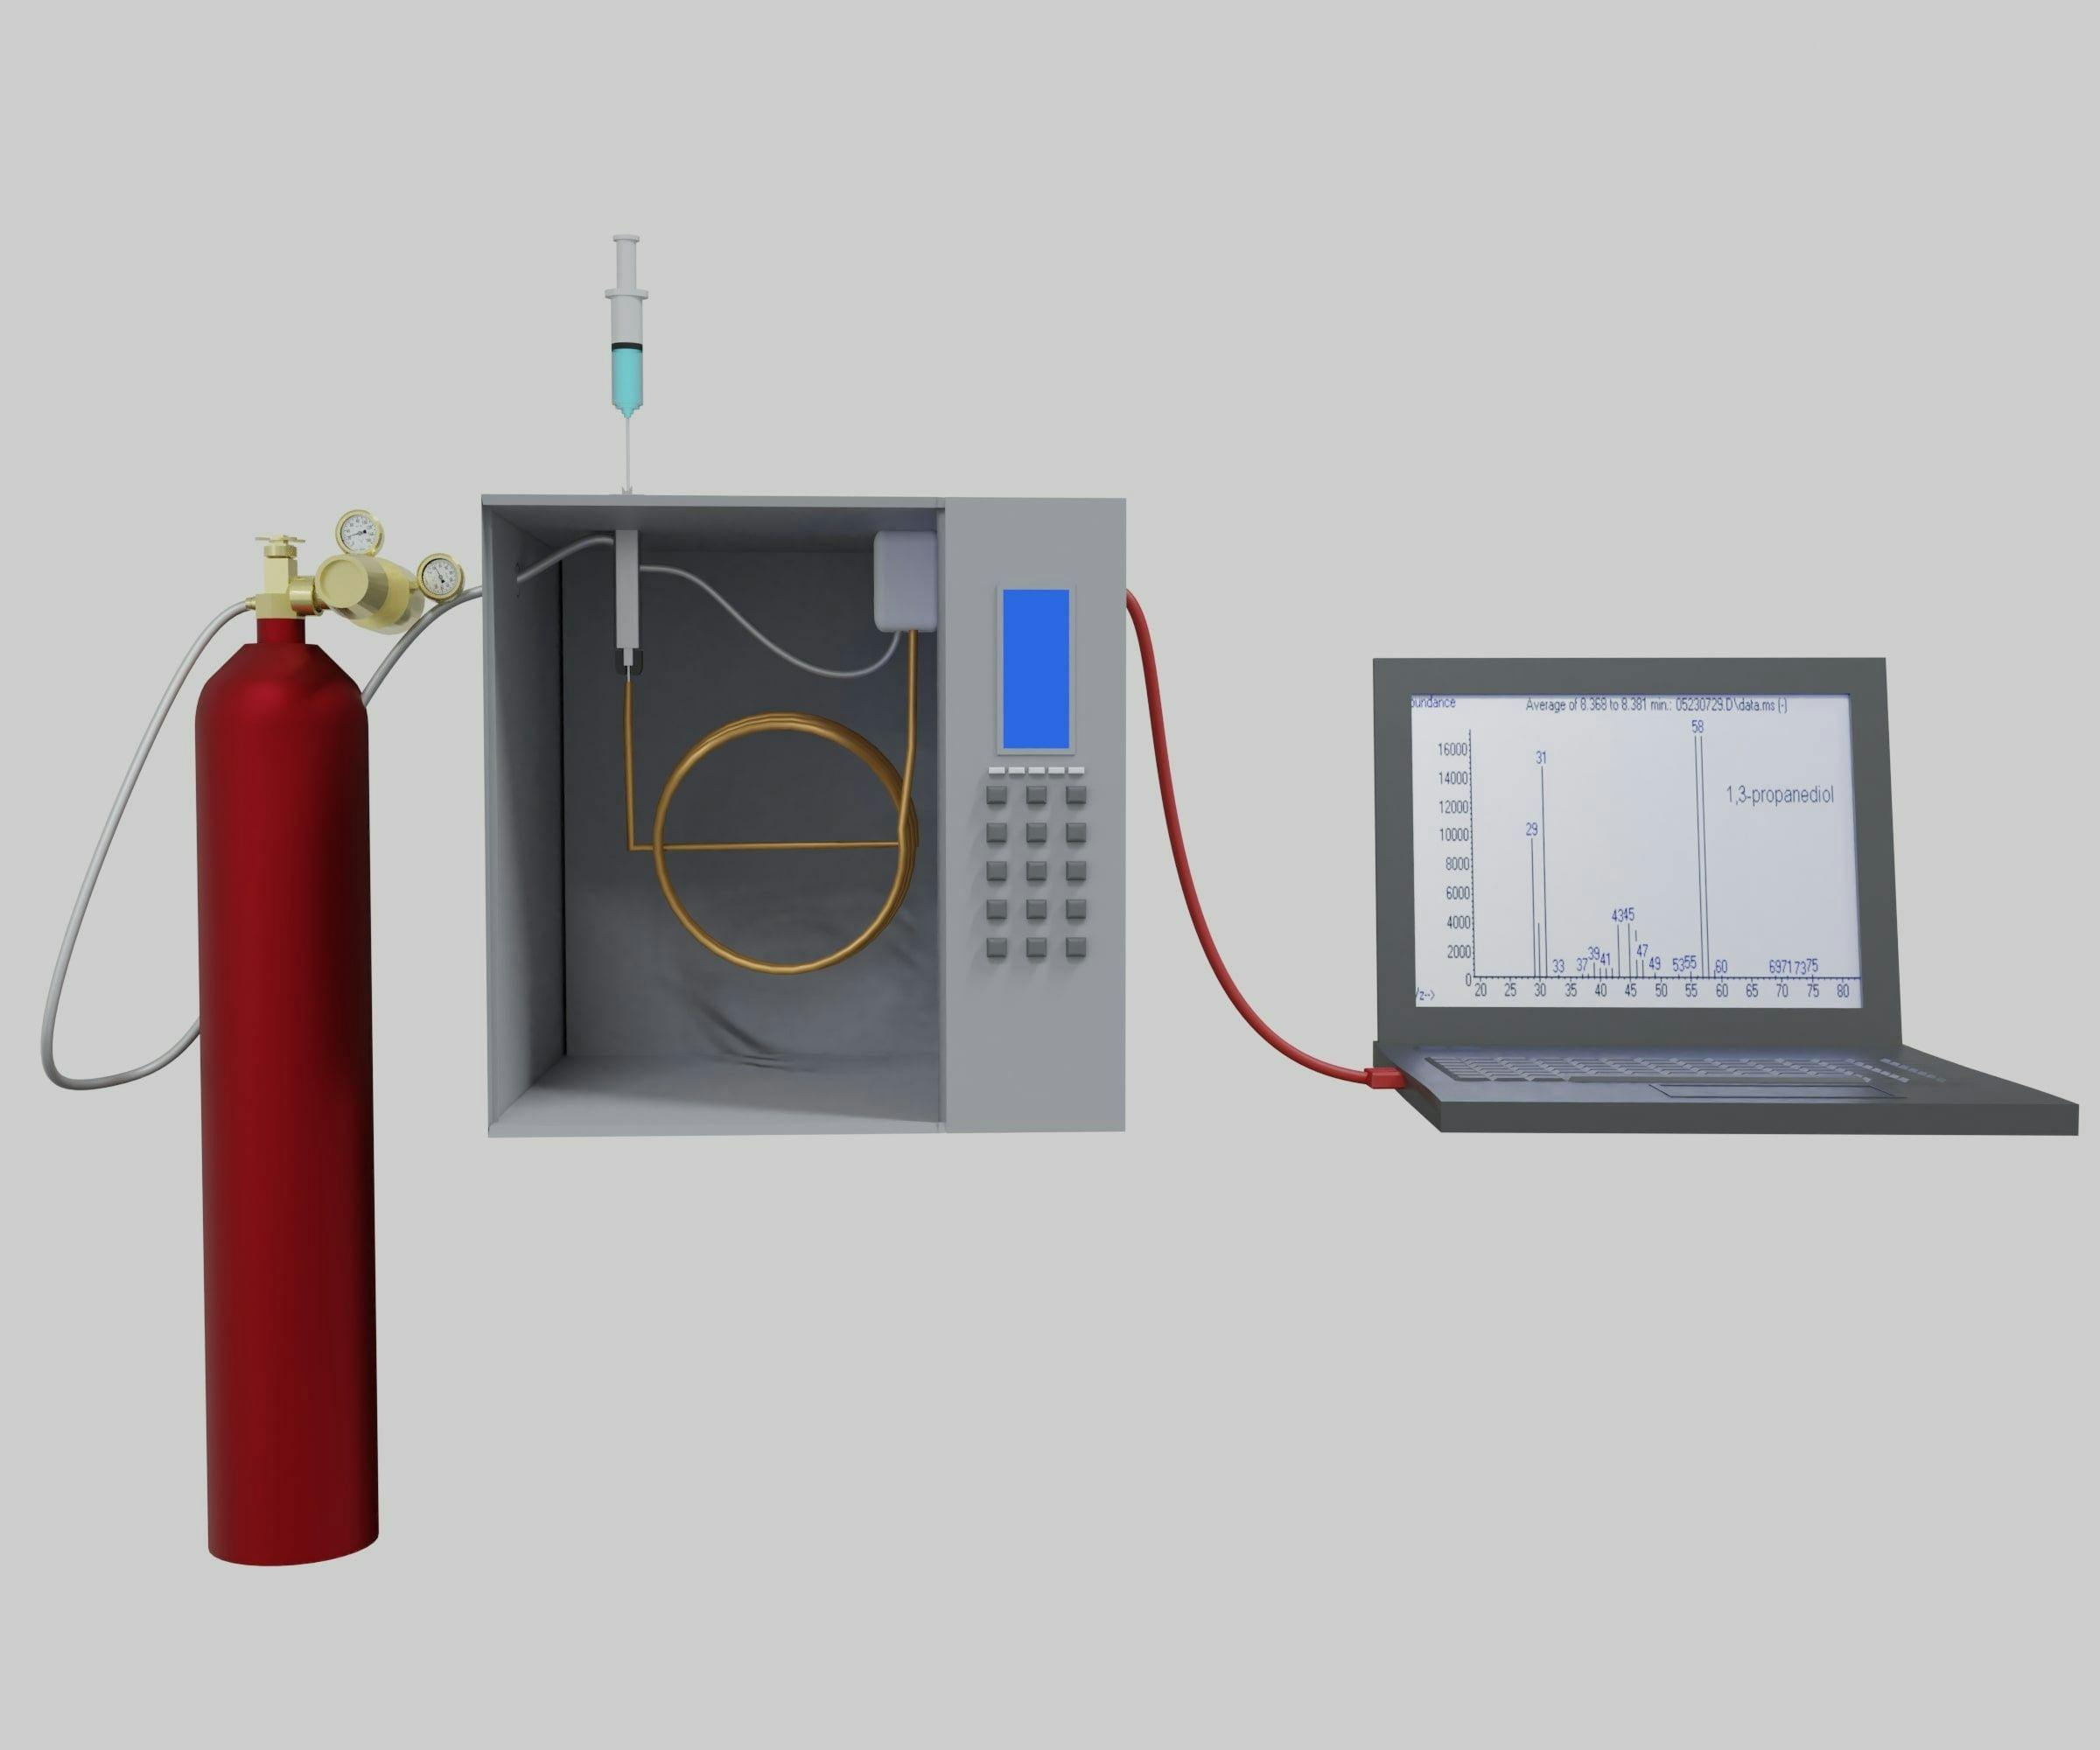
All of the chemicals and reagents used were common inventories. An Agilent GC 6890 or 7890 series, with headspace autosamplers (mode 7694 or G1888) and a flame ionization detector (FID) or N5973 mass spectrometer detector (MSD), were used. A capillary column, DB-WAX, with a 0.5 µm film thickness, dimensions of 60 m x 0.32 mm, and a column HP-PLOT/Q with a 40 µm film thickness and dimensions of 30 m x 0.53 mm, were employed for analysis (Agilent Technologies).
Instrument Parameters
For the headspace autosampler, the temperature for the oven, loop, and transfer line were 80, 170, and 175 °C, respectively. Vials were equilibrated with high agitation for 20 min. The times for vial pressurization,
loop fill, loop equilibration, and injection were all set at 0.2 min. The vial fill pressure was 10 psi, and each vial underwent a single extraction, with the injection volume set at 1.0 mL.
For the GC instrument, the carrier gas was helium, and the constant flow mode had an initial velocity of approximately 30 cm/s. The type of inlet was the volatile interface inlet with a split ratio of 5, and its temperature was set at 200 °C. For the GC oven program, the initial oven temperature was set at 50 °C and held for 15 min, then ramped up to 150 °C with a rate of 30 °C/min, and held for 5 min. The oven program was further ramped up at a rate of 50 °C/min to 220 °C and held for 10 min. When using the HP-PLOT/Q column after each injection, the column was baked at 220 °C for 30 min to remove the solvent main peak and other possible late eluted peaks.
For the detectors, the FID temperature was set at 250 °C, with the hydrogen flow rate at 40 mL/min, the air flow at 400 mL/min, and the make-up gas (helium) at 25 mL/min. For the MSD parameters, the transfer line temperature was set at 240 °C, the ion source temperature at 150 °C, and the EI energy at 70 eV with positive mode.
Preparations of Sonicated Solvents
To prepare the sonicated solvents, 3.0 mL of each solvent was added into a 20-mL size headspace vial before being sealed tightly. The vial was sonicated at different times in a Branson Mode 8800 ultrasound sonicator with 40 kHz transducers.
Chromatograms
All chromatographic runs were completed as per the procedures described in the “Instrument Parameters” section. The whole chromatogram for each injection was obtained. To better focus on targeted unknown peaks, only the relevant parts of the chromatograms were presented in the respective figures.
Results and Discussion
Sonication Degradants Analyzed with DB-WAX Column
To verify the occurrences of sonication-caused unknown peaks with different types of organic solvents, DMF, DMA, DMS, and BA were used and analyzed with HS-GC systems with DB-WAX columns and the FID instrument. A FID instrument is a selective detector that is only sensitive to hydrocarbon portions of substances, and its responses are directly proportional to the concentrations of carbon atoms in compounds (at least for light hydrocarbons). Non-hydrocarbon substances, such as the air (O2, N2, CO2), H2O, carbon disulfide, and sulfur dioxide, do not produce signals under FID (18). Therefore, the interferences of air, which may happen with MSD, can be removed under FID.
Solvent vials were sonicated for approximately 3 h. The non-sonicated (control) and sonicated solvents were injected. The early front parts of the chromatograms (2–6 min), which included the target unknown peaks, were shown in Figure 1. In this time range, the baselines for all four non-sonicated solvents were similar to each other. Thus, only the non-sonicated N,N-dimethylacetamide was shown as the control in Figure 1.
Figure 1: The chromatograms (2–6 min) of sonicated solvents obtained on HS-GC-FID with DB-WAX column; Lines from bottom to top were the control (non-sonicated N,N-dimethylacetamide), sonicated benzyl alcohol (BA), sonicated N,N-dimethylformamide (DMF), sonicated N,N-dimethylacetamide (DMA), and sonicated dimethyl sulfoxide (DMS), respectively.

The peaks shown at 2.9–3.1 min in Figure 1 were the unknown peaks previously observed in preliminary trails. Through further studies, these peaks were confirmed to be the real solvent peaks rather than those from baseline disturbances at the column void volume,
system spiking, or HS intrinsic reactions, and they were truly caused by sonication.
To identify these unknown peaks by their mass spectra, the non-sonicated and sonicated solvents were injected on the HS-GC-MSD system installed with the DB-WAX column. The total ion chromatograms were collected. For checking the differences, chromatograms of the non-sonicated and sonicated solvents were overlaid for each solvent and are shown in Figure 2. The chromatograms of 0–9 min, which covered all significant changes, was presented.
In Figure 2, the targeted unknown peaks from Figure 1 were not observed. Instead, there was a huge peak at 2.4–3.0 min. Mass spectra shown that its components were the air. Because MSD is sensitive to all charged substances and produce signals for them, the extremely intensive peak of air was recorded, which concealed those unknown peaks previously observed with FID.
Despite the air interferences, other new findings were observed in the sonicated solvents. After sonication, DMF and DMA had one new peak (peak #1); DMS produced two new peaks (peak #2 and #4); and BA formed three new peaks (peak #5, #6, and #8). Meanwhile, the peak size of peak #3 in DMS and peak #7 in BA increased significantly after sonication. All these new or size-increased peaks were identified by their mass spectra. Their retention times and identified names were listed in Table I.
Table I: Retention times and names of degradants of sonicated solvents obtained by HSGC-MSD system with DB-WAX column
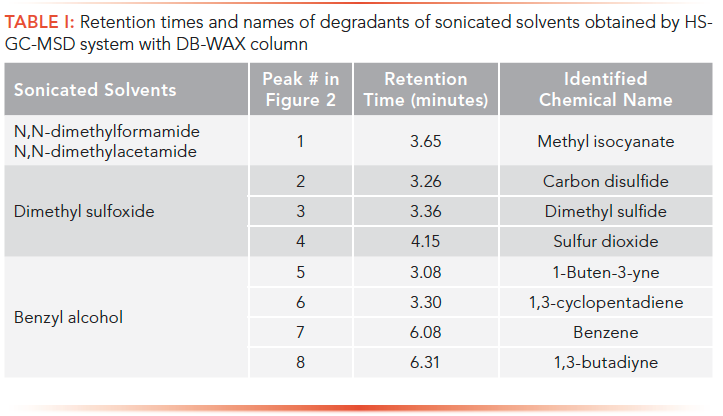
All these degradants in Table I are their structure-related compounds for these solvents. The earliest eluted identifiable peak in Figure 2 was 1-buten-3-yne with a retention time of 3.08 min, which was just behind the huge peak of air. Because 1-buten-3-yne is a C4 compound, only hydrocarbons can create sensitive signals to FID. Therefore, it can be reasonably assumed that the peaks at 2.9–3.1 min in Figure 1 were possibly components of C1 to C3 light hydrocarbons.
Light Hydrocarbon Sonolytic Products Analyzed with an HP-PLOT/Q Column
To verify the above hypotheses, an Agilent HP-PLOT/Q column, capable of separating C1-C3 hydrocarbons, was employed. For each solvent, the sonicated and non-sonicated were injected on the HS-GC-FID systems installed with an HP-PLOT/Q column. Chromatograms of 0–21 min are shown in Figure 3. In this time range, the baselines for all four non-sonicated solvents were similar to each other. Then, only the non-sonicated of DMA was shown as the control in Figure 3. Figure 3 shows that many degradant peaks were found, and they were separated completely without any air interference.
Figure 3: The chromatograms (0–21 minutes) of sonicated solvents obtained on HS-GC-FID systems with HP-PLOT/Q column. Lines from bottom to top are the non-sonicated DMA as control, the sonicated DMF, sonicated DMA, sonicated DMS, and sonicated BA, respectively. Peak names were: 1: methane; 2: ethylene; 3: acetylene; 4: ethane; 5: propylene; 6: propane; 7: propyne; 8: 1-buten-3-yne.

To identify these peaks, the individual substances of methane, acetylene, propane, and butane were injected along with the above injections to match the retention times, and the vials of sonicated DMS and BA were injected on the HS-GC-MSD system installed with the HP-PLOT/Q column for acquiring the mass spectra. In addition, the typical chromatograms of C1 to C3 hydrocarbons from the column performance summary sheet of the HP-PLOT/Q column (Agilent Technologies) was used for peak position alignment. These peaks in Figure 3 were identified as C1-C4 hydrocarbons, and their names are listed in Table II. From the peak sizes in Figure 3, it was determined that most amounts of them were C1 and C2 hydrocarbons, and slight amounts were C3 and C4 hydrocarbons.
In Figure 3, the last eluted peak (peak #8) was 1-buten-3-yne, which was the first identified peak (peak #5) in Figure 2. They were all from the sonicated BA. Therefore, using 1-buten-3-yne as the joined point, chromatograms of Figure 3 can be connected in front of that of Figure 2 to present a whole view of chromatograms obtained with both DB-WAX and HP-PLOT/Q columns for each solvent. The front parts were C1-C3 hydrocarbons, and the late parts were other various structure-related degradants. Conclusively, it was approved that sonication produced C1 to C3 hydrocarbons and other structure-related degradants for all the four studied solvents.
To further study the effecting extents of sonication with different sonication times, all four solvents were sonicated up to 4 h and injected on HS-GC-FID systems with the HP-PLOT/Q column. The peak area, total peak area, and area percentage for each solvent were calculated. These results were tableted and are displayed in Table II.
Table II: Peak name, retention times, peak area, total peak area, and area percentage of C1–C4 hydrocarbon degradants obtained by HS-GC-FID systems with HP-PLOT/Q column under different sonication times
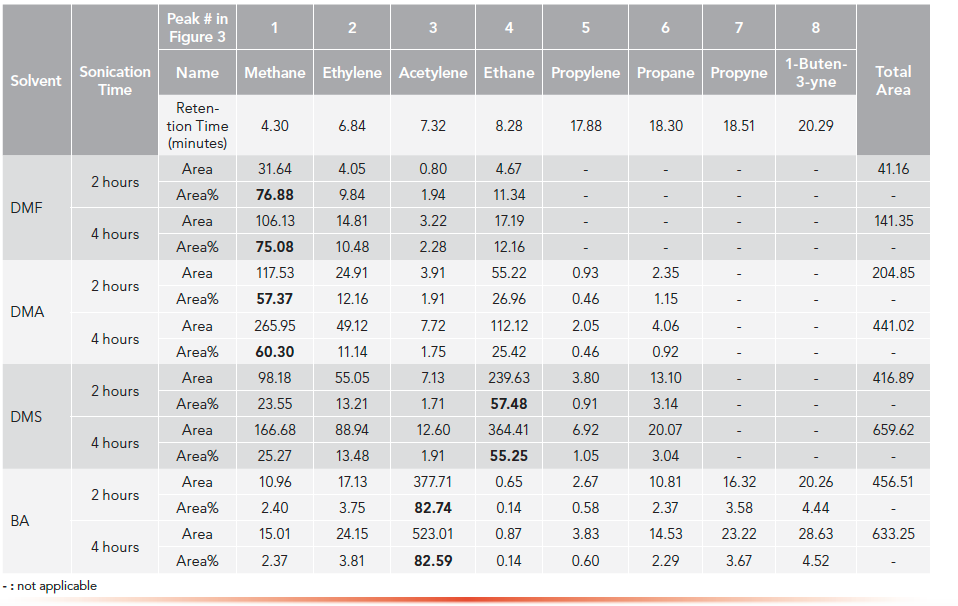
The total area of all light hydrocarbon peaks can be used an indicator for the overall effects of sonication, which is the extent of sonication effects. The results in Table II show that the sonication effects became larger as the sonication time increased. For example, after sonication from 2 h to 4 h,
the total peak areas of DMA were significantly increased from 205 to 441.
In addition, it was also found that under the same sonicating time, the sonication effects on different solvents were significantly different. For example, with 2-h sonication, the total peak areas for DMF, DMA, DMS, and BA were 41, 205, 417, 457, respectively. The order of sonication effects for these 4 solvents were DMF < DMA < DMS and BA.
It was further noticed that there were specific peak patterns of C1-C3 hydrocarbons for each solvent. DMF and DMA had a predominated methane peak; DMS had a predominated ethane peak. On the other hand, BA had a predominated acetylene peak. Moreover, these peak patterns were kept consistent at different sonicating times. As sonication time increased, the peak area of each degradant was increased significantly, but its area percentage remained nearly unchanged. For example, in DMA, as sonication from 2 h to 4 h increased the peak area of methane from 117.53 to 265.95, its area percentage was almost kept stable as 57.37% and 60.30%, respectively. From the above facts, the conclusion was that under the experimental conditions in this project for each solvent, its sonication-caused bond cleavages and sonolytic processes are selective and specific in the sonolytic mechanisms, rather than a random occurrence.
Sonolytic Pathways and C1–C3 Hydrocarbon Peak Patterns
Based on the above results, we know that the sonication bond cleavages of solvents do selectively more often occur on specific sites rather than randomly occurring on all places. The bond cleavages depend on many factors, such as molecular properties like chemical structures,
chemical environments, electron distributions, bond strengths, and bond dissociation energies, and also on sonication-related parameters, such as sonication strengths, frequencies, durations, and so on. Therefore, the solvent sonolytic processes are very complicated, and so far, there are few reports available to elaborate on all their aspects. In this study, chemical structure knowledge and fragmentation rules for EI-MS were used to tentatively provide specific explanations for sonolytic bond cleavages and radical formation processes. The mechanisms and pathways described here were based on the observed structure-related degradants and the relative amounts of C1-C3 hydrocarbon products obtained under the experimental conditions used in this project. In this report, all simple fragments, if not specified, were meant to be radicals, like radials of H and CH3 (in literatures, radicals were often denoted with a dot, such as •H and •CH3, for indicating the unpaired electron of radicals).
DMF Sonolytic Pathway

For DMF, primarily and preferably, the C-H bond at the α position undertakes cleavages to release hydrogen. Meanwhile, the N-C bond at the β position performs cleavages to release CH3, and the residual stem becomes the molecule of methyl isocyanate. The primary step of radical rearrangements is that H and CH3 combines to form methane. The observed predominant methane peak (75%) confirmed this reaction step. In addition, CH3 and CH3 also have chances to combine to form ethane. Second, CH3 can go further to dissociate H, as CH3→CH2→CH. These radicals can recombine to form other compounds such as ethylene and acetylene. Each further step of bond dissociation needs extra energies and then their dissociation extents will be less. Thus, their correspondingly formed compounds will be less as well. The facts, that only approximately 10% ethylene and 2% acetylene were formed, confirmed this tendency.
The peak pattern for DMF was methane (75%) > ethane (12%) > ethylene (10%) > other hydrocarbons (≤2%).
The straightforward pathways of radical rearrangements to form C1 to C3 hydrocarbons are listed as below.
Methane: H + CH3 → CH4 [1]
Ethane: CH3 + CH3 → H3C-CH3 [2]
Ethylene: CH2 + CH2 → H2C=CH2 [3]
Acetylene: CH + CH→ HC≡CH [4]
Propane: CH2 + H3C-CH3→ H3C-CH2-CH3 [5]
Propylene: CH2 + H2C=CH2 → H3C-HC=CH2 [6]
Propyne: CH2 + HC≡CH → H3C-C≡CH [7]
DMS Sonolytic Pathway

For DMS, all the bonds can possibly be cleft. When only the S=O bond clefts,
it is to form molecules of dimethyl sulfide. S-C bond cleavages are to form CH3. All the bonds can be cleft simultaneously to produce other radicals, and these radicals can rearrange to form molecules of carbon disulfide (CS2) and sulfur dioxide (SO2).
The two methyl groups connected to atom sulfur are under the same chemical environments and thus, they are equivalent. Therefore, they should have an equal chance to produce S-C bond cleavages and equal amounts of CH3. The primary radical rearrangement is to be a combination of CH3 and CH3 to form ethane. The predominant ethane peak (55%) confirmed this reaction step. As described in DMF, CH3 can conduct further cleavages to form CH2, CH, and H, and these radicals can recombine to form methane, ethylene, and other hydrocarbons.
The peak pattern for DMS was ethane (55%) > methane (25%) > ethylene (13%) > other hydrocarbons (≤3%).
DMA Sonolytic Pathway

In DMA, the C-C bond at α position and the N-C bond at β position undertake cleavages, and both sites release CH3. The residual stem becomes molecules of methyl isocyanate, which is same as that in sonicated DMF. Based on the stories on DMS, the formed CH3 and CH3 radicals should primarily recombine to form ethane as the predominate peak for DMA. However, in DMA, rather than ethane, methane is the predominate peak (60%). The reason for this variation is that the two methyl groups at α and β positions of DMA are not equivalent because of their different chemical environments.
The peak pattern for DMA was methane (60%) > ethane (25%) > ethylene (11%) > other hydrocarbons (≤ 2%).
The peak order in DMA is the same as that of DMF, with only slight differences in area percentage for each peak, and both have the same degradant of methyl isocyanate. Therefore, based on their close similarities of chemical structures and sonolytic products, it can be deduced that DMA and DMF should have similar mechanisms for sonicating bond dissociations. For making methane in DMF, the only source of CH3is the β position N-C bond cleavages; analogously, the β position N-C bond cleavages in DMA should also be the key sources of CH3. The sources for providing hydrogen should be at the α positions for both solvents.
In EI-MS, the radical site of DMF or DMA molecular ions can be sited on their oxygen atoms (19). For DMF, the radical initiated bond cleavages can release H radicals by cleaving the C-H bond at the α position. For DMA, the radical initiated bond cleavages break down the C-C bonds at the α position to release CH3 radicals. Therefore, in DMA, to provide enough H radicals for making the predominate methane peak, the formed CH3 from the α position should immediately perform further C-H cleavages or the C-H bond cleavages happen simultaneously as C-C bond cleaving. The common phenomena of losses of hydrogen from oxygen or nitrogen-containing compounds in EI-MS may provide some clues for the sources of hydrogen coming. However, further studies are needed to reveal their in-detail mechanisms.
BA Sonolytic Pathway

In BA molecules, the oxygen atom also can be the radical site. The radical initiated bond cleavages break down the Ph-C bonds to produce phenyl (C6H5) radicals and CH2-OH radicals. The CH2-OH radicals perform further cleavages to create CH, H, and OH. Phenyl radical and hydrogen can combine to form benzene molecules, which was observed in sonicated BA. Hydrogen and OH can form water, which is the typical neutral loss for alcohol fragmentations in EI-MS (19). CH and CH radicals can combine to form acetylene. It was the only predominate peak observed among many other peaks in sonicated BA. CH can also obtain hydrogen to form CH2 and CH3, stepwise as CH→CH2→CH3. These radicals can further form other C1 and C2 compounds, and obviously their occurrences should decrease as the steps go further. The results of acetylene (83%) > ethylene (3.8 %) > ethane (0.14%) verified these radical formation and rearrangement processes.
The peak pattern of BA was acetylene (83%) > all other hydrocarbons (<5%)
Conclusion
In this report, the sonication effects on organic solvents, DMF, DMA, DMS, and BA were studied. Sonication can cause degradations of these solvents. Although only a small portion of solvents undertook degradations under sonication, it can still cause serious quality issues for the analyses of residual solvents of pharmaceuticals, in which the ppm level effect may result in out of specification (OOS) results. Solvents sonolytic degradant peaks were detected, resolved, and identified by using different columns and detectors on static headspace gas chromatographic systems. Their sonolytic products were determined to be C1-C3 hydrocarbons and other structure-related compounds. The peak pattern of C1-C3 hydrocarbon degradants was specific for each studied solvent. Their sonolytic pathways, bond cleavages, radical formations, and radical rearrangements were illustrated in detail. Knowledge of EI-MS was also helpful in understanding the specificity of sonication degradation processes for these solvents. Further studies are still strongly required to reveal the full mechanisms of solvent sonolytic processes.
References
- International Conference on Harmonization, ICH Q3C(R6), Impurities: Guideline for Residual Solvents (ICH, Geneva, Switzerland, 2016)
- K. Urakami, A. Higashi, K. Umemoto, and M. Godo, J. Chromatogr A. 1057, 203–210 (2004). DOI:10.1016/j.chroma.2004.09.055
- L. Dai, A.C. Quiroga, K. Zhang, H.B. Runes, D.T. Yazzie, K. Mistry, et al, LCGC North Am. 28(1), 54–66 (2010).
- Y. Wang, J. Wang, and P. Panzade, LCGC North Am. 38(11), 627–633 (2020).
- J. Mason, Sonochemistry: The Uses of Ultrasound in Chemistry (Royal Society of Chemistry, Cambridge, United Kingdom, 1990), pp. 1–8.
- T. Leong, M. Ashokkumar, and S. Kentish, Acoustics Australia 39(2), 43–52 (2011).
- B. Savun-Hekimoğlu, Acoustics 2, 766–775 (2020). DOI:10.3390/acoustics2040042
- D. Flannigan and K.S. Suslick, Nature 434(3), 52–55 (2005).
- S.I. Nikitenko, Adv. Phys. Org. Chem. 2014, 173878 (2014). http://dx.doi.org/10.1155/2014/173878
- V. Misik and P. Riesz, Ultrason. Sonochem. 3, S173–S186 (1996)
- P. Riesz, D. BerdahI, and C.L. Christman, Environ. Health Perspect. 64, 233–252 (1985).
- K.S. Suslick, J.J. Gawlenowskl, P.F. Schubert, and H.H. Wang, J. Phys. Chem. 87, 2299–2301 (1983).
- K. Maklno, M.M. Mossoba, and P. Rlesz, J. Phys. Chem. 87, 1369–1377 (1983).
- Y. Mizukoshi, H. Nakamura, H. Bandow, Y. Maeda, and Y. Nagata, Ultrason. Sonochem. 6, 203–209 (1999)
- B. Savun-Hekimoğlu and N.H. Ince, Ultrason. Sonochem. 54, 233–240 (2019). https://doi.org/10.1016/j.ultsonch.2019.01.034
- T. Kimura, H. Harada, T. Ando, M. Fujita, J.M. Levêque, and J.L. Luche, Chem. Commun. 2002(11), 1174–1175 (2002). DOI: 10.1039/b202350d
- K. Urakami, C. Kobayashi, Y. Miyazaki, K. Nishijima, Y. Yoshimura, and K. Hashimoto, Chem. Pharm. Bull. 48(9), 1299–1303 (2000)
- M. Kállai, Z. Veres, and J. Balla, Chromatographia 54, 511–517 (2001)
- E. Hoffmann and V. Stroobant, Mass Spectrometry: Principles and Application, 2nd Ed.(John Wiley and Sons, Chichester, United Kingdom, 2002), pp. 208–238.
Yu (Yon) Wang, Jianchen (Jessie) Wang, Thangavelauthum Ravishanker, and Prasad Panzade are with the R&D Department at Apotex Inc, in Toronto, Ontario, Canada. Direct correspondence to: ywang10@apotex.com.

New Study Reviews Chromatography Methods for Flavonoid Analysis
April 21st 2025Flavonoids are widely used metabolites that carry out various functions in different industries, such as food and cosmetics. Detecting, separating, and quantifying them in fruit species can be a complicated process.

.png&w=3840&q=75)

.png&w=3840&q=75)


.png&w=3840&q=75)


.png&w=3840&q=75)


