Multi-Attribute Monitoring and the Multi-Attribute Method: A Powerful Double Act for Supporting Biopharmaceutical Manufacturing
As biopharmaceutical manufacturers look towards implementing solutions for real-time process monitoring, the availability of simple, yet informative analytical methods is required. In this article, we discuss the combination of multi-attribute monitoring using Protein A affinity chromatography coupled to mass spectrometry (MS) for rapid trending of product quality attributes (PQAs) during upstream processing, with the multi-attribute method (MAM) for site-specific analysis of PQAs and new peak detection to determine adherence to specifications. Working together, these multi-attribute approaches represent a powerful combination for advanced process control.
Biopharmaceuticals, such as monoclonal antibodies (mAbs), continue to dominate the global pharmaceutical market with the expectation that they will hold 20% of the market share by the end of 2022. This growth is because of the success of these products in treating complex diseases, such as cancer, and the development of biosimilars and next-generation biotherapeutics, which include bispecific antibodies and cell and gene therapy products (1).
MAbs are mixtures of complex glycoproteins that consist of two heavy chains and two light chains. These chains are connected through a series of intra- and interchain disulfide bonds that stabilize the structure. MAbs are produced through industrial scale bioprocessing of mammalian cells, such as Chinese hamster ovary (CHO) cells and undergo a series of enzymatic and chemical post-translational modifications (PTMs). These modifications can impact the overall biological activity produced; consequently, there are product quality attributes (PQAs) that must be monitored to ensure their abundance is within an acceptable limit or range (2). Examples of these modifications that impact PQAs include asparagine deamidation, methionine oxidation, and the types and abundance of different glycans present on the mAb (3). Several parameters during the bioprocess can affect the abundance of PQAs. For example, reducing the levels of dissolved oxygen within a bioreactor was previously shown to decrease the levels of galactosylated glycans using continuous culture conditions (4).
Protein A affinity chromatography is often the frontline strategy for purification of mAbs following upstream bioprocessing. In Protein A chromatography, the Fc region of the mAb binds to the Protein A while the unbound media and cellular components pass through the column. The mAb is then eluted from the column through disruption of the Protein A–mAb interaction using a low pH buffer (5). Following purification, the product is fully characterized. Process analytical technologies (PAT) that could be both at-line and online have been recently implemented to allow closer monitoring of protein expression process (6,7). Indeed, the ability to evaluate proteoforms of the product even at early stages could help with optimizing the culture strategy. Normally, at-line strategies require purification steps to remove culture media components that create a complicate matrix that is not compatible with most detection techniques. For this reason, these workflows can be lengthy. Nevertheless, the amount of information returned can be extensive, making it worth the investment of time and effort to characterize the product during the growth and harvest steps. The multi-attribute method (MAM) was employed for this purpose in the past (8–10). This workflow consists of liquid chromatography–mass spectrometry (LC–MS) peptide mapping analysis that allows for simultaneous and automated monitoring of multiple PQAs through the use of the instrument and processing method based on previous reference analysis. Using accurate high-resolution mass data and highly reproducible chromatographic retention times (tR), the software can identify and quantify low abundant variations as well as the presence of contaminants through a nontargeted MS approach named new peak detection (NPD) (11). Although MAM has proven to be effective in the monitoring of PQAs over the course of a bioproduction cell culture, it is still a bottom-up process that requires a long sample preparation protocol combined with the potential risk of inducing modification during the sample preparation steps that could affect the quantitation of naturally occurring PQAs.
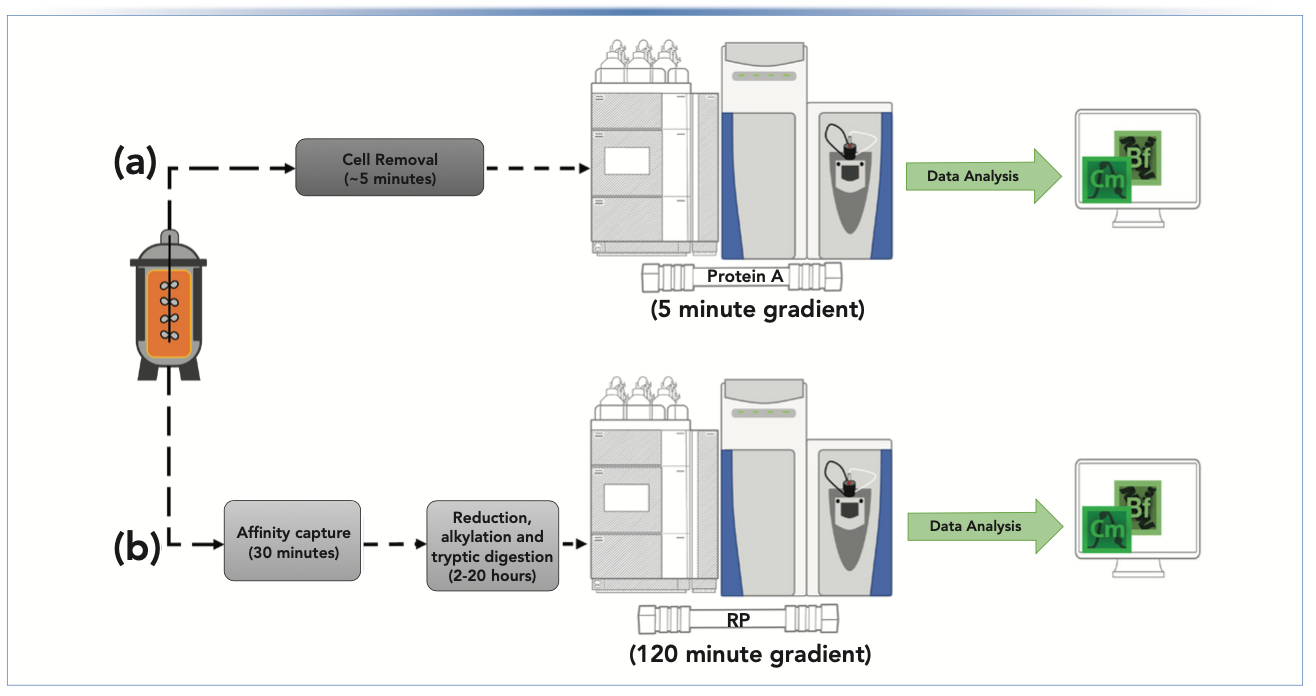
Recently, an effort to obtain highly informative data from more direct and upstream-friendly methods has resulted in the MS-compatible analysis of cell-free cell culture fluid collected from the bioreactor. A multi-attribute monitoring workflow based on directly coupling of Protein A to MS, referred to as Protein A-MS, combines the chromatographic removal of culture media components while performing native MS analysis of the proteins using MS compatible buffers that allow release from the affinity stationary phase (5). Protein A-MS allows rapid monitoring of important features such as C-terminal lysine clipping, N-glycans, and other PQAs. Moreover, the workflow has the strong potential to be easily implemented online. Here, we compare two characterization approaches on samples obtained from the same bioreactor campaign; the first uses at-line Protein A-MS (Figure 1a), and the second is a standard MAM workflow following off-line Protein A product purification (Figure 1b). As the distribution of N-glycans on the Fc region plays a key role in the biological function of the antibody (that is, potential immunogenicity, stability, and clearance in vivo), we focused on determining this critical feature using the two methodologies.
FIGURE 1: Workflow for a dual multi-attribute monitoring and multi-attribute method being applied to a bioreactor campaign. (a) A sample is collected from the bioreactor; cells are removed and the sample is injected onto a protein A column prior to MS analysis. Data are directly analyzed through deconvolution and proteoform quantitation. (b) The samples are purified through affinity capture and tryptic digest ion is performed. This step can take up to 20 h, depending on the sample. The sample is analyzed through RP–MS where a processing method specific for the sample already exists. NPD is also applied.

Results
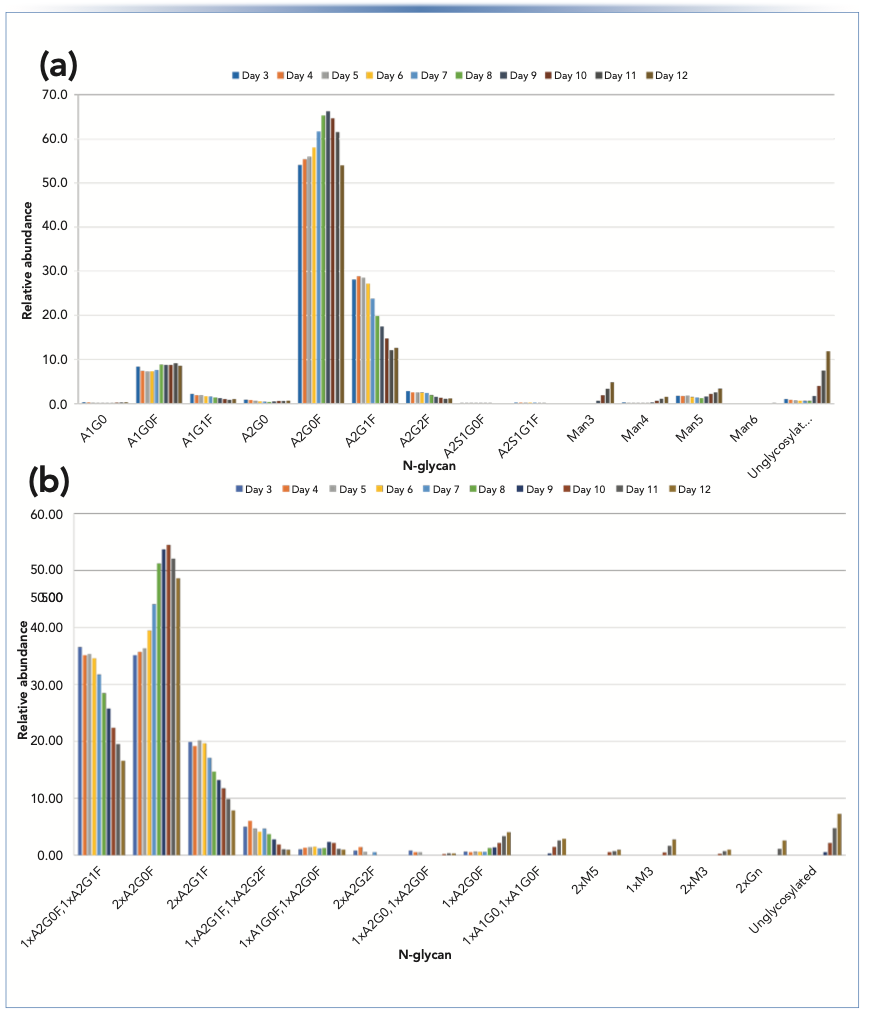
MAM and multi-attribute monitoring workflows were both applied to monitor an IgG1 produced by a CHO cell line, cultured in 250 mL shake flasks over 12 days, using three biological replicates. Monitoring of the N-glycan distribution started from day three onwards. Detailed information regarding the workflows and all LC–MS parameters were reported previously (5,9). For the peptide mapping-based MAM workflow, 10 mL of media were taken daily from the flasks, clarified, and purified on a 1 mL Protein A affinity column. Tryptic digestion was performed using 100 μg of the purified IgG1 and deploying LC–MS analysis using standard reversed-phase (RP) LC with a 120-min gradient per injection used. The resulting raw files were processed directly in the chromatography data system software using a processing method generated based on prior analysis of reference material. For multi-attribute monitoring, 100 μL of the same clarified culture media were directly injected on a 4 x 35 mm MAbPac Protein A column (Thermo Scientific) using a 5-min step gradient of 50 mM ammonium acetate. A pH of 7.0 was used for the binding step and acetic acid, and a pH of 2.5 was used for the elution step. Both analyses were performed on a Thermo Scientific Orbitrap Exploris 240 mass spectrometer. Figure 2 shows a comparison of the N-glycan quantitation obtained from the MAM workflow. Upon comparing both methods and considering that the Protein A-MS approach provides information on the N-glycans present on both heavy chains at the same time, the relative abundance of glycoforms detected over the course of the 10 days shows a similar trend. Although galactosylated species show a steady decrease over the duration of the cell culture, proteoforms containing agalactosylated N-glycans increase with increasing cell density before reducing again when cell viability begins to drop significantly at approximately day 10. Simultaneously, more truncated species, such as high-mannose glycans, increased while the overall glycosylation site occupancy of the N301 residue decreased significantly.
FIGURE 2: Bar graph plots showing the relative abundance of the glycoforms obtained through (a) the MAM and (b) the multi-attribute monitoring based on protein A MS. Average percentage values were calculated from triplicate analysis on three biological replicates (n = 9).

Conclusions
The need for close monitoring of biopharmaceuticals over all steps of the bioproduction process is driving the introduction of data-rich assays for deployment as process analytical technologies and to improve batch release operations. This need is reflected in the introduction of mass spectrometry as an analytical tool not only in research laboratories, but also in the quality control (QC) environment. In this scenario, intact mass analysis could be employed not only for mass-based identity confirmation, but also to evaluate and quantify product quality attributes, allowing for faster, high-throughput methods.
A comparison of the two data sets revealed similar information can be obtained using both methods. Although the laboratory-based MAM can determine a higher number of PQAs and with more specificity than the Protein A-MS multi-attribute monitoring approach presented here, Protein A-MS enables the generation of information that can be used to support optimization of the bioprocess and deployment as a process analytical platform for monitoring and control purposes. Online or at-line assays based on intact mass analysis are an ideal analytical solution when sample is limited or when rapid turnaround of the analytical result is needed. The current study reported an example of the amount and quality of information that can be generated along with the potential applications of intact mass native MS-based workflow to support biopharmaceutical production.
References
(1) K. Tsumoto, Y. Isozaki, H. Yagami, and M. Tomita, Immunotherapy 11(2), 119–127 (2019).
(2) A. Beck and H. Liu, Antibodies 8(1), 18 (2019).
(3) A. Trappe, F. Fussl, S. Carillo, I. Zaborowska, P. Meleady, and J. Bones, J. Chromatogr. B Analyt. Technol. Biomed. Life Sci. 1095, 166–176 (2018).
(4) J.P. Kunkel, D.C. Jan, J.C. Jamieson, and M. Butler, J. Biotechnol. 62(1), 55–71 (1998).
(5) C. Jakes, F. Fussl, I. Zaborowska, and J. Bones, Anal. Chem. 93(40), 13505–13512 (2021).
(6) L.A. Gibbons, C. Rafferty, K. Robinson, M. Abad, F. Maslanka, N. Le, J. Mo, et al, Biotechnol. Prog. e3223 (2021). https://doi.org/10.1002/btpr.3223
(7) J.M. West, H. Feroz, X. Xu, N. Puri, M. Holstein, S. Ghose, et al, Biotechnol. Bioeng. 118(6), 2293–2300 (2021).
(8) Z. Hao, B. Moore, C. Ren, M. Sadek, F. Macchi, L. Yang, J. Harris, et al, J. Pharm. Biomed. Anal. 205, 114330 (2021).
(9) C. Jakes, S. Millán-Martín, S. Carillo, K. Scheffler, I. Zaborowska, and J. Bones, J. Am. Soc. Mass Spectrom. 32(8), 1998–2012 (2021).
(10) Y. Liu, J. Fernandez, Z. Pu, H. Zhang, L. Cao, I. Aguilar, et al, J. Pharm. Sci. 109(11), 3319–3329 (2020).
(11) R.S. Rogers, N.S. Nightlinger, B. Livingston, P. Campbell, R. Bailey, and A. Balland, MAbs 7(5), 881–890 (2015).
Craig Jakes and Jonathan Bones (pictured) are with the National Institute for Bioprocessing Research and Training, Characterization and Comparability Laboratory, in Dublin, Ireland, and the School of Chemical Engineering at University College Dublin (UCD), in Dublin, Ireland. Sara Carillo and Silvia Millán Martín are with the National Institute for Bioprocessing Research and Training, Characterization and Comparability Laboratory, in Dublin, Ireland. Direct correspondence to: jonathan.bones@nibrt.ie.


Accelerating Monoclonal Antibody Quality Control: The Role of LC–MS in Upstream Bioprocessing
This study highlights the promising potential of LC–MS as a powerful tool for mAb quality control within the context of upstream processing.
Common Challenges in Nitrosamine Analysis: An LCGC International Peer Exchange
April 15th 2025A recent roundtable discussion featuring Aloka Srinivasan of Raaha, Mayank Bhanti of the United States Pharmacopeia (USP), and Amber Burch of Purisys discussed the challenges surrounding nitrosamine analysis in pharmaceuticals.

.png&w=3840&q=75)

.png&w=3840&q=75)


.png&w=3840&q=75)


.png&w=3840&q=75)


