Improving GC Performance Systematically
LCGC North America
Gas chromatographers can control several variables that affect their separations: carrier-gas flow, column temperature, column dimensions, and stationary phase chemistry. When faced with less than optimum resolution or separation speed, a strategy of changing just one variable at a time can be more productive than trying to hit the goal in one attempt. This month's GC Connections examines how to use such a plan to obtain better GC results.
Gas chromatographers can control several variables that affect their separations: carrier-gas flow, column dimensions, and stationary-phase chemistry. When faced with less than optimum resolution or separation speed, a strategy of changing just one variable at a time can be more productive than trying to hit the goal in one attempt. This month's "GC Connections" examines how to use such a plan to obtain better gas chromatography results.
The previous installment of “GC Connections” (1) discussed the effects of peak-detection choices on gas chromatography (GC) peak quantification. For situations with less than ideal peak resolution-where resolution (Rs) is less than 2.0, and especially when the peaks are of unequal size-it becomes easy to choose peak detection settings that may compromise peak size-measurement accuracy and repeatability. While proper peak detection will help remedy such a situation, sometimes no amount of data system tweaking will provide the desired improvements. In most cases it is better to increase peak resolution, thereby allowing the data system to perform as expected.
Peak resolution is the difference between the retention times (tR) of a pair of adjacent peaks, divided by their average widths at base (wb). In a practical sense, the peak width at half-height-which is 1.699 times smaller than the width at base-usually is employed for the calculation. If the two peaks’ widths are not too different then the width of the second peak can be substituted for the average width:

This classical resolution equation is predicated upon the assumption that the peaks are Gaussian, symmetrical, and equal in size. In that case, “baseline” resolution of 1.5 will occur when the amount of overlap between the two approaches about 0.15%. Any data handling system can easily measure such a pair accurately and repeatably. However, real-world peaks are non-Gaussian, asymmetrical, and often of significantly different sizes. Resolution as measured by equation 1 will exaggerate the quality of the separation. This approach can cause much greater inaccuracies and worse precision than expected for peaks that apparently measure as baseline-resolved. These effects were detailed in a previous “GC Connections” series (2–4). Overall, it is better to strive for higher as-measured resolution beyond the baseline level for a couple of reasons. First, the excess resolution will yield more-accurate and more-repeatable peak measurements and second, it will provide a bit of a buffer for eventual degradation of the separation as the column ages.
Taking Control
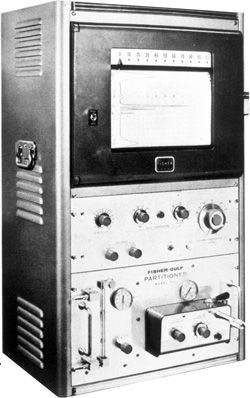
I remember using early gas chromatographs that had actual knobs for adjustment of the carrier-gas pressure, oven temperature, and detector electronics. Figure 1 shows a Fisher-Gulf Partitioner GC system from circa1955. This is the first kind of GC system that I was exposed to as an undergraduate in the 1970s. These days I no longer have as many GC knobs to adjust in my lab, really only the tank pressure regulators, but I still have a mental map between GC parameters on a computer screen and these first-generation commercial instruments. Turning a pressure controller knob and feeling its smooth rotational resistance is not the same as dragging an on-screen slider, but eventually an enterprising software developer will close the circle by creating a virtual reality GC control system with haptic feedback that appears something like Figure 1.
Figure 1 Fisher-Gulf Partitioner GC system circa. 1955. From the author's personal collection.
The virtual knobs that today’s gas chromatographer can use to manipulate peak resolution are the the oven temperature and the carrier-gas pressure, flow, or linear velocity. Adjustment of the other variables of carrier-gas type, column dimensions, and stationary phase chemistry goes beyond simple knob-twisting, so let’s start by looking at how peak resolution in a given separation can be controlled by the pressures and temperatures that are changed easily. Bear in mind that for meaningful results only one setting should be changed per measurement. Otherwise it may be difficult to know where the true optimum set of parameters lies.
Carrier Gas
The passage of carrier gas through a column sets the stage for the separation. No matter what type of column is used, an acceptable separation will require carrier gas settings inside of an optimum range. Too little carrier will cause the separation to miss out on much of the column’s available resolving power, while too much may force the peaks to be eluted before they can realize the full effect the column can have. There is a good deal of latitude for adjusting the overall speed of a separation while staying in the optimum zone.
Figure 2 shows a plot of column efficiency, the theoretical plate height for a specific peak, as a function of the average carrier-gas linear velocity. Like many that chromatographers encounter, this relationship is often cited, but highly theoretical and does not predict real-world behavior as accurately as might be believed. Observations depart from the theory as operational aspects depart from the assumptions made, which in this case amounts to ignoring some effects due to pressure drop through the column and some aspects of using thicker stationary films. These were addressed in some detail in a previous installment of “GC Connections” (5).
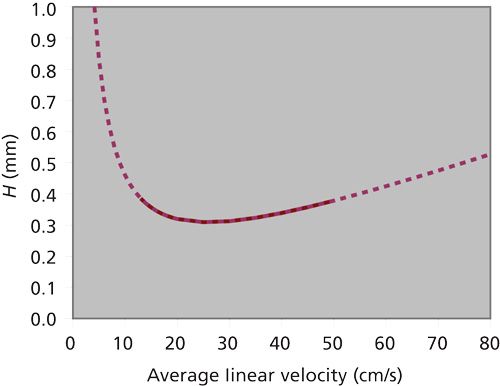
Figure 2: Column efficiency expressed by the height of a theoretical plate, as a function of average carrier-gas linear velocity. The solid section of the line represents a range of ±25% of the optimum efficiency. Theoretical data for helium carrier gas on a 50 m × 0.25 mm column at 100 °C with k = 10.0.
Here, it is important to realize that choosing a carrier-gas setpoint on the basis of theoretical curves may lead to less than optimum operation. Instead, it is better to measure and determine the actual performance trends for the separation at hand. Theoretical considerations provide a good starting point and can point out a direction in which to head, but they should be abandoned early in a quest for a better separation.
Changing to a different carrier gas, usually from helium to hydrogen, can extend the available range of exploration. In the case of hydrogen, the upper practical limit for the linear velocity is much higher than for helium and may offer some significant advantages. This topic has been discussed exhaustively (see reference 5 for example); the consensus now seems to be in favor of hydrogen if it is a practical and available option.
Optimize the carrier-gas settings in an existing separation by measuring the effects on the resolution of one or more critical peak pairs. Depending on the pneumatic operating mode, change the carrier-gas pressure, flow, or velocity up and down from the original values and construct a graph similar to Figure 3. This procedure can be a little time consuming, but the result is a well characterized separation. Different peak pairs may have different optimum carrier-gas settings as shown here, so a compromise is often needed. This also makes a case for creating some extra resolution to gain overhead in multi-peak optimization.
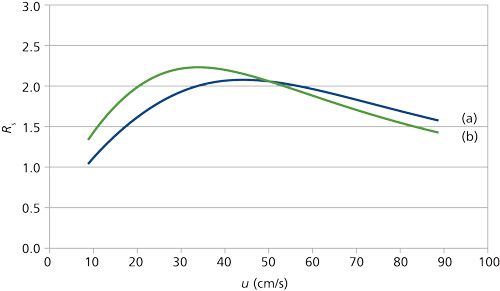
Figure 3: Resolution versus average carrier-gas linear velocity for two peak pairs. (a) n-Hexane and a closely eluted analog and (b) n-dodecane and a closely eluted analog. Separation factor for both pairs α = 1.03. Conditions: 25 m × 0.25 mm, 0.4-μm film thickness nonpolar stationary phase, 130 °C, helium carrier gas. From reference 5.
Often the carrier gas is already operating close to the optimum, so that there is little to be gained by adjusting it. In such cases it is better to modify the oven temperature and then revisit the carrier gas if better performance can be found. The carrier gas will influence resolution of each peak pair differently, depending on the column temperature settings. Keeping this secondary interaction under control by changing only the carrier or the oven settings for any one set of measurements is very important. Otherwise, obtaining an accurate picture upon which practical decisions can be based can be quite difficult.
Temperature
The column oven temperature may be isothermal, or it may consist of one or more ramps and isothermal periods. Simpler oven settings are desirable, with isothermal potentially being the best case for fastest run cycle times, but many sample mixtures and matrices cover a too-wide elution range to be practical in isothermal mode. GC oven technology is still advancing, and recent systems can heat and cool rapidly enough to realize significant gains in total run times.
Cooler initial temperatures followed by a programmed ramp also have significant advantages for splitless and on-column injection, so be sure that in changing the oven’s temperature settings the requirements for the sampling methodology are not violated. The relationships between these two are beyond this discussion but have been well characterized elsewhere.
The basic oven settings of temperature and ramp rate will influence peaks by shortening their retention times as the temperatures and rates increase. Unfortunately, not all peaks will be influenced to the same degree. The result may be that some peaks’ resolution will increase while others decrease. If large changes are made in a single step it is possible that the elution order of a peak pair may reverse, or that a coelution may occur. Thus, careful characterization by making small changes is best.
The apperception of these crossover situations is made easier by employing mass-selective detectors or lacking that, by characterizing separately the behavior of two or more groups of peaks that are sufficiently well separated to avoid crossovers. A hidden existing coelution may be revealed upon changing a temperature program, so an open and questioning attitude is well justified.
Sometimes a temperature program may be complex, with multiple ramps at different rates and interspersed hold times. These are the result of some directed optimization work, but there is no harm in undoing them and trying a simple program while working in concert with changes to the carrier-gas settings. Thoroughly exploring the temperature and carrier landscape while exercising restraint by changing only one value per experiment can be time consuming but may be worth the effort in improved robustness as better peak resolution and potentially improved speed of analysis are gained.
Finally, keep in mind that significant changes to a temperature program, especially when heading toward faster ramp rates, may require corresponding shifts in the carrier-gas settings. If the ramp rates are doubled or more, then seriously consider re-optimizing the carrier gas by confirming settings for the best overall resolution.
Column Dimensions
Sometimes the GC separation already is very close to optimum and there is not much to be gained by adjusting either the carrier gas or the oven settings. If more resolution is needed, then doubling the column length or reducing the inner diameter to the next smallest available one may produce the desired improvements.
When changing the inner diameter it is a good idea to change the stationary film thickness in equal proportion if possible. This will keep the ratio of the carrier gas volume to the stationary-phase volume-the phase ratio-constant so that the new separation can more closely match the old. Bear in mind that thinner stationary phase films have a reduced tolerance for larger solute concentrations before peak distortion occurs due to phase overloading. Smaller column diameters may need adjustments to split ratios, and concomitantly the injected solute concentrations as well, to avoid overloading and to prevent injected peak broadening.
Applying the existing thermal and pneumatic method parameters to a new column will not produce the same separation. Bridging the gap between existing and new conditions can be effectively assisted by using one of the available online method translation calculators (6). The calculated conditions for the new column will produce a separation that is similar to the original column, from which point further optimization can be initiated. The software is also handy for finding a solution to changing from helium to hydrogen carrier gas, as well as for estimating the effects of temperature ramp and flow changes. However, most models do not incorporate the crossover effects mentioned above, the exception being programs that include specific peak substance and stationary-phase identities. Again, careful measurement of the actual separations that result are required.
Stationary-Phase Chemistry
If all else fails its time to question the stationary-phase chemistry. In GC, the choices span a range of nonpolar to polar siloxanes, carbowax types, adsorption materials primarily for gases, and more recently ionic liquids. Sometimes the original choice of stationary phase was based on external constraints, such as what was available at the time the method was developed. Sometimes multiple sample types needed to be accommodated on a single column. Generally there will be more than a single phase that might produce an acceptable separation.
Choosing new stationary-phase chemistry is the last thing to try for optimization, but at the same time it is the first choice to be made when attempting a new separation. There is a good deal of guidance and suggestion available from the column producers as well as on a host of well-vetted methods published by standards groups such as U.S. Pharmacopeial Convention (USP) and the related international pharmacopeias, AOCS, the U.S. Environmental Protection Agency (EPA), and ASTM International, to name a few. Certainly such standardized methods provide an excellent jumping-off point for separation not only of the referenced materials but also of similar mixtures and substances.
When selecting a new phase, start with a best choice among what is available, then proceed through the above list of parameters in reverse order. First choose column dimensions that are most likely to produce the desired separation. This will usually be a longer, narrower-bore column that can be optimized later on after the solute behavior has been characterized. Next, using carrier gas conditions close to the theoretical optimum, choose a survey single-ramp temperature program from around 50 °C up to the column limit or until all peaks have been eluted, with a program rate somewhere between 5 and 15 °C/min. This separation will then inform additional developments such as choosing a shortened temperature range, faster temperature program ramp, and higher pressures, flows, or velocities. A couple of optimization cycles will go a long way toward finding a set of conditions that produces the desired resolution of critical peak pairs.
Conclusion
Optimizing an existing separation to provide a bit of extra resolution that improves measurement accuracy and precision can be as simple as tweaking pneumatic settings or as complex as having to select a different stationary phase and essentially start over. Modifying the oven conditions is a second route to travel, beyond changing the pneumatic conditions. Changing the column dimensions presents more flexibility for controlling resolution but is more difficult and time-consuming to achieve. Switching the stationary phase really is a last resort, although the decision to go there may become obvious after a few attempts at pneumatic and thermal modifications. And as I and many others have emphasized many times, change just one of these variables at a time or risk loosing your way in the parametric jungle of chromatographic separations.
References
- J.V. Hinshaw, LCGC North Am.35(1), 30–34 (2017).
- J.V. Hinshaw, LCGC North Am.28(7), 524–529 (2010).
- J.V. Hinshaw, LCGC North Am.28(10), 874–878 (2010).
- J.V. Hinshaw, LCGC North Am.28(11), 952–958 (2010).
- J.V. Hinshaw, LCGC North Am.26(11), 1100–1108 (2008).
- R.E. Majors and K. Lynam, LCGC North Am.29(7), 560–568 (2011).
John V. Hinshaw

“GC Connections”editor John V. Hinshaw is a Senior Scientist at Serveron Corporation in Beaverton, Oregon, and a member of LCGC’s editorial advisory board. Direct correspondence about this column to the author via e-mail: LCGCedit@ubm.com

Study Examines Impact of Zwitterionic Liquid Structures on Volatile Carboxylic Acid Separation in GC
March 28th 2025Iowa State University researchers evaluated imidazolium-based ZILs with sulfonate and triflimide anions to understand the influence of ZILs’ chemical structures on polar analyte separation.


