Statistics for Analysts Who Hate Statistics, Part V: Discriminant Analysis
LCGC North America
Part V of this series takes a closer look at discriminant analysis (DA). Discriminant analysis is a supervised method, meaning that it involves some previous knowledge of your samples.
Part V of this series takes a closer look at discriminant analysis (DA). Discriminant analysis is a supervised method, meaning that it involves some previous knowledge of your samples.
Contrary to principal component analysis (PCA) and clustering methods that we have discussed in the previous parts of this article series, discriminant analysis (DA) is a supervised method, meaning that it involves some previous knowledge of your samples. Your samples (observations) should be initially classified into classes (not involving any form of rank) and should be described by identical variables. While cluster analysis will classify your observations in an independent fashion, only based on the input data you will supply, discriminant analysis will use the classes you will indicate (based on some initial knowledge or assumptions on your observations). For instance, suppose you want to discriminate between cocoa beans (observations) of different geographical origins (classes), based on their molecular composition (variables). Furthermore, cluster analysis provides no explanation as to why the samples should be clustered in the same or different groups. On the other hand, the purpose of discriminant analysis is precisely to define the features that are common to the observations in one class. For example, in the case of cocoa beans of different origins, you may observe that all samples originating from South America area have a higher concentration in one type of molecules than cocoa beans originating from Asia, while other molecule’s concentration will differ very little between samples.
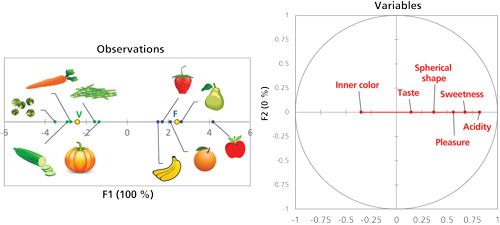
Let us start with a comparison of two classes of food: fruits and vegetables. For the purpose of demonstration, I have chosen five fruits and five vegetables and asked a “testing panel” about their feelings on the strength of taste, sweetness, acidity, perception of inner color, round shape, and the general pleasantness provided by their consumption. For each criterion, I asked my panel to rank fruits and vegetables on a scale of 0 to 10. This process yielded Table I. If we apply a discriminant analysis to Table I, we will obtain Figure 1. Because there are only two classes in this example, only one axis is sufficient to represent the variables and observations (F1 represents 100% variance while F2 represents no variance). What DA does is to show you the features that are common to the samples in each class. In the discrimination of fruits and vegetables, you can see that the fruit group has all the most interesting features of sweetness, acidity, and pleasantness. The strength of taste is close to zero value thus is probably not discriminating between the two groups.
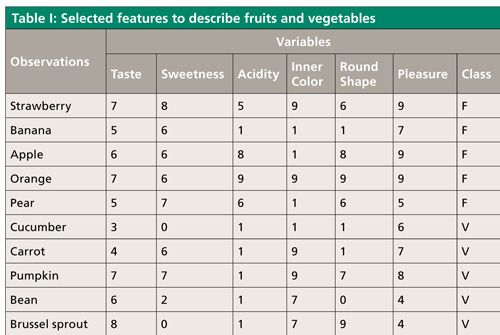
Figure 1: Discriminant analysis of fruits and vegetables, based on Table I.
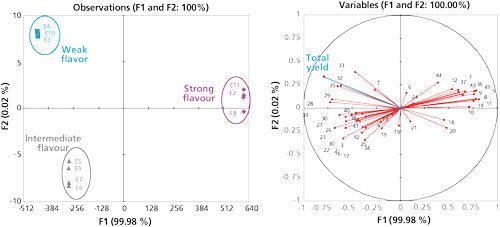
Let us apply DA to a chromatography problem. This one is taken from a study I participated in some years ago (1). Brazilian cherries were extracted with supercritical fluid extraction in varied operating conditions (pressure, temperature). The extracts obtained were submitted to a trained panel for evaluation of the flavor intensity, and analyzed via gas chromatography–mass spectrometry (GC–MS). Three levels of flavor intensity appeared, and were used as classes for a DA analysis based on peak areas of identified compounds in the GC–MS chromatograms. When three classes are present, two axes (F1 and F2) will represent 100% variance, thus the image obtained in Figure 2 represents all information available. In other words, there is no loss of information related to the data processing. Note that, with more classes (more than three), the proportion of information represented on a single figure decreases, meaning that some part of the information present in the sample set is not clearly represented with a two-dimensional plot (2). Identifying the analytes pointing to the same direction as the class with the strongest flavor will thus help identifying the analytes causing that characteristic flavor. Analytes pointing to the other side of the figure may contribute to improved extraction yields but do not participate in strong flavor (like waxes, for instance).
Figure 2: Discriminant analysis of brazilian cherry extracts, based on peak areas measured by GC–MS (5).
DA is thus an interesting method to define common features among sample classes. I rarely see it employed by chromatographers, but this discussion should have shown you that it certainly deserved some attention.
In the next lesson, we will learn about desirability functions.
References
- F.S. Malaman et al., Food Chem.124, 85–92 (2011).
- I. Ten-Doménech et al., J. Agric. Food Chem.63, 5761–5770 (2015).
Caroline West is an assistant professor at the University of Orléans, in Orléans, France. Direct correspondence to: caroline.west@univ-orleans.fr.

How Many Repetitions Do I Need? Caught Between Sound Statistics and Chromatographic Practice
April 7th 2025In chromatographic analysis, the number of repeated measurements is often limited due to time, cost, and sample availability constraints. It is therefore not uncommon for chromatographers to do a single measurement.
Fundamentals of Benchtop GC–MS Data Analysis and Terminology
April 5th 2025In this installment, we will review the fundamental terminology and data analysis principles in benchtop GC–MS. We will compare the three modes of analysis—full scan, extracted ion chromatograms, and selected ion monitoring—and see how each is used for quantitative and quantitative analysis.
Rethinking Chromatography Workflows with AI and Machine Learning
April 1st 2025Interest in applying artificial intelligence (AI) and machine learning (ML) to chromatography is greater than ever. In this article, we discuss data-related barriers to accomplishing this goal and how rethinking chromatography data systems can overcome them.


