Count the Cost, Part I: Increasing Resolution by Increasing Column Efficiency
LCGC North America
When considering column efficiency, more is not always better. We look at some ways to quickly estimate the effects of changes in column length and particle diameter rather than trying the experiments in the laboratory.
When considering column efficiency, more is not always better. We look at some ways to quickly estimate the effects of changes in column length and particle diameter rather than trying the experiments in the laboratory.
Those of you who have been reading “LC Troubleshooting” for several years will have realized that I am strongly in favor of avoiding work. Call me lazy . . . , or perhaps just efficient? That is, I don’t believe it is a very good use of my time to perform physical experiments when a mental experiment will yield the same, or approximately the same, result with less time, effort, and cost. As such, I often begin my discussion of solving a liquid chromatography (LC) problem with a review of the mental processes that I go through. This is not a new concept, by any means. The Bible includes a 2000-year-old quote from Jesus, “suppose one of you wants to build a tower. Won’t you first sit down and estimate the cost to see if you have enough money to complete it?” (1). Although Jesus was talking about spiritual matters, it makes good sense (pun intended) to evaluate the cost and likelihood of success before undertaking chromatography experiments, too.
For the next few installments of “LC Troubleshooting,” I will be considering some of the choices we make when developing or modifying an LC method. Which are the good choices, and which aren’t so good? What will a particular choice cost in terms of time, finances, or likelihood of solving the separation problem? I will try to help answer these, and other questions, without doing actual laboratory experiments by using information available to us all.
The Resolution Equation-A Practical Guide
The separation of two peaks in a chromatogram, which we refer to as resolution, is one of the most important factors when developing a separation. Often resolution, Rs, is expressed in what is commonly referred to as the fundamental resolution equation:

where N is the column plate number (or column efficiency), k is the retention factor, and α is the selectivity:

where k1 and k2 are the k-values for two adjacent peaks.
Equation 1 is an extremely powerful tool to help guide method development. It is used as one of the organizing features of the classic, Practical HPLC Method Development book by Snyder, Kirkland, and Glajch (2). In our contract laboratory we found that its use as a guide for quickly developing LC methods saved us time and money. It has formed the foundation of LC Resources’ popular Advanced LC Method Development class for more than 30 years. So it is not surprising that this equation is one of my go-to tools when considering challenges associated with LC separation methods.
You’ll notice that I’ve divided equation 1 into three pieces. Factor i has to do with what I often refer to as the column conditions: length, particle size, and flow rate. Factor ii relates primarily to the chemistry of the system: column chemistry, mobile phase chemistry, and temperature. The final factor (iii) has to do with retention, and is influenced primarily by the mobile phase strength and the column temperature. Over the next few installments of “LC Troubleshooting,” we’ll look at each of these factors in detail and see how some mental experiments can help us to count the cost of investing time and resources in a particular variable with a goal of increasing resolution.
The (Lack of) Power of N
For the rest of this month’s discussion, let’s focus on term i of equation 1, and for simplicity, we’ll focus on isocratic separations. If we hold all other variables constant except the plate number, resolution is a function of the square root of the column plate number:

With a large emphasis today on ultrahigh-pressure LC (UHPLC) and superficially porous particles (SPP), it is easy to get the impression that we can solve all our separation problems by going to a sub-2-µm particle UHPLC column or an SPP column with similar performance. Unfortunately, this is not true, either in theory or practice. This is information easily obtained from equation 1 or 3.
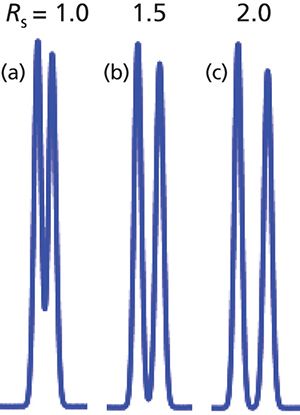
Consider the partial chromatograms of Figure 1. During method development, we would not be discouraged if we were able to obtain the separation of Figure 1a during the process. The separation is not satisfactory for many applications, but it does show promise. Usually we would like to obtain a separation like the one in Figure 1c, where the peaks are separated to baseline with a small bit of baseline between the two peaks. Figure 1c has Rs = 2.0, which is the target for the minimum resolution for most methods that fall under regulatory oversight. Getting from Figure 1a (Rs = 1.0) to Figure 1c shouldn’t be too hard-just increase the plate number, right? Wrong! According to equation 3, to double the resolution, we would have to increase the plate number by fourfold (40.5 = 2). How are we going to do that? Perhaps we might be tempted by the Siren of UHPLC-smaller particles.
Figure 1: Simulated chromatograms showing resolution of (a) 1.0, (b) 1.5, and (c) 2.0.

The relationship between N and the particle size, dp, is

where c is a constant, assuming only column length, L, and dp are changed. In other words, to increase N fourfold, we would have to reduce dp fourfold. If we were using the most popular column configuration, a 150 mm × 4.6 mm, 5-µm dp column, it would mean switching to a 150 mm × 4.6 mm, 1.25-µm column. This presents two additional problems. First, no one that I know of makes columns packed with 1.25-µm particles. And if they did, the pressure would surely be quite high. We can estimate the column pressure, because we know that the change in column pressure is related to the square of the change in particle diameter:

where dp1 and dp2 are the diameters of the original and new particles, respectively. If I were running a conventional LC system with the 150 mm × 4.6 mm, 5-µm column, I might be seeing 150–200 bar of column back pressure. A fourfold reduction in particle size would mean a 16-fold increase in column pressure, to pressures of more than twice the pressure limits of any of the currently available UHPLC systems. Clearly, a change in particle size alone will not allow us to double resolution for the example of Figure 1a.
An alternative might be to increase the column length. According to equation 4, the plate number increases in proportion with an increase of column length. To increase N fourfold, we would have to increase L fourfold. That is, connect four columns in series. This could be done, but it is not very practical. The first challenge might be to get your supervisor to sign off on a purchase order to buy four columns for this purpose! If you did connect four columns in series, the pressure would increase fourfold, as well, likely exceeding the pressure limits of the LC system you are using. It would also increase the run time fourfold, something that is not very compatible with the goal that most of us have to have a fast separation. To reduce the pressure to some acceptable pressure increase-for example, double-we would have to reduce the flow rate by an equal amount, further doubling the run time to eightfold. So attempting to double resolution by changing column length is not a fruitful approach, either.
At this point, you might be wondering if there is ever any advantage to changing the column length or packing particle size to improve resolution. Yes, either of these approaches can be practical ways to marginally improve separations. Although changing N by a factor of four is not very practical, doubling N is quite doable. For example, if you had a separation like the one of Figure 1b (Rs = 1.5), you could switch from a 150 mm × 4.6 mm, 5-µm dp column to a 250 × 4.6 mm, 5-µm column. This change would increase N by 250/150 = 1.7-fold, giving a separation with Rs ≈ 2.5. The price you’d pay would be an increase in both pressure and run time by the same 1.7-fold. Alternatively, you could change from the 150 mm × 4.6 mm, 5-µm column to a 150 mm × 4.6 mm, 3-µm column. This would give the same increase in N (5/3 = 1.7-fold) for Rs ≈ 2.5 with no penalty in run time, but a 1.72 = 2.8-fold increase in pressure, which may or may not be acceptable. If you were working with a 100 mm × 4.6 mm, 3-µm column and changed to UHPLC conditions with a 100 mm × 4.6 mm, 1.7-µm column, you should observe a 3/1.7 = 1.8-fold increase in resolution to Rs ≈ 2.6 and an increase in pressure by (3/1.7)2 = 3.1-fold, which should not be a problem with a UHPLC instrument. (I must repeat my standard caution here: If you try to replicate my calculations, please be aware that I have often rounded the numbers for ease of presentation.)
And what about flow rate? For particles 5 µm in diameter and real samples, there is not a significant change in N or Rs with a twofold change in flow rate. As the particle size is reduced below 5 µm, the effect of flow diminishes. This means that for most separations, the main effect of a change in flow rate is a change in retention times and column pressure, but not a significant change in the resolution.
All this is to say that a few simple calculations show us that it is not reasonable to expect that we can double resolution by changing the primary factors that influence the column plate number: column length and packing particle diameter. However, it may be possible to improve a marginal resolution by 1.7-fold or so by changing to the next longer column or next smaller particle size available. In this case, the practical penalty is a longer run time or higher pressure, or both.
Where to Start?
Another bit of useful information can be obtained with estimates from the above equations-this information is related to our initial choice of columns during method development. For reasons I won’t go into here (see references 3 and 4 for more details), a column with N ≈ 9000&endash;10,000 should separate a sample of 10–15 components without too much trouble. Of course, every sample differs, but if we use this plate number as a reasonable starting place, we can evaluate our options. Remember that whatever the plate number is for the column you choose, you can easily calculate the effect of increasing or decreasing N using the process discussed above.
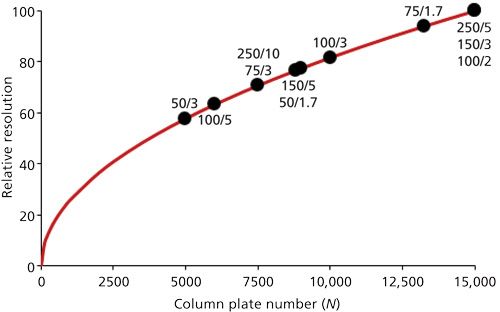
To help visualize the tradeoffs between resolution and column plate number, I’ve plotted data generated from equation 3 in Figure 2, where the column plate number is shown on the x-axis and relative resolution (normalized to 100) on the y-axis. Although well-packed columns operated under ideal conditions with well-behaved samples should produce reduced plate heights of two particle diameters, it is more conservative to use a value of three particle diameters for real samples under real operating conditions. If this is assumed, we can then estimate the column plate number from the column length (in millimeters) and the particle diameter (in micrometers) as follows:

Figure 2: Plot of relative resolution versus column plate number based on data generated with equation 3. Black dots note some popular column configurations, with the columns noted as (column length, mm)/(particle diameter, µm) assuming reduced plate heights of ~3 dp.

Based on values obtained from equation 6, I’ve shown where several popular columns fall on the curve of Figure 2 (black dots). The column diameter does not influence the plate number (assuming appropriate injection techniques, minimal extra column band broadening, and adjustment of flow rate to keep the linear velocity of the mobile phase constant), so only L and dp are shown (as L/dp) in Figure 2. I have also arbitrarily stopped plotting data at N = 15,000, which corresponds to the 250 mm and 5 µm, 150 mm and 3 µm, or 100 mm and 1.7–2 µm columns. Combinations of smaller particles and longer columns than these are not very practical for routine use on today’s instrumentation when pressure and run time are considered.
Considering the earlier statement that a column with N ≈ 9000&endash;10,000 is a good place to start with many samples, we can understand some of the reasons that the 150 mm × 4.6 mm, 5-µm dp column, and more recently, its 100 mm × 4.6 mm, 3-µm dp counterpart, is so popular. These columns generate the desired plate number and can be operated with conventional LC equipment at flow rates of 1.5–2.0 for reasonably short run times and acceptable pressures. These columns also give about 80% of the maximum resolution relative to the 15,000-plate columns, so there is not much to gain from going to a higher-plate number column considering the run time and pressure tradeoffs.
Figure 2 also helps us understand why the 50 mm × 2.1 mm, 3-µm dp column is so popular for LC–mass spectrometry or LC-tandem mass spectrometry (LC–MS or LC–MS/MS). Although the plate number (N ≈ 5000) is half of the 150 mm and 5 µm or 100 mm and 3 µm column, the resolution is reduced by only 30% or so. The added selectivity of the MS or MS/MS detector more than makes up for this potential loss in resolution, and the shorter run times make for more cost-effective use of these expensive detectors.
Summary
As we’ve “counted the cost” of the column plate number, we’ve seen that practical changes in N (for example, two-fold) tend not to have large influences on the resolution of two peaks. This is because resolution is influenced only by the square root of the plate number. We also saw that a column generating approximately 9000–10,000 plates is a reasonable starting place for samples of 10–15 components. These columns have a high chance of success, give relatively fast separations, and generate reasonable pressures. This confirms practical experience by helping to explain why the 150 mm × 4.6 mm, 5-µm dp column is so popular. So a good starting point for conventional LC systems is a 150 mm × 4.6 mm, 5-µm column or a 100 mm × 4.6 mm, 3-µm one. For UHPLC, 50–100 mm × 2.1 mm columns packed with 1.7–2.0 µm particles make the most sense in many cases. We did not consider superficially porous particle columns, but 2.5–2.7 µm SPP particle columns have been demonstrated to generate plate numbers similar to 2-µm columns packed with totally porous particles (TPP). However, 2.5–2.7 µm SPP columns have back pressures more typical of 3-µm dp columns, so can be operated on conventional or UHPLC equipment for fast and efficient separations.
As we’ll see in future installments, it is best to pick a column has sufficient separation power (N) to separate the complexity of sample you have, then concentrate on optimizing retention and selectivity before making further adjustments in column length or particle size, because the effect of these latter changes can be accurately calculated without additional experimentation.
References
- The Holy Bible, New International Version (Zondervan, Grand Rapids, Michigan, 1995), Luke 14:28.
- L.R. Snyder, J.J. Kirkland, and J.L. Glajch, Practical HPLC Method Development, 2nd edition (J. Wiley & Sons, Hoboken, New Jersey, 1997).
- L.R. Snyder, J.J. Kirkland, and J.W. Dolan, Introduction to Modern Liquid Chromatography, 3rd edition (J. Wiley & Sons, Hoboken, New Jersey, 2010), pp. 76–77.
- J.W. Dolan, L.R. Snyder, N.M. Djordjevic, D.W. Hill, and T.J. Waeghe, J. Chromatogr. A857, 1–20 (1999).
John W. Dolan

“LC Troubleshooting” Editor John Dolan has been writing “LC Troubleshooting” for LCGC for more than 30 years. One of the industry’s most respected professionals, John is currently a principal instructor for LC Resources in McMinnville, Oregon. He is also a member of LCGC’s editorial advisory board. Direct correspondence about this column via e-mail to LCGCedit@ubm.com

Polysorbate Quantification and Degradation Analysis via LC and Charged Aerosol Detection
April 9th 2025Scientists from ThermoFisher Scientific published a review article in the Journal of Chromatography A that provided an overview of HPLC analysis using charged aerosol detection can help with polysorbate quantification.
Removing Double-Stranded RNA Impurities Using Chromatography
April 8th 2025Researchers from Agency for Science, Technology and Research in Singapore recently published a review article exploring how chromatography can be used to remove double-stranded RNA impurities during mRNA therapeutics production.


