HPLC Column Technology 2008 — Back to the Future?
Based upon early theoretical predictions of thought leaders in the beginnings of high performance liquid chromatography (HPLC), the continuous evolution of a reduction of particle sizes in HPLC column technology along with improvements in instrumentation has led to the increased use of particles in the sub-2-mm range, which places certain constraints on operating conditions. In this article, Gerard Rozing puts theory and practice into perspective when using small particles at increased operating pressure and, in particular, looks at thermal effects that can affect overall performance.
Based upon early theoretical predictions of thought leaders in the beginnings of high performance liquid chromatography (HPLC), the continuous evolution of a reduction of particle sizes in HPLC column technology along with improvements in instrumentation has led to the increased use of particles in the sub-2-mm range, which places certain constraints on operating conditions. In this article, Gerard Rozing puts theory and practice into perspective when using small particles at increased operating pressure and, in particular, looks at thermal effects that can affect overall performance.
In the previous special issue on liquid chromatography (LC) column technology in LCGC(1), this author argued that a world of fine, very small dimension separation columns were looming on the horizon and it would be only a matter of time until these columns were finding broad application in routine method development and research applications. Though this trend certainly has not come to a halt, today the field has become overwhelmed with conventional high performance liquid chromatography (HPLC) column technology with very small particles in the separation bed. Now this trend to packed smaller particle columns by itself is not really new, but rather a continuation of the reduction in the average particle sizes of columns that has occurred over the last several decades. However, the improvement of HPLC separations with very small particles is real enough to call it a current trend. In this installment of LCGC's special issue on LC column technology, the author will illustrate that these improvements were predicted and match the theory of HPLC optimization, developed more than 35 years ago. The main attributes of this progress have been the availability of very small, mechanically stable particles that can be packed efficiently into high-pressure HPLC columns, along with simultaneous progress in HPLC instrumentation technology allowing operation at pressures as high as 1000 bar. Nevertheless, there are compromises in the methodology that sometimes go unnoticed. In this contribution, I will highlight some of these nuances and eliminate some of the myths surrounding HPLC at ultrahigh pressure.
The Need for High Speed and High Resolution of HPLC-Based Assays
Today, analytical laboratories in pharmaceutical and other industries are facing demanding regulations regarding the validity of analysis results. For example, in the pharmaceutical industry, to comply with regulatory requirements in a typical workflow for the analysis of a drug candidate, a system validation test (six injections) must be executed, a triplicate must be done on the standard, and three blanks and one control must be executed. So for this one sample, 14 injection–separations were executed in total. The reduction of analysis time of each assay, while maintaining resolution, certainly will be very beneficial.
Likewise, when new drug candidates are screened in metabolic studies, investigators initially do not know how many metabolites they must deal with in a particular sample. A shoulder or some tailing on a large peak might turn out to be an important metabolite that could be separated only in a higher resolution HPLC separation. So having the highest possible plate number to begin with, without waiting excessively long times to get the assay done, is of great importance.
Some General Considerations on High-Speed, High-Resolution HPLC
In an HPLC assay, a typical workflow will be comprised of sample preparation, sample handling and injection, chromatographic separation and detection, data processing, evaluation, reporting, and archiving. Time-optimization of individual steps must be an integral process applied to all the steps. In a regulated environment though, improving or optimizing of an existing HPLC method must come with minimal effort regarding establishing new operational qualification and performance verification procedures. Also, in speeding up an HPLC assay, the practitioner in the pharmaceutical laboratory must not compromise method robustness, method ruggedness, and ease of use in favor of a faster assay.
On the other hand, it must be kept in mind that in principal two independent tracks can be pursued to optimize or speed up an HPLC separation (Figure 1). On the one hand, one can optimize the kinetics of the separation. As will be shown later, in this case, one is dealing with physical parameters of the HPLC column such as particle size, pore size, morphology of the particles, the length and diameter of the column, the solvent velocity, and the temperature. The aim of this part of the optimization will be to get the highest plate number in the shortest possible time.
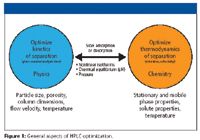
Figure 1
On the other hand, one can deal with the thermodynamics of a separation. Properties of the solute and the stationary and mobile phase (percentage of organic solvent, ion strength, and pH) are manipulated to get the shortest possible retention and highest selectivity. In this case, chemical equilibria are involved that by themselves are influenced strongly by the temperature, another parameter to be optimized.
In practice, it is unfortunate that these two tracks for optimization are strongly interdependent. For example, chemical equilibria can be slow compared with the kinetics of mass transport in the column and can cause a substance to be eluted as two interchanging species, causing brand spreading. The solute molecules can have strong and slow interaction with the stationary phase, degrading the fast kinetics of mass transport. These issues, in practice, complicate attempts to optimize a separation regarding speed of analysis and resolution.
Bearing all of this in mind, the focus here will be on discussing optimizing speed of separation and maintaining highest resolution.
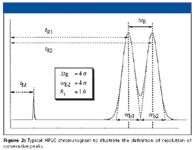
Figure 2
The Path to High-Speed, High-Resolution HPLC Separations
The well known equation for resolution (Rs) is given in equations 1 and 1a and is supported by Figure 2:

which can be reformulated as

where N is column plate number, α is selectivity for two adjacent peaks, and k9 is the capacity ratio for the second peak.
From inspecting the individual terms of equations 1 and 1a, it can be deduced easily, that the selectivity term, α has the largest impact on resolution. The influence of capacity ratio on resolution flattens above k9=5. Optimization of resolution by manipulation of selectivity is a simple exercise as long as there are only few components involved in the separation. But when a larger or unknown number of substances are present in the sample, improving separation of one pair of solutes can compromise other pairs. Here is where extensive retention modeling of all the solutes becomes important or method optimization programs can help out, often a long and tedious process.
So the most straightforward method to improve resolution is to improve the plate number N despite the square root dependence. The dependence of N is shown in equation 2 in which L is the length of the column and H stands for the height equivalent of a theoretical plate (HETP):

In essence, the previous paragraph reflects the fundamental question facing HPLC from the beginning — how to achieve the highest resolution in the shortest time within the practical constraints of maximum separation time and pressure given. This question has been dealt with by the "fathers of HPLC," Knox (2) and Guiochon (3) greater than 35 years ago. In 1997, Poppe readdressed this question leading into his kinetic plots, known as "Poppe" plots (4). Desmet and colleagues (5) took Poppe's approach further and recently reported a fresh view with his kinetic plots.
The dependence of the plate height on the kinetic parameters, solvent velocity (u0), and particle size (dp) is given by the simplified van Deemter equation:

Equation 3 illustrates that the HETP value indeed decreases with reduction in particle size. A calculated van Deemter curve is given in Figure 3.
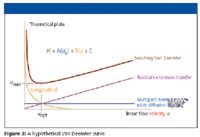
Figure 3
An important characteristic for this curve is the minimum at which efficiency is the best (uopt).
At the solvent velocity at which the minimum is reached, optimal velocity is inversely proportional with the particle size. In essence, reducing the particle size by a factor of 2 improves the column plate number a by a factor of 2 at a twofold higher optimal velocity. A further characteristic of the van Deemter plot is the decrease of the slope of the ascending branch of the curve. Thus, at velocities higher than the optimal velocity, the decrease in plate number with increase of the solvent velocity will be less for columns with smaller particles.
The flow resistance of an HPLC column is described by equation 5:
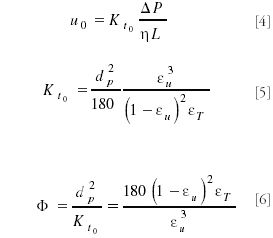
in which Kt0 is the chromatographic permeability based upon the mobile phase or solvent velocity u0. Via an adaptation of the empirical Kozeny–Carman relation, the particle size of the column is related to the chromatographic permeability that is conveniently normalized for the particle size to the well-known column resistance factor. For typical values of the interparticle porosity εu and the total porosity εT, the typical value of 700–800 is found for HPLC columns
The dilemma now emerges completely. As argued previously, reduction of particle size reduces the plate height and mandates an increase of the optimal velocity. Because the pressure drop increases with the square of the particle size, the overall pressure will increase with the cubic power of the particle size when a column is run at its optimal velocity.
In their groundbreaking 1969 paper, Knox and Saleem (2) dealt with this dilemma and illustrated that with a maximum given pressure, the particle size has to increase for achieving the required plate number the fastest. This phenomenon was most prominent for very large plate numbers (>100,000). An increase in the maximum pressure limit had a dramatic impact as well. For example, raising the maximum pressure from 200 to 1000 bar reduced the time to achieve 100,000 plates by a factor of 5 because the particle size and column length each could be reduced by a factor of 2.
However, the limitation of the Knox and Saleem (K–S) approach is that it is impractical to have particle size and column length as continuously varying parameters. HPLC columns come with fixed particle sizes and are manufactured in fixed lengths. This practicality was addressed by Poppe (4) in his 1997 paper.
In this paper, Poppe introduced the term "plate time," which is the time to generate one theoretical plate. He derived that the plate time is described by following relation:

In equations 7 and 8, Nr is the plate number required for a particular separation, and h is the reduced plate height.
The plots precisely illustrate the influence of increasing the maximum pressure available. For example, it can be seen in the top diagram in Figure 4 that if one needs 50,000 plates to achieve a separation, at 400 bar maximum pressure (the maximum operating pressure of many installed liquid chromatographs), a column with 3-μm particles will have a lower plate time than a column with 2-μm particles. Were 100,000 plates required, a column with 5-μm particles would have the lowest plate time. All points in the area right of the diagonal, which is the Knox–Saleem limit, are above the pressure limit and, thus, the forbidden zone, as described by Poppe. Changing the maximum pressure limit to 1000 bar, the K–S limit shifts to the right. Again, inspecting the point for 50,000 plates in this case, the plate time for the column with 2-μm particles now is the lowest.
It is interesting to see that increasing the permeability of the column while maintaining the average diffusion distance in the monolith (bottom portion of Figure 4) has the same effect. This is accounted for in the calculation by halving the column resistance factor. The K–S limit also shifts to the right and the space in the forbidden zone becomes accessible. Tanaka (6) has shown these theoretical predictions can be verified experimentally for monolithic columns.

Figure 4
In essence, raising the pressure limit on an HPLC system is a pathway to achieve a required number of plates in a shorter time, particularly when the required plate number is 50,000 or less. But this requirement applies to most HPLC-based assays in research, routine analysis, and quality control.
These theoretical considerations though need to be supported by very practical data obtained with an HPLC system at pressures as high as 1000 bar. Such systems now are available from several manufacturers. Although the mechanical and hydraulic engineering aspects have been demonstrated with these high-pressure systems, the hydraulic stress on the system (including column packings, column hardware, pump seals, check valves, injector rotors and stators, and other such consumable devices), and phase systems must be addressed as well.
Influence of Ultrahigh Pressure on Phase Systems, Solutes, and Columns in Liquid Chromatography: Some Thermal Considerations
It must be realized that in applying ultrahigh pressure to an HPLC system may have some unexpected consequences. In a monumental paper, Martin and Guiochon (7) have revealed in much detail how raising the maximum pressure in HPLC affects the physical, chemical, and mechanical properties of the column chromatography.
The following parameters are noticeably affected:
- Density (r), melting point, specific volume, and viscosity (h) of the solvent
- Retention factors (k) and hold-up time
- Diffusion coefficients (Dm)
- Porosity of the packed bed (e)
- Temperature gradients (longitudinal, ΔTL, and radial, ΔTR)
- Column efficiency (N)
- Column length and diameter (L and dc )
I will now discuss one aspect of going to ultrahigh pressures: the frictional heat generated in very small particle columns. It is well established that at P/L values over 50 bar/cm, a significant amount of heat is generated. The heat generated will create a temperature gradient along the axis of the column and across the column in radial direction. The axial temperature gradient, when homogenously distributed over the column cross-section will have no detrimental effect. This gradient is, to some extent, comparable to having a solvent gradient transverse the column. Solutes will accelerate towards the exit of the column.
Still, the heat generated will not be insignificant and is given by equation 9 (8):

where P is the power generally expressed in milliwatts (mW). For example, for a column 50 mm × 2.1 mm, packed with 1.7-μm BEH C18 and tested at 1 mL/min water, a pressure of 820 bar was obtained, which theoretically leads to a temperature difference between inlet and outlet of the column of 23 °C (in the actual experiment, a temperature difference of 10 °C was measured, which was accounted to uncontrolled loss of heat) (9).
In contrast, it can be easily envisioned that a radial temperature gradient would be detrimental to separation. Assuming an infinitely fast heat exchange to the outside of the column tube (well thermostated), a radial temperature gradient will be established. Consequently, the temperature in the center of the column will differ from the temperature at the column wall. Therefore, physical properties of solvent and solute will differ between the center and the wall and band broadening will occur.
The magnitude of the temperature difference between the center of the column and the wall has been described by many others and is given in equation 10:

The temperature gradient that develops depends upon the superficial velocity us, the pressure drop, and the column radius squared. It is inversely proportional to the heat thermal conductivity (λrad) of the column bed in radial direction.
Colon has proposed a practical guideline of 280 mW as the maximum power generated by frictional heating in a 150 mm × 4.6 mm column with 3-μm particles and a flow rate of 1 mL/min water. Taking this as a given, the radial temperature gradient that is calculated for water as the solvent amounts to 0.4 °C, which is probably not a concern in practice.
Colon (8), however, clearly showed that in reducing the particle size, which increases the pressure drop with the square of the radius (and assuming that the superficial velocity is kept constant), the column diameter must be reduced to stay below the arbitrary 280 mW (Figure 5). The curves in the graph clearly show that the column internal diameter must be reduced to stay below the limit. It must be kept in mind that this calculation was done for a solvent velocity of 1 mm/s. Increasing the velocity, as is used in high-speed HPLC, will exceed this limit easily.
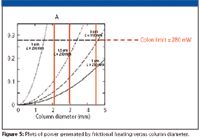
Figure 5
UHPLC: Back Into the Future?
The current excitement about using very small particles in HPLC is not much different from the excitement in the late sixties and early seventies when HPLC technology emerged. Knox, Guiochon, and others already predicted limits to the technology at that time. However, progress in instrument engineering and HPLC particle design and manufacturing took over 40 years to turn theory into practice. This progress was synchronous with the slow change in requirements of the majority of HPLC users, who tend to be relatively conservative community.
Analysis time reduction comes at a price. Existing HPLC theory provides guidance in determining the best column in terms of kinetic performance. Kinetic plots as proposed by Poppe and expanded by Desmet and colleagues are practical tools for that purpose. But in practice, method robustness, longevity of columns, and instrumentation [in short, reliability of ultrahigh-pressure LC (UHPLC) systems] might be more problematic. Massive gains in performance, time, and cost can drive users into the revalidation effort needed to switch to UHPLC. However, the practical user should balance this effort of switching to the overall requirements for his method.
Theory needs some adaptation to the new extremes in pressure. On the other hand, a morphology change in packings, so-called "fused core" or superficially porous particles, might provide a solution to the problem of frictional heat generation.
References
(1) G. Rozing, LCGC, Special Supplement "Recent Developments in LC Column Technology," 12–16 (June, 2004).
(2) J.H. Knox and M. Saleem, J. Chromatogr. Sci. 7, 614 (1969).
(3) G. Guiochon, Anal. Chem. 52, 2002 (1980).
(4) H. Poppe, J. Chromatogr., A 778, 3 (1997).
(5) G. Desmet, P. Gzil, and D. Clicq, LCGC Eur. 18(7), 403–405 (2005).
(6) N. Tanaka et al., J. Chromatogr., A 965, 35–49 (2002).
(7) M. Martin and G. Guiochon, J.Chrom. A 1090, 16, (2005).
(8) L.A. Colón et al., Analyst 129, 503 (2004).
(9) A. de Villiers, H.H. Lauer, R. Szucs, S. Goodall, and P. Sandra, J. Chrom. A., (accepted for publication).

Altering Capillary Gas Chromatography Systems Using Silicon Pneumatic Microvalves
May 5th 2025Many multi-column gas chromatography systems use two-position multi-port switching valves, which can suffer from delays in valve switching. Shimadzu researchers aimed to create a new sampling and switching module for these systems.
Studying Cyclodextrins with UHPLC-MS/MS
May 5th 2025Saba Aslani from the University of Texas at Arlington spoke to LCGC International about a collaborative project with Northwestern University, the University of Hong Kong, and BioTools, Inc., investigating mirror-image cyclodextrins using ultra-high performance liquid chromatography–tandem mass spectrometry (UHPLC–MS/MS) and vibrational circular dichroism (VCD).

.png&w=3840&q=75)

.png&w=3840&q=75)


.png&w=3840&q=75)


.png&w=3840&q=75)


