Analysis of VOC and FOG Emissions from Molded Components for Automobiles According to VDA 278
The Application Notebook
Millions of new cars are produced and registered in Germany every year. In the supply chain of a vehicle, control standards have to be followed to ensure a high quality final product. The VDA regulations, for example, address the organic emissions from automotive components. Based on thermodesorption techniques, VDA 278 regulates the test procedure for nonâmetallic materials used for molded components in automobiles. Using this method, two classes of compounds are distinguished: highly and medium volatile substances (VOC) up to C25 and those of low volatility (FOG) in the range C14 up to C32. In this application note the upper layer material of fairing parts used in automobiles has been analyzed according to VDA 278 regarding its organic emission. The influence of open storage time on the VOC and FOG content has also been investigated.
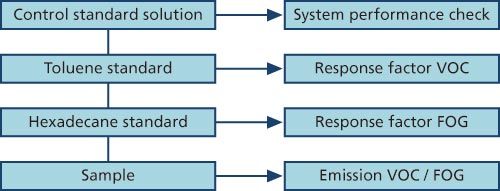
Figure 1: Workflow according to VDA 278.
Workflow and Experimental Conditions
According to VDA 278 the workflow shown in Figure 1 has to be followed. A control standard solution of 18 compounds has to be checked to ensure instrument performance followed by the measurement of two standards as calibration substances. The VOC content is calibrated using toluene; for the FOG calibration hexadecane is used to determine the respective response factor. Each sample has to be measured twice: one sample is used for a VOC analysis only, while the second one is measured under VOC conditions followed by FOG analysis.
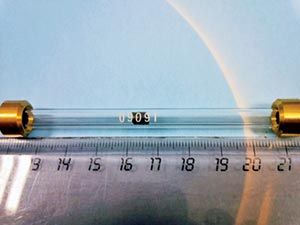
The measurements were carried out using a GCMS-QP2010 SE combined with the TD-20 thermodesorption unit. Following VDA 278, desorption temperatures for the tubes were set to 90 °C (VOC) and 120 °C (FOG), and desorption time was 30 min. The chromatographic separation was performed using a 50 m × 0.32 mm, 0.5-µm Optima5MS column. The oven temperature was programmed and began at 50 °C, held for 2 min, ramped with 25 °C/min to 160 °C followed by a second ramp of 10 °C/min up to 280 °C final temperature, and held for 30 min. Compound detection was done by an MS full scan over the expected mass range. As a result of the high concentrations of both standards and samples, a split of 100:1 was used to prevent detector saturation. In addition, the amount of standards injected into the TD tubes could be decreased by a factor of 4 to 0.5 µg absolute. The sample was cut into small pieces of approximately 10 mg and placed into empty TD tubes as shown in Figure 2. For the standard solution, tubes filled with Tenax were used, and the solvent was evaporated after injection under a continuous flow of nitrogen gas (5 min at 100 mL/min).
Figure 2: Sample placed into the TD tube.
Results
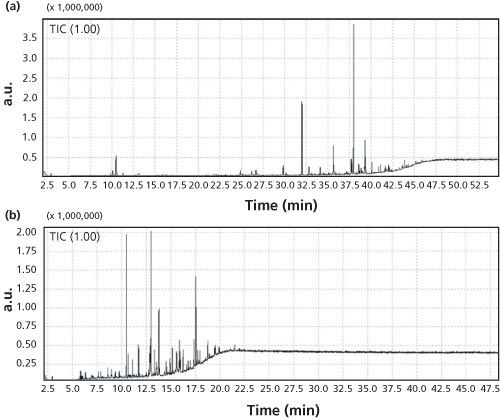
The chromatogram of the control standard solution is shown in Figure 3. As required by VDA 278, o-xylene and n-nonane are baseline separated. While undecane and 2,5-dimethylphenol coelute (see insert in Figure 3), both can be identified using the library search. Recovery rates for the compounds checked were well within the limits of 60–140%. For toluene, the recovery was 98%. Response factors calculated for VOC and FOG were 0.08 and 0.06, respectively. With these factors, emissions from the upper layer material of fairing parts were measured directly after opening the package. The chromatograms for the VOC and FOG run are shown in Figure 4. For emission calculations all peaks have been summed. An analogous measurement was repeated after 7 days of open sample storage in a neutral environment.
Figure 3: Chromatogram of the control standard.
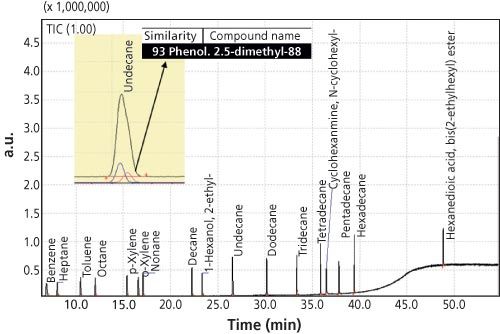
Figure 4: Chromatograms of the upper layer material of fairing parts measured under (a) VOC and (b) FOG conditions.
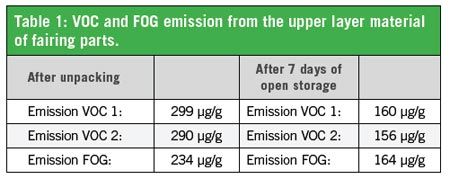
The emission values for all measurements before and after storage are summarized in Table 1. As would be expected, the emission decreased significantly after longer storage time. Reduction in VOC value was much stronger than FOG content as these compounds have higher volatilities.
Conclusion
In this application note the upper layer material of fairing parts used in automobiles was analyzed for VOC and FOG compounds, according to VDA 278. The GCMS-QP2010 SE in combination with TD-20 proved to be fully sufficient for this type of analysis. Furthermore, a high influence of the storage time on the emission values was determined, indicating that defined storage times are extremely important for reliable and reproducible detection of the emission values.

Shimadzu Europa GmbH
Albert-Hahn-Str. 6–10, D-47269 Duisburg, Germany
Tel: +49 203 76 87 0 fax: +49 203 76 66 25
E-mail: shimadzu@shimadzu.eu
Website: www.shimadzu.eu

Separation of Ultra-Short and Long Chain PFAS Compounds Using a Positive Charge Surface Column
December 11th 2024A separation of ultra-short and long chain PFAS (C1-C18) is performed on a HALO®PCS Phenyl-Hexyl column along with a HALO®PFAS Delay column which demonstrates excellent retention for both hydrophilic and hydrophobic analytes.

.png&w=3840&q=75)

.png&w=3840&q=75)


.png&w=3840&q=75)


.png&w=3840&q=75)


