Workflow Development for the Analysis of Phenolic Compounds in Wine Using Liquid Chromatography Combined with Drift-Tube Ion Mobility–Mass Spectrometry
LCGC North America
Here we propose an exemplary workflow for the analysis of phenolic extracts (i.e. wine) enabling confident differential analysis using high performance liquid chromatography in combination with low-field drift tube ion mobility quadrupole time-of-flight mass spectrometry (HPLC×IMS-QTOFMS). In this workflow, single-field collisional cross section values from low-field drift-tube IMS using nitrogen as drift gas (DTCCSN2) are readily extracted in addition to a retention time and a high resolution mass spectrum for each compound. “Alternating frames” experiments utilizing post-drift tube fragmentation also allow drift time-aligned MS/MS spectra to be obtained. Molecular feature extraction was highly repeatable with average precision values of 0.28% for retention time, 0.18% for drift time, and 1.5 ppm m/z determined for 233 molecular features found in all six technical replicates. The improved selectivity of this strategy increases confidence in intersample molecular feature alignment (i.e. compound identity confirmation), including the resolution of co-eluting isomeric compounds.
Here we propose an exemplary workflow for the analysis of phenolic components in wine enabling confident differential analysis using high performance liquid chromatography (HPLC) in combination with low-field drift-tube ion mobility quadrupole time-of-flight mass spectrometry (IMS-QTOF-MS). In this workflow, single-field collisional cross section values from low-field drift-tube IMS using nitrogen as drift gas (DTCCSN2) are readily extracted in addition to a retention time and a high resolution mass spectrum for each compound. “Alternating frames” experiments using post-drift tube fragmentation also allow drift time-aligned MS/MS spectra to be obtained. Molecular feature extraction was highly repeatable with average precision values of 0.28% for retention time, 0.18% for drift time, and 1.5 ppm m/z determined for 233 molecular features found in all six technical replicates. The improved selectivity of this strategy increases confidence in intersample molecular feature alignment (that is, compound identity confirmation), including the resolution of coeluted isomeric compounds.
Phenolic extracts of many plant materials contain high concentrations of flavonoids, which are secondary plant metabolites that color flowers and fruit to either attract or repel insects, as well as to protect plants from the adverse effects of ultraviolet (UV) light and herbivores or insects (1). Such compounds are also frequently contained in foodstuffs and are known to be important for human health (2). For example, flavonoids found in fruits and derived products such as wine include potentially health-promoting compounds such as anthocyanins, flavan-3-ols, flavonols, and dihydroflavonols. Nonflavonoid classes include phenolic acids (hydroxybenzoic and hydroxycinnamic acids and their derivatives) and stilbenes (for example, resveratrol) (1,3).
As the study of phenolic compounds can facilitate better understanding of structure-activity relationships, their contribution to human diet, and other suggested health-promoting benefits (1,2), the development of advanced methods for compound separation and identification remains a crucial step in gaining new information about their metabolism. Moreover, the use of an analytical metabolomics workflow is also required to assess both natural (for example, plant growth) and artificial (such as production) aspects that influence the final phenolic profile in products prepared for human consumption. However, the analysis of phenolic compounds presents some challenges because of the enormous structural diversity of phenols, the number of possible isomeric structures, the complexity of sample matrices, the limited number of commercially available standards, and the lack of comprehensive high performance liquid chromatography–mass spectrometry (HPLC–MS) libraries for confident compound identity confirmation (4). As such, nontargeted strategies based on both chromatography and mass spectrometry are typically required (5–8), and may also need to be tailored for particular sub-classes of phenols and polyphenols. Although various combinations of LC and LCxLC with diode-array detection (DAD) and high-resolution mass spectrometry are state-of-the-art platforms for nontargeted analysis of such natural products (5,9–11), variations in retention time, incomplete chromatographic separation of components, and the inherent similarity of both MS and MS/MS spectra of phenolic components remain significant bottlenecks for reliable intersample comparison and confidence in assigning a putative structure for individual compounds. Furthermore, the software and databases used for these instrumental platforms are generally tailored toward primary metabolomics pathways, proteomics, and other specialized workflows that may not yet be entirely suitable for the identification of phenolic and polyphenolic compounds (3,12).
To this end, Zhang and colleagues (13)recently developed a sophisticated workflow allowing peak-picking of phenols from a DAD chromatogram, association of the tandem mass high-resolution spectra (orbital ion trap) with this peak, and provision of putative structure suggestions based on matching with FooDB and Metlin databases. A major goal of this advanced workflow was to reduce the amount of user input time required for correct compound identity confirmation using putative structure suggestion based on database entries. Although this approach undoubtedly provides these described benefits, it nevertheless relies on the existence and quality of database entries for known standards or at least comparison to extracts analyzed using identical chromatographic conditions. Furthermore, the inherent difficulties in comparing retention times from DAD-based chromatograms across different platforms and between different laboratories are well-known, and irreproducible results can occur because of matrix effects influencing chromatographic processes even when performed on the same platform, or simply via loss in column performance over time. Therefore, a complementary approach that increases reliability and confidence in compound identity confirmation could be very valuable for the development of nontargeted workflows for a broader range of phenolic extracts as differential analysis across different instruments becomes more feasible.
In this regard, rather than focusing on the precision (repeatability) and reproducibility of the chromatographic separation component of the analysis, the alternative approach presented here is the incorporation of low-field drift-tube ion mobility separation between the HPLC and high-resolution quadrupole time-of-flight mass spectrometry (QTOF-MS). This approach is attractive for selectivity considerations because it offers the possibility to yield highly repeatable gas phase separations of metabolites over a wide range of sizes before high-resolution MS detection. As collisional cross section values based on drift-tube ion mobility (or DTCCS) can be extracted under low-field conditions with extremely good precision (<0.5%) using ion mobility spectrometry quadrupole time-of-flight mass spectrometry (IMS-QTOF-MS) instrumentation (14), the incorporation of such values into the compound identification process should increase confidence significantly, allowing comparison of different samples with reduced emphasis on retention time reproducibility and fragment–adduct abundance in MS or MS/MS spectra (15). Furthermore, studies with both the prototype and commercially available instrumentation have demonstrated the suitability of using IMS in combination with mass spectrometry for this type of application (16).
To evaluate the viability of a new IMS-assisted nontargeted workflow, the theoretical value provided by the addition of the drift-tube IMS separation for the considered compound class should be considered first (14). Although concepts such as IMS resolving power and overall peak capacity have substantial theoretical value (17,18), the most relevant aspect for supporting correct molecular feature annotation is the precision of the DTCCS determination because this value directly represents a physical property of analytes that can be used to help confirm the presence of a given compound. Although reflecting an average molecular property, the DTCCS value of an individual phenolic compound will not necessarily be unique given the structural similarities observed for compounds with the same backbone structure. However, the use of this value in combination with chromatographic retention time, qualifying ions, and accurate-mass tandem mass spectra is suggested to provide a route to more confident molecular feature alignment and inter-sample comparison. Furthermore, consideration of both ionization modes (positive and negative) as well as qualifying ions formed via interaction of flavonoids with various metal ions can also be exploited to yield specific structural information based on changes in the DTCCS value when adducts are formed (19,20).
In this article, we demonstrate the development of a preliminary workflow using drift-tube IMS-QTOF-MS in combination with analytical-scale HPLC separations of phenolic components from red wine samples. Wine remains a particularly challenging sample for nontargeted analysis because >60% of masses obtained via high-resolution MS-based methods have not been described in the literature (3), while increasingly sophisticated analytical strategies are being sought to study compound-level differences in phenolic content for the purposes of detecting wine adulteration, determination of origin, and aging processes in wine (3,11,12,21). The combination described here is intended to provide increased confidence in intersample molecular feature alignment and annotation for phenolic extracts, eventually allowing for a more robust analytical workflow and future interlaboratory comparisons.
Experimental
Chemicals
Stock solutions of analytical-grade phenolic standards (kaempferol, quercetin, myricetin, gallic acid, epicatechin, catechin) were purchased from Sigma-Aldrich and prepared in water–acetonitrile mixtures. LC–MS-grade acetonitrile and water, ammonium formate, and formic acid were also purchased from Sigma-Aldrich.
Sample Preparation
Wine samples (Shiraz Heritage Release South Eastern Australia 2013 by Wolf Blass, Cuvée Tradition Blaufränkisch-Zweigelt-Merlot 2014 by Anton Iby, Emotion Wine, and Flat Lake Limitation Blaufränkisch-Zweigelt 2014 by Leo Hillinger) purchased locally were opened and aliquots were filtered with nylon membranes (Iso-Disc, N-4-4, nylon, 4 mm x 0.45 µm, Supelco). Filtered samples were diluted 1:10 with 10 mM ammonium formate solution (pH 3.75), with 10% v/v methanol to a final volume of 1.00 mL. Samples were stored at 6 °C in the autosampler tray (Gerstel Dual Rail MPS 2) when awaiting analysis.
HPLC–MS Instrumentation
An Agilent 1290 Infinity II LC system was coupled to an Agilent 6560 IMS-QTOF mass spectrometer equipped with an electrospray ionization (ESI) source, an Agilent G1607A dual Jetstream coaxial sprayer, and an upgraded ion mobility alternate gas kit with electronic drift gas pressure control. The chromatographic method was adapted from that of Jaitz and coworkers (22). Briefly, HPLC separations were performed at a temperature of 40 °C using a 50 mm x 2.1 mm Zorbax C18 SB Rapid Resolution column and a conventional reversed-phase mobile-phase gradient. Eluent A was 0.1% v/v formic acid in water, and eluent B was 0.1% formic acid in acetonitrile. Using a solvent flow rate of 350 µL/min, an initial composition of 99% A was held for 2 min, followed by a compositional gradient of 1–50% B in 2–10 min, and then an increase to 70% from 10 to 17 min. This composition was held for 1 min before it was returned to 1% B and held for 2 min (total run time of 20 min). The injection volume was 5 µL.
Nitrogen was used as the drying gas for all measurements at a temperature of 360 °C, a sheath gas temperature of 150 °C, and a sheath gas flow rate of 13 L/min. The nebulizer gas pressure was 20 psi, the MS capillary voltage was -4000 V, the nozzle voltage was -2000 V, and the fragmentor was set to -275 V. The scanning mass range was from m/z 100 to 1700. The mass spectrometer was calibrated immediately before measurements using the supplied calibrant masses of the manufacturer. The secondary nebulizer in the ESI source was also used to infuse solution containing reference masses constantly during the analysis.
HPLCxIMS-QTOF-MS Conditions
When operating in the IMS-TOF-MS mode, the square radio frequency (RF) trapping funnel located in front of the drift tube is used to sequentially trap and release packages of ions from the stream of ions entering via the ESI interface (23). For these experiments, the instrument was tuned to optimize the transmission of fragile ions (50–250 m/z) in the 2-GHz extended dynamic range mode. The trapping funnel was operated with a trapping time of 40,000 µs, and it released packages of ions every 60 ms (that is, no multiplexing was used) with a trap release time of 150 µs set within the software. The drift tube was operated with an absolute entrance voltage of -1700 V and an exit voltage of -250 V with a drift-tube pressure of 3.95 Torr and a temperature of 30 °C using high-purity nitrogen as the collision gas. The acquisition settings were adjusted to yield five ion mobility transients per frame corresponding to 2.8 ion mobility frames per second. The MS recorded 501 TOF transients per ion mobility frame (1 TOF transient = 200 µs, maximum ion mobility drift time of 60 ms).
The collection of MS/MS spectra in the IMS-QTOF-MS mode was facilitated by using the “alternating frames” setting, whereby the energy in the collision cell (located post-drift tube) was set to alternate between -40 V and 0 V between frames for the entire duration of the measurement. High-purity nitrogen was used as the collision gas. In this mode, the number of TOF transients per frame is effectively halved because 50% of the duty time is dedicated to the acquisition of high collision energy data.
Post-Processing of Data
Data collected in the IMS-TOF-MS and IMS-QTOF-MS modes were first post-processed for online accurate-mass calibration in the software tool provided by the instrument manufacturer using the reference masses from the secondary sprayer as calibrant ions (purine, [M-H]- = 119.036320; and hexakis-(1H,1H,3H-tetrafluoro-pentoxy) phosphazene, [M+CH3CO2-H]- = 966.000725). The DTCCSN2 values for ions measured in wine samples were determined using a single-field calculation facilitated by the measurement of a series of reference ions (24). The reference DTCCSN2 values were determined independently using a conventional stepped-field determination.
Data files from IMS-TOF-MS and IMS-QTOF-MS measurements were then assessed using the IM Browser Software where all acquisition frames were extracted and superfluous data were removed by trimming the file. The built-in Molecular Feature Finding tool was then used for preliminary assessment, which treats the data as a large, four-dimensional (4D) array (retention time, drift time, mass-to-charge ratio, abundance) and searches for ions with common chromatographic elution profiles and drift spectra.
Feature Finding and Molecular Feature Alignment
Data files were evaluated in a nontargeted workflow. In-depth 4D feature finding was performed using MassHunter Mass Profiler (Agilent Technologies). In the feature finding process, ions picked by the software algorithm are grouped together according to a common elution profile, m/z information such as isotopologues, and drift time, with a quality score calculated based on these results using a software algorithm. Molecular feature finding was performed using the “total ion volume” setting for the abundance measurement, the charge state was limited to between -1 and -2, a minimum of two ions per compound, a minimum extraction threshold of 25 counts, a minimum compound abundance of 1000 (ion volume), while the features were confined to regions of the chromatographic run between 2 and 16 min. Intersample molecular feature alignment was filtered using retention time matching of ±0.30 min, and m/z of 15 ppm ±2 mDa. The final molecular feature lists were further filtered by using the “Q-Score” setting (set between 50 and 80 in this study), which considers the accurate mass data (monoisotopic mass, isotopologue abundance, and spacing), drift time alignment, and chromatographic peak shape.
Differential analysis involves the comparison of putative compounds across two different samples using retention time, drift time, and accurate mass information. To be considered a suitable compound, knowledge of typical adduct formation of phenolic compounds was used for quality control. Some manual controlling of molecular feature lists was also performed for IMS-MS data by comparison to the analysis of matrix blanks, while adducts and doubly charged species separated only in the drift tube were removed from molecular feature lists generated for IMS-MS data.
Extracted ion chromatograms (EICs) for some ions were manually extracted in the IM Browser and further evaluated with MassHunter Qualitative Analysis 7.0 software based on the exact mass measured with an extraction window of ±10 ppm.
Stepped-Field Determination of DTCCS Values
A series of phenolic standards were measured in direct-infusion mode using a syringe pump operated at a flow rate of 20 µL/min. The field strength was varied during the course of each measurement (increments of 100 V between 1450 and 1050 V changed every 30 s). Acquisition settings were adjusted to yield one ion mobility frame per second, corresponding to 16 ion mobility transients per frame (1 transient = 60 ms). DTCCSN2 values were then determined using the stepped-field calculation tool provided in the commercial software.
Results and Discussion
Stepped- and Single-Field DTCCS Determination of Standard Compounds
Measurements of DTCCS values of analytical standards using a conventional stepped-field method were carried out using a direct infusion experiment to establish reference values in a repeatability study and for comparison to later online single-field measurements. Classical stepped-field measurement involves the determination of arrival times (tD) at different field strengths (ΔV), and constructing a plot (1/ΔV versus tD) to determine the nonmobility time component (t0) and correct to true drift times (td) for the calculation with the fundamental zero-field (Mason-Schamp) equation. Single-field measurements are enabled by the measurement of calibrant ions to allow universal calibration of DTCCS values on a chromatographic timescale (24). DTCCS values were first collected in the negative ionization mode for comparison with online measurements from HPLCxIMS-TOF-MS experiments (25). Repeatability of DTCCS values and mass accuracy was found to be excellent for the standard compounds studied, with interday repeatability precision of less than 0.4% across three days (27 measurements) for all compounds measured, while good agreement was found between measurements made using the online single-field measurements from components found in real wine samples (Figure 1).
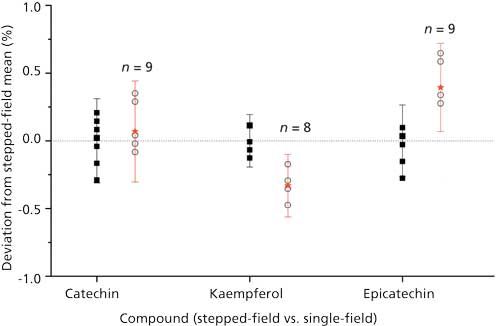
Figure 1: Comparison of single field-derived DTCCSN2 values (red) determined for some investigated standards found in wine with conventional stepped-field method results for analytical standards (black). Error bars shown represent ±2 s with all data points shown from inter- and intraday precision studies using the stepped-field method.
In positive ionization mode, the electrospray conditions were not optimized for the formation of [M+H]+ ions in subsequent chromatographic analysis, but ions for most of the standard compounds could be observed and DTCCS values were determined in the same manner (data not shown). Additionally, the chemoselective formation of adducts of aglycone structures with a ketone group adjacent to a hydroxyl group, and glycosylated phenols, which are both characterized by substantially smaller DTCCS values than both protonated and deprotonated ions, was also observed when a suitable amount of sodium acetate was added to the standards (20). Although these compounds were only observed sporadically in the online experimental setup (that is, HPLCxIMS-MS), if conditions were optimized for their formation, these sodiated adducts could be readily pinpointed in data files via a combination of their elution profile and accurate mass difference from deprotonated ions. This step might help address a potential shortcoming of adding DTCCS values of phenolic compounds to HPLC–MS databases, because the structural differences (for example, a minor variation in substitution patterns on a common backbone) mean that the DTCCS values obtained for these compounds will only encompass a narrow range.
Addition of Drift-Tube IMS to HPLC–MS Workflow (HPLCxIMS-TOF-MS)
The orthogonality of drift time and chromatographic dimensions is readily apparent when viewing data as a two-dimensional (2D) array (Figure 2a). However, information from the m/z domain must be extracted from this array to elicit structural information for the individual features shown. The initial molecular feature finding for these data was performed within the IM browser for preliminary assessment and yielded approximately 2000 possible compounds in wine samples (minimum ion abundance threshold of 25). However, using a combination of filtering tools, comparison to matrix blank samples, and chemical knowledge, a large number of features can be excluded according to the practical retention time window, conformational ordering in the drift time versus m/z space (for example, consideration of post-drift tube fragmentation), and the number of qualifying ions found (typically isotopologues of the [M-H]- ion). Following trimming of the data files and implementation of filter settings (Figure 2b), the number of compounds was reduced to between 200 and 350 per wine sample. Although this approach reduces the number of discriminating compounds significantly, it increases the probability of compound identity confirmation and correct annotation across multiple samples as only compounds with a precise retention time, drift time, and compound mass spectrum are selected for subsequent sample differentiation. Subsequent comparisons across the three different samples performed with MassHunter Profiler allowed compounds common to more than one sample and unique compounds to be pooled. By increasing the quality score, the similarity between the two Austrian wines of similar origin and type is emphasized, whereas the percentage of unique molecular features found for the Australian Shiraz wine remained constant at 30–31% (Figure 3). Although no compound- or pathway-specific information should be derived from these initial studies, the results from the workflow correspond to expected varietal characteristics of the wines analyzed.
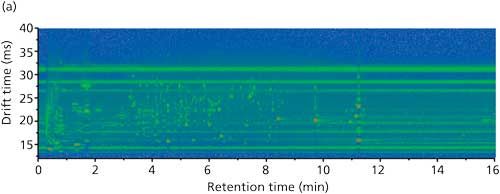
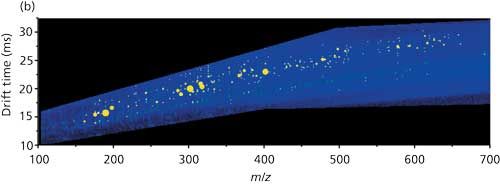
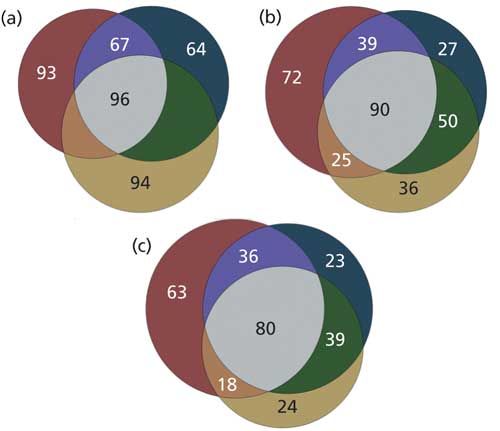
Figure 3: Venn diagram comparisons of unique and shared molecular features for three of the exemplary wine samples (red = Australian Shiraz, blue = Blaufränkisch-Zweigelt-Merlot, yellow = Blaufränkisch-Zweigelt) used in this study based on compound identification results from HPLCxIMS-MS analysis. (a) Q-Score ≥50, (b) ≥70, (c) ≥80.
Differential analysis of wine samples without IMS was used to assess similarities between the different wines prepared for this study to develop lists of compounds common and unique to the different wine types analyzed, a process that was later repeated for the data obtained with additional IMS separation. Because the incorporation of the IMS functionality adds some complexity to the feature alignment process (vide infra), it is currently difficult to make an accurate determination of the features found exclusively in TOF-MS and IMS-TOF-MS modes. Qualitative examples of isobaric molecular features, distinguishable only when IMS functionality was used, were apparent with very good quantitative repeatability determined from the assessment of technical replicates (for example, Figure 4).
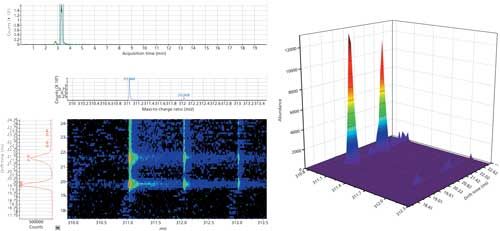
Figure 4: Example of coeluted isobaric molecular features found in Blaufränkisch wine resolved only by the low-field drift-tube IMS separation. Technical repeatability precision of the peak heights was assessed with %RSD values of 1.4% (19.83 ms) and 3.3% (21.67 ms) over six injections.
Here, we note that eventual incorporation of IMS into such a workflow can bring about a compromise between sensitivity and selectivity for nontargeted analysis because of the nature of the ion trapping mechanism, which may not always be favorable depending on the analytical goals for particular compound classes. Nevertheless, with the goal of achieving higher confidence in compound identification for eventual statistical comparison across different samples, the incorporation of drift-tube IMS functionality into the workflow appears to be a powerful complement for this type of analysis. Moreover, options for decreasing limits of detection are also available including optimization of IMS trapping conditions, the use of IMS multiplexing, or preconcentration of targeted compound classes before chromatographic analysis.
Alternating Frames Approach (HPLCxIMS-QTOF-MS)
The “alternating frames” mode allows MS/MS spectra to be obtained in addition to the full TOF mass spectrum and drift time information during online analysis on a chromatographic timescale. This mode is particularly valuable for initial nontargeted analysis as MS/MS spectra can be aligned to both retention and drift time regions because fragmentation occurs after the drift-tube separation. Features can be readily found in the zero-fragmentation frames using the same feature finding process, while fragments of the precursor ion (typically deprotonated in this study) can be found by examining the full mass spectrum filtered by both retention and drift time and confirmation via drift spectrum and EIC alignment.
An example of the putatively identified quercetin-O-gluconuride ([M-H]- = 477.0675 g/mol) is shown in Figure 5. Although this mode of operation using “all ions” fragmentation cannot replicate the selectivity and sensitivity of optimized MS/MS experiments accessible via isolation and fragmentation experiments, potential fragment ions can be readily checked for association with the precursor ion by extraction of a product ion drift-time spectrum and a drift-time-filtered EIC. Only with a combination of EIC, drift spectrum, and accurate mass (all in the high fragmentation data) can a fragment be considered as being associated to a given precursor feature and used for compound identity confirmation.
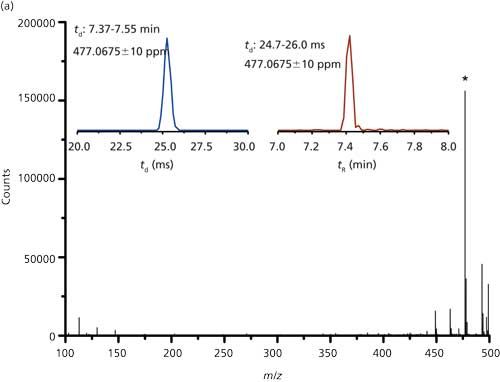
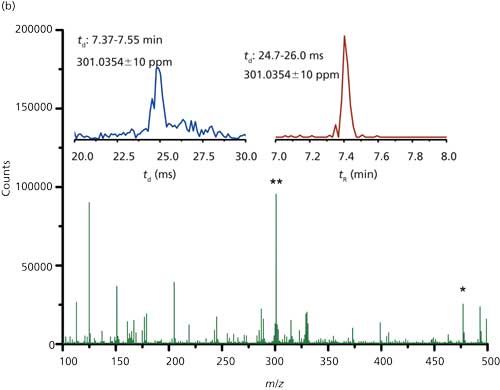
Figure 5: (a) Drift-time filtered mass spectrum of quercetin-O-gluconuride (putative identification) found in wine from low-fragmentation (0 V) frames using the alternating frames setting. (b) Drift-time filtered mass spectrum from the high-fragmentation (-40 V) frames from the same sample. Insets shown in each figure illustrate the location of ions in the separation space for subsequent extraction.
Repeatability Precision of Total Workflow
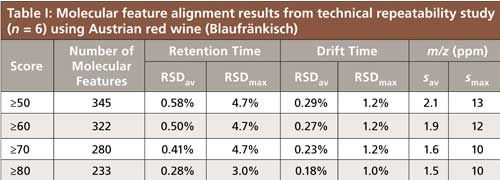
A comprehensive quantitative comparison of compound abundances was not made in this study because our initial focus was placed on the various instrument modes and repeatability of molecular feature alignment capabilities. To examine the technical repeatability of the entire workflow, assessment of the repeatability precision was made via complete analysis and data extraction of six technical replicates from a single red wine sample. This process indicated the high level of technical precision obtained because more than 300 molecular features were reliably extracted and aligned with extremely good precision for retention time, drift time, and accurate mass spectra (Table I). The excellent precision of drift-time repeatability across these samples also suggests that retention time tolerance can be kept relatively relaxed in the initial feature finding steps to allow for variations in chromatographic behavior because both high-resolution mass information and a DTCCS value were obtained for each compound. This is particularly promising for wine analysis as nontargeted metabolomic studies encounter difficulties in molecular feature annotation, as shown by cross-platform comparisons (12).
We emphasize here that comprehensive HPLCxIMS-QTOF-MS studies demanding detailed information for authenticity or biological interpretations will require the use of authentic wine or phenolic extract samples, the acquisition of production or biological replicates, optimization of quantification strategies, and additional software considerations for recursive data extraction. Moreover, validation of quantitative comparisons between samples will require a significant amount of effort to demonstrate reliable determination of fold-changes for individual compounds. However, the initial results from this workflow assessment indicate that high-precision data can be obtained when using this instrumental setup for analytical undertakings, such as the differential analysis of wine.
Conclusion
The HPLCxIMS-MS method described here and the data analysis workflow are suggested as a powerful and highly repeatable approach for the analysis of phenolic compounds present in samples such as wine. Offline (stepped-field) and corresponding online (single-field) determination of high-precision DTCCS values, together with retention time, accurate mass, and drift-time-aligned MS/MS spectra are a powerful combination for confirming compound identity between different phenolic extracts. The high precision determined for abundance repeatability, including isobaric compounds, indicates that quantitative determination via recursive compound extraction will be readily possible for both targeted and nontargeted analysis workflows once these features are developed for 4D datafiles.
Although positive ionization mode was not used in the online setups described here, the use of additional DTCCS values from alkali metal adducts may prove qualitatively useful in an offline method for identity confirmation following isolation of chromatographic fractions of interest. Identity confirmation may also be possible using an optimized post-column addition approach, such as that described in so-called coordination ion-spray setups (26,27).
Some further developments using the described approach are in need of further investigation, most prominently the possibility of IMS multiplexing to improve dynamic range, and full assessment of quantitative comparisons of compound abundances for characterization and application to in-depth studies where absolute confirmation of compound identity can be essential. These aspects are the focus of ongoing studies and constitute a crucial part of analytical method development with this approach.
Acknowledgments
Vienna Business Agency and EQ BOKU VIBT GmbH are acknowledged for providing mass spectrometry instrumentation.
References
- G. Di Carlo, N. Mascolo, A.A. Izzo, and F. Capasso, Life Sci. 65, 337–353 (1999).
- M. Herrero, C. Simó, V. García-Cañas, E. Ibáñez, and A. Cifuentes, Mass Spectrom. Rev.31, 49–69 (2012).
- M.E. Alañón, M.S. Pérez-Coello, and M.L. Marina, TrAC Trends Anal. Chem. 74, 1–20 (2015).
- C.M. Ajila, S.K. Brar, M. Verma, R.D. Tyagi, S. Godbout, and J.R. Valéro, Crit. Rev. Biotechnol. 31, 227–249 (2011).
- A. de Villiers, P. Venter, and H. Pasch, J. Chromatogr. A1430, 16–78 (2016).
- M.-J. Motilva, A. Serra, and A. Macià, J. Chromatogr. A1292, 66–82 (2013).
- M. Gleichenhagen and A. Schieber, Curr. Opin. Food Sci. 7, 43–49 (2016).
- V. Vukics and A. Guttman, Mass Spectrom. Rev. 29, 1–16 (2010).
- M. Szultka, B. Buszewski, K. Papaj, W. Szeja, and A. Rusin, TrAC Trends Anal. Chem.47, 47–67 (2013).
- K.M. Kalili, and A. de Villiers, J. Sep. Sci.34, 854–876 (2011).
- C.M. Willemse, M.A. Stander, J. Vestner, A.G.J. Tredoux, and A. de Villiers, Anal. Chem. 87, 12006–12015 (2015).
- R. Díaz, H. Gallart-Ayala, J.V. Sancho, O. Nuñez, T. Zamora, C.P.B. Martins, F. Hernández, S. Hernández-Cassou, J. Saurina, and A. Checa, J. Chromatogr. A1433, 90–97 (2016).
- M. Zhang, J. Sun, and P. Chen, Anal. Chem. 87, 9974–9981 (2015).
- J.C. May, C.R. Goodwin, N.M. Lareau, K.L. Leaptrot, C.B. Morris, R.T. Kurulugama, A. Mordehai, C. Klein, W. Barry, E. Darland, G. Overney, K. Imatani, G.C. Stafford, J.C. Fjeldsted, and J.A. McLean, Anal. Chem. 86, 2107–2116 (2014).
- K.L. Crowell, E.S. Baker, S.H. Payne, Y.M. Ibrahim, M.E. Monroe, G.W. Slysz, B.L. LaMarche, V.A. Petyuk, P.D. Piehowski, W.F. Danielson III, G.A. Anderson, and R.D. Smith, Int. J. Mass Spectrom.354–355, 312–317 (2013).
- M. Groessl, A. Azzollini, P.J. Eugster, B. Plet, J.-L. Wolfender, and R. Knochenmuss, Chim. Int. J. Chem. 68, 135–139 (2014).
- J.C. May, J.N. Dodds, R.T. Kurulugama, G.C. Stafford, J.C. Fjeldsted, and J.A. McLean, Analyst140, 6824–6833 (2015).
- T.J. Causon and S. Hann, J. Chromatogr. A1416, 47–56 (2015).
- B.H. Clowers and H.H. Hill, J. Mass Spectrom. 41, 339–351 (2006).
- B.D. Davis, P.W. Needs, P.A. Kroon, and J.S. Brodbelt, J. Mass Spectrom. 41, 911–920 (2006).
- K.M. Kalili, J. Vestner, M.A. Stander, and A. de Villiers, Anal. Chem.85, 9107–9115 (2013).
- L. Jaitz, K. Siegl, R. Eder, G. Rak, L. Abranko, G. Koellensperger, and S. Hann, Food Chem.122, 366–372 (2010).
- B.H. Clowers, Y.M. Ibrahim, D.C. Prior, W.F. Danielson, M.E. Belov, and R.D. Smith, Anal. Chem. 80, 612–623 (2008).
- J. Fjeldsted, R.T. Kurulugama, A. Mordehai, E.E. Rennie, E. Darland, G.C. Stafford, J.C. May, S.M. Stow, J.A. McLean, T.J. Causon, T. Mairinger, S. Hann, E.S. Baker, and X. Zhang, “Highly Accurate Collision Cross Section Measurements for Comprehensive High Throughput Applications,” presented at the 64th Annual Meeting of the American Mass Spectrometry Society (ASMS), San Antonio, Texas, 2016.
- A. Mordehai, R.T. Kurulugama, E. Darland, G.C. Stafford, and J.C. Fjeldsted, “Single Field Direct Drift Time to CCS Calibration for a Linear Drift Tube Ion Mobility Mass Spectrometer,” presented at the 63rd Conference on Mass Spectrometry and Allied Topics (ASMS), St. Louis, Missouri, 2015.
- C. Rentel, P. Gfrörer, and E. Bayer, Electrophoresis20, 2329–2336 (1999).
- A. Medvedovici, K. Lazou, A. d’Oosterlinck, Y. Zhao, and P. Sandra, J. Sep. Sci. 25, 173–178 (2002).
Tim J. Causon, Marian Došen, and Stephan Hann are with the Division of Analytical Chemistry in the Department of Chemistry at the University of Natural Resources and Life Sciences (BOKU Vienna) in Vienna, Austria. Gottfried Reznicek is with the Department of Pharmacognosy at the University of Vienna in Vienna, Austria. Direct correspondence to: tim.causon@boku.ac.at

New Study Reviews Chromatography Methods for Flavonoid Analysis
April 21st 2025Flavonoids are widely used metabolites that carry out various functions in different industries, such as food and cosmetics. Detecting, separating, and quantifying them in fruit species can be a complicated process.
Analytical Challenges in Measuring Migration from Food Contact Materials
November 2nd 2015Food contact materials contain low molecular weight additives and processing aids which can migrate into foods leading to trace levels of contamination. Food safety is ensured through regulations, comprising compositional controls and migration limits, which present a significant analytical challenge to the food industry to ensure compliance and demonstrate due diligence. Of the various analytical approaches, LC-MS/MS has proved to be an essential tool in monitoring migration of target compounds into foods, and more sophisticated approaches such as LC-high resolution MS (Orbitrap) are being increasingly used for untargeted analysis to monitor non-intentionally added substances. This podcast will provide an overview to this area, illustrated with various applications showing current approaches being employed.

