GC Troubleshooting in Simple Pictures, Part II
LCGC North America
Five simple pictures that reveal problems with your GC analysis – and how to fix them!
A picture paints a thousand words. The art of gas chromatography (GC) troubleshooting often lies in being able to recognize a problem from the evidence presented in the chromatogram or baseline appearance. In this short series of two articles, we present 10 simple GC pictures that show you how to recognize the issues, deal with the causes, and prevent them from happening again. Part I presented the first five pictures (1). Here, in part II, we present the remaining five pictures.
Irreproducible Retention Times
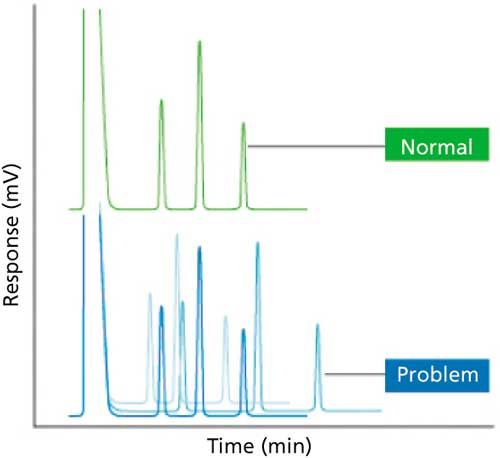
There are two types of retention time variability that can be observed (see Figure 1). Firstly, this variability could be from injection to injection in a run of samples or multiple injections from the same vial. This effect may be caused by changes in carrier-gas linear velocity because of a defective electronic flow controller, leaking septum or column connection, or variable gas supply because of a leak in the gas supply tubing. Under these circumstances you would expect to see variable retention times for all analytes. To remedy the problem, ensure that the instrument settings are correct and occasionally verify that the instrument calculated flow or linear velocity matches the actual carrier gas flow by measuring all inlet flows using a flow meter. Other causes of this type of variable retention times are variations in the oven temperature (either from a faulty temperature controller or from insufficient thermal equilibration time) or a situation in which the inlet pressure is not high enough to sustain flow at high gradient temperatures. In constant-flow operating mode, the carrier pressure is ramped to obtain a constant flow through the temperature program (as the temperature is increased carrier-gas viscosity also increases, and therefore, requires a higher pressure to maintain constant flow); in constant pressure mode, the inlet pressure remains constant, which means that as the carrier-gas viscosity increases during the temperature program the linear velocity will decrease causing retention times to change. With mass-flow or flow-sensitive detectors, this phenomenon can also manifest itself as either a gradually increasing or decreasing baseline signal depending on the response characteristics of the detector. Therefore, it is often better to use constant flow mode to avoid these problems.

Figure 1: Irreproducible retention times.
Long-term variability in retention times may be attributed to changes in the column, such as stationary-phase degradation or a shortened column because of trimming, which when entered incorrectly into the GC data system causes the instrument to incorrectly calculate the linear velocity of the carrier gas. There are certain cases where reduction in column length is more significan-either with short columns (10 m or less) or for columns that are exposed to excessive contamination and need larger lengths removed more regularly. If the column is too short, retention times will be too short and vice versa.
Integration Issues
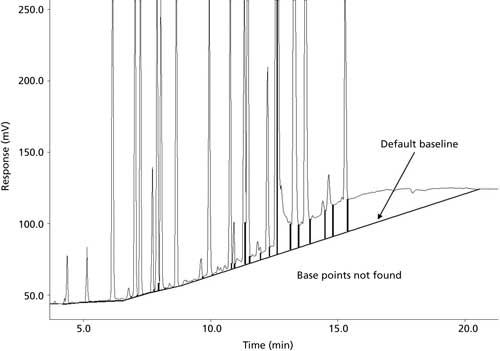
With the phenomenon shown in Figure 2, it is difficult to reliably integrate the peaks because there is a rising baseline. The first solution to avoid this problem would be to eliminate any type of baseline drift in the first place. Baseline drift can be eliminated by reducing column bleed by properly conditioning the column or by using constant flow or linear velocity mode (especially when using a temperature program); if you need to use constant pressure mode and are using a mass-flow sensitive ionizing detector, you may have the ability to use variable make-up flow to compensate for the change in linear velocity during the method. In the real world, rising baselines are often inevitable; therefore, spending some time familiarizing yourself with the advanced integration settings in your data system will allow you to properly integrate challenging chromatograms-these settings include threshold, slope sensitivity, baseline reset points, and different integration methods, such as valley-to-valley. Remember to always use the same integration method every time to provide consistent results.

Figure 2: Integration issues.
Step-Shaped Peaks
In a chromatogram with step-shaped peaks (Figure 3), the step shape may appear either before or after the peak. It may also be accompanied by tailing or a shoulder, and results from analyte thermal degradation in the inlet. To remedy this problem, reduce the inlet temperature in 20 °C steps until a normal peak shape is achieved. However, take care not to lower the inlet temperature to a point where it is too low to achieve proper volatilization of all of your analytes; if this happens you may begin to see irreproducible peak areas.

Figure 3: Step-shaped peaks.
Poor Peak Shape for Early Eluted Peaks
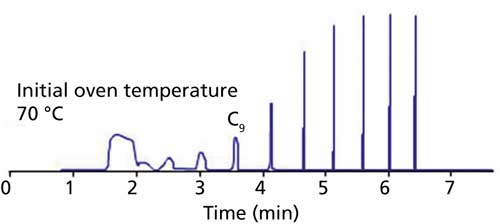
Poor peak shape for early eluted analytes when you are carrying out a splitless injection is caused by a sample solvent–column polarity mismatch or the wrong initial oven temperature (the oven temperature is too high) (Figure 4). In splitless injection, the sample transfer from the liner to the column is slow; therefore, to mitigate band-broadening effects the sample must be refocused at the head of the column. Two focusing mechanisms occur:
- Solvent focusing, where low boiling analytes remain dissolved in the solvent that condenses on the inner wall of the GC column at low initial oven temperatures. The solvent polarity must match that of the column to ensure a contiguous film is deposited and a narrow sample band is left when the solvent evaporates.
- Cold trapping, where higher boiling analytes are condensed in a tight band in the temperature gradient between the inlet and the column oven. Initial oven temperatures should be set 20 °C lower than the boiling point of the solvent used to dissolve the sample.

Figure 4: Poor peak shape for early eluted peaks.
Loss of Resolution from Loss of Efficiency
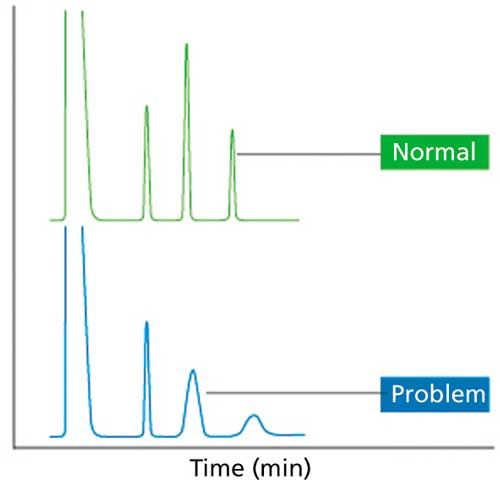
To diagnose resolution loss from decreased efficiency (Figure 5), carry out a plate count (your software will probably do this) on the peaks. If you are seeing a loss in efficiency, the plate count will decrease, in particular for early eluted peaks. There are several causes of this problem, including poor column cut and installation, which leads to analytes being held up at the entrance to the column and eventually to a broadened peak; loss or contamination of the stationary phase (this can be resolved by trimming the column); or the incorrect column length or diameter entered into the data system, which results in an incorrect carrier gas velocity and in turn affects efficiency (remember each carrier gas has an optimum linear velocity to produce chromatography with the best efficiency).

Figure 5: Loss of resolution from loss of efficiency.
There may be other causes of these problems, so for further troubleshooting tips visit the CHROMacademy GC Troubleshooter www.chromacademy.com/gc_troubleshooting.html
Reference
- D. Wallace Watson, LCGC North Am.34(10), 818 (2016).
Get the full tutorial at www.CHROMacademy.com/Essentials (free until December 20).

Understanding FDA Recommendations for N-Nitrosamine Impurity Levels
April 17th 2025We spoke with Josh Hoerner, general manager of Purisys, which specializes in a small volume custom synthesis and specialized controlled substance manufacturing, to gain his perspective on FDA’s recommendations for acceptable intake limits for N-nitrosamine impurities.


