Reader’s Question: Early Eluted Peak
LCGC North America
What could be causing a peak to be eluted before the column dead time? In last month’s “LC Troubleshooting” (1) we looked at problems two readers had with ghost peaks in gradient runs. This month, we’ll continue looking at submitted questions and examine one submitted by another reader of this column.
What could be causing a peak to be eluted before the column dead time?
In last month’s “LC Troubleshooting” (1) we looked at problems two readers had with ghost peaks in gradient runs. This month, we’ll continue looking at submitted questions and examine one submitted by another reader of this column.
Problem with an Early Peak
A reader submitted a problem he observed during a reversed-phase liquid chromatography (LC) analysis of a pharmaceutical product. An unknown peak unexpectedly appeared at a retention time that was much too short. For the analysis, he needed to calculate retention factors for the peaks of interest, so he had injected uracil and observed a retention time of 2.3 min. Everything was satisfactory when reference standards were injected, with a normal and acceptable retention time for the peak of interest. However, when the sample was analyzed, in addition to the normal appearance for the peak of interest, an unknown peak was consistently seen at a retention time of 1.4 min. This was all the information I was given. I assume that the method was isocratic, because retention factors cannot be calculated from retention and the column dead time (t0) with gradients. Also, I assume a C18 column was used and a mobile phase of buffer–organic or water–organic. I have not seen a chromatogram.
The two most likely causes of this problem are the presence of a late-eluted peak that belongs to a prior chromatogram or the exclusion of a sample component from the pores of the column packing. Let’s consider both of these possibilities.
Late Elution
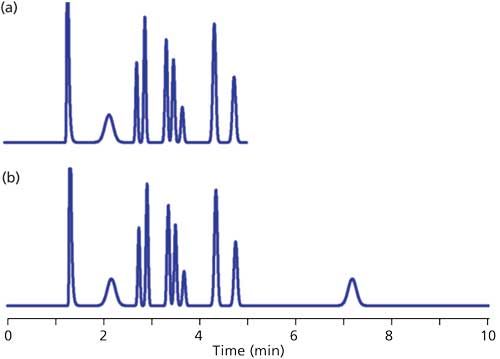
Normally we expect that all the peaks in the sample will be eluted before we stop collecting data, but this is not guaranteed. An example of the problem that may be observed is shown in the simulated chromatogram of Figure 1a. You can see that the peak with a retention time (tR) of ~2.2 min appears to be much broader than its neighbors. Whether we’re looking at a gradient or isocratic chromatogram, all the peaks in a narrow region of the chromatogram should be approximately the same width. With isocratic separations, when a peak is much wider than its neighbors, it is likely that it arises from a previous injection, but insufficient time was allowed for it to be eluted before injection of the next sample. A simple way to check this is to extend the run time for the chromatogram until the peak in question appears in its proper place, as is the case for Figure 1b, where two broad peaks appear. The first, at tR ≈ 2.2 min, is from the previous injection and the peak at tR ≈ 7.2 is in its proper position with the width appropriate for this retention time. This step confirms that the broad peak in Figure 1a belongs to a prior chromatogram.

Figure 1: Simulated chromatograms showing problem of late-eluted peak. (a) Chromatogram with broad peak (~2.2 min) out of place; (b) extended run showing broad peak at proper retention (~7.2 min).
Late-eluted peaks can appear at any time in a chromatogram, and in the reader’s case, it could have appeared before t0 if it originated from an earlier injection. Usually a visual evaluation of the chromatogram is enough to predict if late elution is the problem, but I did not receive a copy of the chromatogram in question, so I can only speculate.
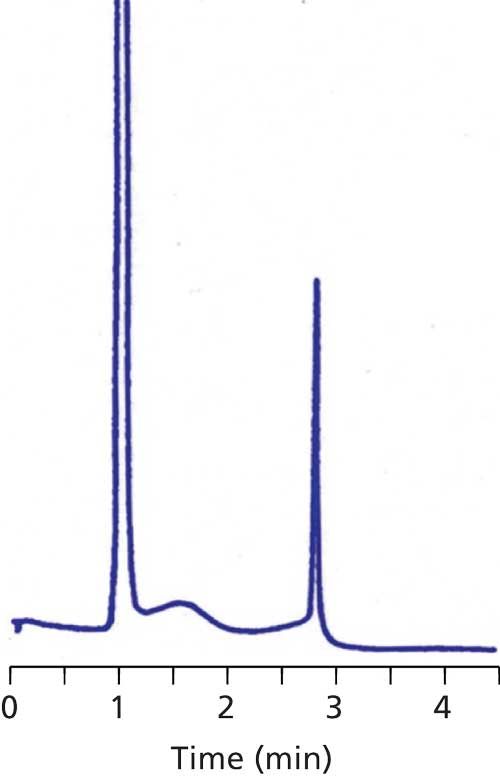
Sometimes the data collection time is sufficiently short and the retention of the late-eluted peak is large enough that it doesn’t appear in the next chromatogram. An example of this is seen in Figure 2. Here, visual inspection should lead us to suspect that the peak at ~1.5 min is a late-eluted peak because it is significantly wider than its neighbors. When the run is extended, it does not appear in the next . . . or the next . . . or the next chromatogram. I like to use a simple calculation based on the plate number (N) to estimate the true retention time of such peaks so that I know where it is likely to elute normally. Recall that the plate number is calculated as follows:

Figure 2: Chromatogram with broad peak (~1.5 min) from previous injection.

where W0.5 is the peak width at half the peak height. This can be rearranged to

With equation 1, we can calculate the plate number of a normally eluted peak, such as one of the later peaks in Figure 1a or the third peak in Figure 2. The plate number should be approximately constant for all peaks in the chromatogram, so once we know N, we can use equation 2 to estimate the true retention time of the broad peak (the peak at 2.2 min in Figure 1a or the second peak in Figure 2). Using this technique, I estimated tR ≈ 7 min for Figure 1 and tR ≈ 26 min for Figure 2. Because this is an estimate of retention, I would not be surprised if these estimates were off by 10–20%, but the estimates should help to locate where the late-eluted peaks belong.
Sample Exclusion
Reversed-phase LC packings typically comprise porous silica particles with a retentive stationary phase (for example, C18) bonded to the surface. These particles are packed into a stainless steel tube and held in place by porous frits and endfittings at each end of the column. Although it is sometimes convenient to think of the particles as silica tennis balls with C18 fuzz bonded to the surface, that is a very poor description of the particles. A better model is that of a 5-µm-diameter popcorn ball, where nanoparticles (with a diameter of 8–10 nm) of solid silica form the particle with pores resulting from the spaces between the nanoparticles. The resulting particle has an external surface area that is <<1% of the total surface area of the particle (2). For sample molecules to be retained, they must interact with the bonded phase on the particle surface. Because nearly all of the surface is inside the particle, sample molecules must diffuse into the pores of the particle before they can be retained. If they cannot enter the pores, they are excluded and will not be retained.
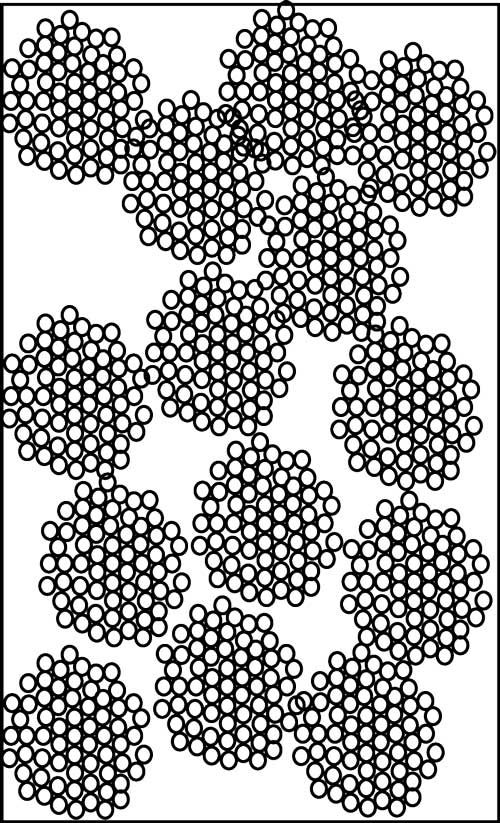
One of the descriptors of a column is its dead volume (Vm), which is the total volume inside the column comprising the volume within the particles (the pore volume) and the volume between the particles (the interstitial volume). These concepts can be seen in the cartoon of Figure 3, where 14 particles are shown packed into a column. The dead volume of a column packed with totally porous particles typically is 60–65% of the volume of the empty column. The interstitial volume is approximately 40% (2), so the pore volume is 20–25% of the volume of the empty column. Another way of looking at this dead volume distribution is that approximately 60% of the dead volume is interstitial volume and 40% is pore volume.

Figure 3: Conceptual diagram of LC column packed with 14 totally porous particles. Particles comprise nanospheres with pores between them; the interstitial space comprises the region between particles.
The column dead volume can be measured by injecting an unretained solute, such as thiourea or uracil, which are unretained on reversed-phase columns when the mobile phase contains more than ~50% organic solvent. Alternatively, the column dead volume can be estimated if we know the size of the column and assume a dead volume of 60–65% of the empty column. One easy-to-remember estimate for 4.6 mm i.d. columns is shown in equation 3:

where L is the length of the column in millimeters and Vm is in milliliters. Thus, a 250 mm x 4.6 mm column will have Vm ≈ 2.5 mL. For columns of internal diameters other than 4.6 mm, another volume estimate is as follows:

where dc is the column internal diameter in millimeters. The same 250 mm x 4.6 mm column will have Vm ≈ 2.6 mL by equation 4. You calculate that equation 3 uses ~60% total porosity and equation 4 uses ~64%, so the estimates are probably good to ~±10%.
How can we use this information to help determine if the reader’s problem could be sample exclusion? First, it would be nice to know what size column was being used so we can confirm that the retention for uracil is reasonable, but since the column size was not supplied, we can use equation 3 or 4 to help us guess. As we saw above, for a 250 mm x 4.6 mm column these equations allow us to estimate Vm ≈ 2.5 mL. At a flow rate of 1 mL/min, the column dead time (t0) would be ~2.5 min. This time is close enough to the observed retention time for uracil of 2.3 min to safely assume that the method uses a 250 mm x 4.6 mm column operated at 1 mL/min.
Next, we can estimate what the retention time would be if the sample was excluded from the pores. In the discussion above, we saw that the interstitial (nonpore) volume was ~60% of the dead volume, so an excluded peak would be expected to be eluted at ~60% of the retention time for uracil (t0). Therefore we expect tR ≈ 0.6 x 2.3 min = 1.4 min. This is the same as the observed retention time for the unknown peak, lending support to the hypothesis that the peak represents a sample component that is excluded from the pores.
There are two common reasons why an analyte might be excluded from the packing pores. One is related to sample size and the other to sample charge. In size-exclusion chromatography (SEC), sample molecules are separated by their relative ease of entering the pores of the column. If the molecule is very small relative to the pore diameter, it can freely enter the pore and will be retained. If the sample is so large that it cannot enter the pore, it will not be retained (excluded). In between these two extremes are intermediate-sized molecules that are partially retained based on their relative size and therefore ease of pore entry. In SEC, ideally there is no chemical interaction, so the earliest possible peak comprises all molecules too big to get into the column pores and the last peak in the chromatogram will comprise all molecules so small that they can fully access the pores. In reversed-phase mode, molecules that are too big to enter the pores (or to a certain extent those large enough to have only partial access to the pores) will be excluded. These molecules will be eluted between the retention represented by the interstitial volume and t0, depending on their size. As a rule of thumb, a molecule needs to have a hydrodynamic radius of less than one-third the pore diameter to have full access to the pores. Typical reversed-phase column packings for small-molecule analysis have pore diameters of ~10 nm. For analysis of large molecules, such as proteins, packings with ≥30-nm pore diameters are favored. If the sample in question contained a polymer excipient or other large molecule, it might be excluded and appear before t0. Another possibility is if the sample molecules aggregated to form dimers or larger aggregates, these aggregates might be sufficiently large to be excluded.
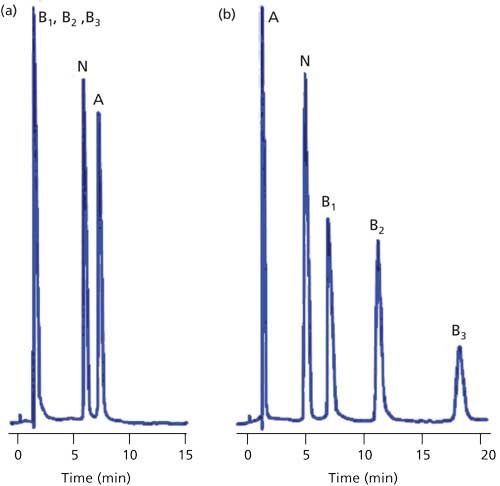
Another exclusion mechanism can be observed if the analyte molecule has the same charge as the surface of the packing material. This is commonly seen in ion-exchange chromatography (IEC). For example, an anion-exchange column carries a positive charge so it can separate negatively charged analytes (anions). If the sample also contains cations, the positive charge of the cationic analyte will be repelled from the positively charged surface, so it does not enter the pores and is excluded from the packing. Normally we don’t observe this problem with reversed-phase chromatography, because the buffer salt concentration in the mobile phase tends to override minor ion exclusion effects. However, if ion pairing is used for a method, the ion pairing reagent will build up a net positive or negative charge on the column surface and can create ion-exclusion conditions. An example of this effect is shown in Figure 4 for a sample of acids, bases, and a neutral compound (3). In Figure 4a, a pH 6 buffer–methanol mobile phase is used with a C18 column and no ion-pair reagent. In this case, the bases are charged and poorly retained. The acid peak is also charged, but has enough reversed-phase character that it is well retained. The neutral compound has intermediate retention. In Figure 4b, octane sulfonate is added as an ion-pair reagent and the column takes on a net negative charge, so the bases are well-retained by the added influence of this charge. The pH is unchanged, so the acidic component is still charged. This charge causes it to be repelled by the net negative charge on the column surface, so it is now excluded. The change in conditions has only a minor influence on the neutral compound. A similar situation could occur with the reader’s sample if the method uses ion-pairing reagents or other mobile-phase components that put sufficient charge on the column to exclude sample components of the same charge.

Figure 4: Example of ion exclusion with ion pair chromatography. (a) Mixture of an acid (A), three bases (B1, B2, and B3) and a neutral analyte with no ion-pair reagent; (b) same conditions as (a) except 14 mM octane sulfate added to mobile phase. C18 column, 20% methanol–buffer (20 mM phosphate, pH 6) mobile phase, and column temperature of 25 °C. Adapted from data of reference 3.
Summary
We have seen that a sample peak that is eluted before the column dead volume is likely the result of either late elution from a previous injection or exclusion from the pores of the column packing. I was not given sufficient data to make a definitive determination of the root cause of this problem. To help make the decision, I would like to see a chromatogram. If the problem peak is broader than the peaks normally eluted early in the chromatogram, I would suspect late-elution as the problem. I would verify this by allowing the chromatogram to run for two or three times as long as normal to see if the peak is eluted in the expected place. I could use the techniques derived from plate number measurements to estimate the approximate true retention time of such peaks. If the problem peak had a width similar to normally retained peaks, sample exclusion is a more likely cause. This suspicion would be reinforced if the method used ion pairing conditions.
References
- J.W. Dolan, LCGC North Am. 34(10), 778–785 (2016).
- U.D. Neue, HPLC Columns: Theory, Technology, and Practice (Wiley-VCH, 1997).
- J.H. Knox and R.A. Hartwick, J. Chromatogr. A204, 3–21 (1988).

John W. Dolan “LC Troubleshooting” Editor John Dolan has been writing “LC Troubleshooting” for LCGC for more than 30 years. One of the industry’s most respected professionals, John is currently the Vice President of and a principal instructor for LC Resources in Lafayette, California. He is also a member of LCGC’s editorial advisory board. Direct correspondence about this column via e-mail to LCGCedit@ubm.com

Polysorbate Quantification and Degradation Analysis via LC and Charged Aerosol Detection
April 9th 2025Scientists from ThermoFisher Scientific published a review article in the Journal of Chromatography A that provided an overview of HPLC analysis using charged aerosol detection can help with polysorbate quantification.
Removing Double-Stranded RNA Impurities Using Chromatography
April 8th 2025Researchers from Agency for Science, Technology and Research in Singapore recently published a review article exploring how chromatography can be used to remove double-stranded RNA impurities during mRNA therapeutics production.


