Targeted Quantitative Protein Analysis in Human Serum Using High-Resolution Multiple Selected Reaction Monitoring Assays
Special Issues
A common endpoint for a biomarker discovery experiment is a list of putative marker proteins. The next step is then to perform targeted quantitative measurements of these proteins in an expanded patient population to assess their validity as markers. Analytical accuracy and precision are required for unambiguous quantitative analysis of targeted proteins from very complex mixtures. Wide dynamic range and high sensitivity are critical for detecting low-abundance proteins. Such an assay also is appropriate for "targeted discovery" experiments, where the goal is to quantitate a large number (up to hundreds) of known proteins in a complex sample.
A common endpoint for a biomarker discovery experiment is a list of putative marker proteins. The next step is then to perform targeted quantitative measurements of these proteins in an expanded patient population to assess their validity as markers. Analytical accuracy and precision are required for unambiguous quantitative analysis of targeted proteins from very complex mixtures. Wide dynamic range and high sensitivity are critical for detecting low-abundance proteins. Such an assay also is appropriate for "targeted discovery" experiments, where the goal is to quantitate a large number (up to hundreds) of known proteins in a complex sample.
One approach for this strategy is the use of tandem mass spectrometry (MS-MS) to monitor a unique peptide (or peptides) for each protein of interest by a selected reaction monitoring (SRM) assay, or by simultaneous analysis of many peptides by a multiple selected reaction monitoring (mSRM) assay. This approach can be extended further to provide absolute quantitation of targeted proteins by incorporation of appropriate stable isotope–labeled peptides as internal standards. While mSRM assays are sensitive for targeted peptides, in a complex matrix, such as human serum, analyte selectivity can become a major issue. It is often difficult to differentiate between the targeted peptide signal and matrix background, particularly when quantifying multiple very low abundance proteins. High-resolution SRM (h-SRM) capability helps to resolve this problem and increase assay specificity.
This article demonstrates the highly sensitive and accurate multiple protein quantitation from human serum by using high-resolution multiple selected reaction monitoring (h-mSRM) on a TSQ Quantum mass spectrometer (Thermo Scientific). An h-mSRM assay was developed for detecting 53 targeted proteins in human serum by using both unit mass resolution and high resolution (0.2 FWHM) for the Q1 quadrupole. The sensitivity, reproducibility, dynamic range, and overall performance advantages of h-mSRM assays were evaluated. Additionally, a specific h-mSRM assay was developed for detecting a known biomarker (IL-6) from human serum.
Goal
Develop a fast, robust method for accurate, quantitative analysis of many targeted proteins in complex mixtures by using high-resolution triple-quadrupole MS.
Experimental Conditions Sample Preparation
Whole human serum and interleukin-6 were used. The serum was diluted 40 times with 6 M guanidine. A 1-mL volume of the diluted human serum sample and 10 μg of IL-6 were reduced and S-carboxymethylated, exchanged into 100 mM ammonium bicarbonate buffer and enzymatically digested separately. The digested mixtures were dried with a SpeedVac device (Thermo Scientific) and reconstituted with 200 μL water containing 0.1% trifluoroacetic acid.
Peptide Selection and mSRM Transition Selection
Figure 1 shows two basic approaches for peptide selection and mSRM transition design. If the targeted protein had been detected in previous liquid chromatography–mass spectrometry–mass spectrometry (LC–MS-MS) experiments, the peptides were selected for the mSRM assays if: they had been detected repeatedly from these experiments; were unique for one single protein; contained no Cys, Met, or other commonly modified residues; and had proper mass range (600–2000 MW). Usually, multiple fragment ions for each selected peptide were used to maximize specificity.

Figure 1
If no LC–MS-MS data were available for the targeted protein, Protetypic Peptide Profiling (P3) software (University of Washington) was used to predict candidate peptides and multiple fragment ions for SRM assay design (Figure 2). The P3 predictor software takes amino acid sequences of targeted proteins of interest and performs in silico digestion. Peptides that contain no Cys, Met, His, NxS(T) modification, R-P, or K-P, and meet user-defined peptide length criteria will be listed as candidate peptides. A user selects one or multiple candidate peptides from the list, and the software will predict Q1 and Q3 SRM transitions automatically with proper collision energies and add them to an output CSV file, which the mass spectrometer can accept directly. In our experiments, for the 53 major serum proteins, 103 SRM transitions (Figure 3) were used based upon previous work by Anderson and colleagues (1). Six SRM transitions (560.82/616.38, 560.82/731.41, 560.82/844.49, 663.36/698.42, 663.36/812.46, and 663.36/1012.54) were used for interleukin-6 based upon the P3 predictor software. The collision energies were assigned by using the standard formula of CE = 0.034 × m/z + 3.314.
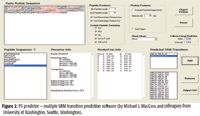
Figure 2
LC Separation and MS Analysis
High Performance Liquid Chromatography (HPLC)
A 100 mm × 75 μm PicoFrit C18 column (New Objective, Inc., Woburn, Massachusetts) was used for peptide separation. A Surveyor MS Pump (Thermo Scientific) was used to produce and deliver a solvent gradient (A: 0.1% formic acid, 2% acetonitrile, 98% water; B: 0.1% formic acid, 99.9% acetonitrile) to the column by means of a flow splitter. The postsplitter flow rate was 300 nL/min. The linear ramp was from 2% B to 50% B in 85 min. Samples were loaded directly onto the column by a Micro AS autosampler (Thermo Scientific) after the flow splitter. The sample loading rate was 5 μL/min and loading time was 15 min.
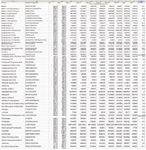
Figure 3: Multiple SRM assays and reproducibility for 53 major serum proteins with TSQ Quantum Ultra.
MS
A TSQ Quantum Ultra mass spectrometer with an Ion Max source equipped with a nanoflow column adapter (New Objective, Woburn, Massachusetts) was used.
For SRM setup:
SRM setup 1: Q1, 0.7 FWHM; Q3, 0.7 FWHM
SRM setup 2: Q1, 0.4 FWHM; Q3, 0.7 FWHM
SRM setup 3: (h-SRM): Q1, 0.2 FWHM; Q3, 0.7 FWHM
Q2: 1.5 mtorr (Ar)
Scan width: 0.002 m/z
Scan time: 20 ms and 2 ms
For SRM-triggered MS-MS setup:
Scan Event 1
Q1 and Q3: 0.7 FWHM; Q2: 1.5 mtorr;
scan width: 0.002 m/z; scan time: 20 ms
Scan Event 2
DD precursor mass from Scan Event 1; Q1, 0.7 FWHM;
signal threshold 30,000 counts
Q2: 1.5 mtorr, CE: 0.034 × precursor mass m/z + 3.134;
Dynamic Exclusion settings: repeat, 1; duration, 30 s;
exclusion time, 30 s; exclusion list size, 50.
Results
Quantitative Results for 53 Targeted Major Serum Proteins
A total of 103 unique SRM transitions were chosen as proteotypic peptides for the 53 targeted proteins of interest. Using identical human serum samples, five nanoflow LC–MS-MS experiments were performed for each sample, with the same 103 SRMs monitored with different resolutions (0.2, 0.4, and 0.7 FWHM) and Q2 dwell times (2 and 20 ms). The high-resolution SRM assays (Q1: 0.2 FWHM) gave the best results and clearly resolved targeted analyte transitions from interference peaks that were seen at lower Q1 resolutions. Figure 4 shows one example in which high resolution was used to unambiguously detect peptide QGFGNVATNTDGK (representing fibrinogen beta chain). Importantly, it should be noted that 0.2 FWHM data revealed the presence of significant matrix interference in 25% of the SRM transitions that were monitored. The 103 SRMs were detected with enough scans for reliable quantitation using both 2-ms and 20-ms scan times, although the 2-ms scan time gave twice as many scans with only a minor decrease in signal intensity (Figure 5). For narrow peak widths, such as those associated with ultrahigh-pressure LC, 2-ms scan times will be required.
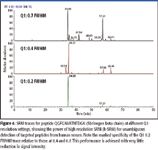
Figure 4
For testing this method's reproducibility, the same h-mSRM experiment at Q1: 0.7 FWHM and 20 ms scan time was repeated six times, and the results are summarized in Figure 3. Among the 53 targeted proteins, 51 proteins produced acceptable quantitative data, while only two were not observed reliably. For the whole serum digests, CVs (n = 6) were from 5–26% (50% of SRMs had CVs 10%).
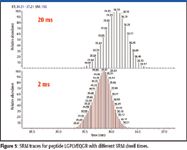
Figure 5
Proteins present at concentrations down to microgram-per-milliliter levels, such as L-selectin and fibronectin (1), were reliably detected, yielding a dynamic range of greater than four orders of magnitude (from lowest peak areas of 6 × 10⁴ from fibrinogen beta chain to the highest peak areas of 6 × 10⁸ from albumin peptide) in a single experiment. MS-MS spectra were acquired once the SRM intensity exceeded 30,000 counts and typically were of good quality and showed rich y series and some b series fragment ions, permitting database searching with SEQUEST (University of Washington) in BioWorks 3.3 (Thermo Fisher Scientific) (Figure 6).
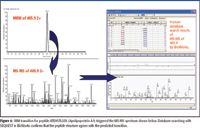
Figure 6
Detection Limit and Linear Dynamic Range of IL-6, Using h-mSRM Assays Developed with P3 Predictor
An IL-6 digest mixture was spiked into human serum to create a dilution series, and was run sequentially to evaluate the detection limit and linearity of the h-mSRM assay. Excellent analytical sensitivity and linearity were seen (Figure 7). The linear dynamic range for spiked IL-6 was over four orders of magnitude (0.02–400 fmol on column) and the limit of detection was 20 amol on column with an S/N of 22.
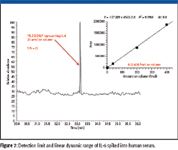
Figure 7
Conclusion
An h-mSRM–based assay for targeted proteins in human serum was developed on a triple quadrupole mass spectrometer. A total of 103 SRM transitions were monitored for the quantitation of 53 serum proteins. One exogenous protein, IL-6, was spiked to evaluate assay performance. Several unique features contributed to the specificity, sensitivity, and robustness of this assay:
- Q1 resolution of 0.2 FWHM dramatically reduced nonspecific matrix interference from the serum background, dramatically improving assay specificity. At Q1 resolution of 0.4 or 0.7 FWHM, significant interference was seen in 25% of targeted transitions.
- Analytical assay performance was excellent: %CV varied from 5–26%, with 50% of protein CVs < 10%; Peptide response was linear over four orders of magnitude; Sensitivity was excellent, with the ability to detect proteins present at microgram-per-milliter levels and to detect IL-6 at levels as low as 20 amol on column.
- SRM-triggered MS-MS spectra were of good quality and in most cases sufficient to permit confirmation of peptide ID by database searching with SEQUEST.
Reiko Kiyonami, Scott Peterman, and Ken Miller are with Proteomics Marketing, Thermo Fisher Scientific, San Jose, California.
References
(1) L. Anderson and C.L. Hunter, Mol. Cell. Proteom. 5.4, 573–588 (2006).
(2) Michael J. MacCoss et al., private communication (2006).
Accelerating Monoclonal Antibody Quality Control: The Role of LC–MS in Upstream Bioprocessing
This study highlights the promising potential of LC–MS as a powerful tool for mAb quality control within the context of upstream processing.
Common Challenges in Nitrosamine Analysis: An LCGC International Peer Exchange
April 15th 2025A recent roundtable discussion featuring Aloka Srinivasan of Raaha, Mayank Bhanti of the United States Pharmacopeia (USP), and Amber Burch of Purisys discussed the challenges surrounding nitrosamine analysis in pharmaceuticals.

.png&w=3840&q=75)

.png&w=3840&q=75)


.png&w=3840&q=75)


.png&w=3840&q=75)


