The Role of Spectral Accuracy in Mass Spectrometry
Special Issues
The ability to perform accurate mass measurements in mass spectrometry (MS) for elemental composition determination (ECD, also known as formula identification) provides a powerful tool for assisting in the identification of unknown compounds. Recent advances in data processing methods have demonstrated the ability to obtain mass accuracy in the 5–10 ppm range on routine single- and tandem-quadrupole systems (1,2), sufficient to assist in the formula identification. However, even on more expensive high-resolution systems such as quadrupole time-of-flight (qTOF) or Fourier transform (FT)–MS instruments that are capable of routinely measuring mass accuracy in the 1–3 ppm range, the formula identification is not unique, particularly for higher molecular weight compounds. By calibrating instruments to obtain high spectral accuracy as well as mass accuracy, the ability to unambiguously identify the formula is improved substantially, particularly on low-resolution systems.
The ability to perform accurate mass measurements in mass spectrometry (MS) for elemental composition determination (ECD, also known as formula identification) provides a powerful tool for assisting in the identification of unknown compounds. Recent advances in data processing methods have demonstrated the ability to obtain mass accuracy in the 5–10 ppm range on routine single- and tandem-quadrupole systems (1,2), sufficient to assist in the formula identification. However, even on more expensive high-resolution systems such as quadrupole time-of-flight (qTOF) or Fourier transform (FT)–MS instruments that are capable of routinely measuring mass accuracy in the 1–3 ppm range, the formula identification is not unique, particularly for higher molecular weight compounds. By calibrating instruments to obtain high spectral accuracy as well as mass accuracy, the ability to unambiguously identify the formula is improved substantially, particularly on low-resolution systems.
Mass spectrometry (MS) is a powerful and sensitive tool for identifying unknown compounds by virtue of its ability to "weigh" ion fragments and relate them back to the compound of interest. The approach commonly used in gas chromatography (GC)–MS utilizes an energetic ionization method (such as electron ionization), which causes the parent compound to break into multiple fragment ions. Comparing the fragment pattern with measured libraries of compounds helps identify the chemical formula and possibly the chemical structure. In liquid chromatography (LC)–MS, the common ionization approach (electrospray) is quite gentle and typically only produces a single parent ion. MS-MS can be used in a tandem system to help identify the compounds, or if more expensive equipment is accessible, accurate mass measurements alone can identify likely formula candidates. In the case of MS-MS, they can identify the fragment ions uniquely to assist in deducing structural information.
To date, all of these approaches rely solely on the mass spectrometer's ability to provide nominal or accurate mass information on the ions being analyzed. For the most part, the spectral patterns of the ions produced by isotopes have been used only in a secondary fashion, if at all, to assist in the role of compound identification. The most common use of the spectral patterns is to measure the ratios of the intensity of the monoisotope peak to the M+ peaks, to assist in determining approximate carbon/hydrogen ratios, and to identify the presence of elements with unique isotope patterns, such as chlorine. However, if one carefully examines the theoretical patterns produced by a given ion, it proves to be a powerful discriminator for uniquely identifying the chemical formula. The difficulty, however, lies in the need to be able to accurately model the measured isotope patterns to the theoretical patterns to the level of accuracy required to uniquely identify different chemical compositions. In many cases, this can be as small as a few tenths of a percent, far below the variation from one MS instrument to another of even the same model or on the same instrument at different times due to the different or changed mass spectral lineshapes.

Formula Identification
Analysts go to great lengths to attain accurate mass measurements for compound identification, including the use of expensive and exotic instruments and elaborate calibration approaches. But even in cases in which very high mass accuracy is obtained (<3 ppm), there can still be a substantial number of formula candidates for consideration. If the instrument data could somehow be calibrated for spectral accuracy as well, this would provide another powerful and complementary metric for compound identification. The authors have shown previously that the mass accuracy of routine instruments (for example, single- and tandem-quadrupole instruments) can be improved substantially by utilizing a unique mathematical approach to mass spectral data calibration (1,2). This same calibration approach accurately and reproducibly calibrates the spectral lineshapes as well, allowing the measured spectral profiles to be accurately matched to the theoretical spectra. The calibration for spectral accuracy in combination with the calibration for mass accuracy allows both accurate mass and accurate spectral profile information to be used for identifying unknown compounds. Mass accuracy and spectral accuracy can be used to increase substantially the confidence of chemical formula identification in MS.
Calibrating for Spectral Accuracy
Conventional MS calibration considers calibration for mass accuracy only. One major source of error with mass-only calibrations concerns the difficulty in accurately locating the monoisotope peak due to the asymmetry of the peak and the presence of noise. The authors previously have shown a new approach to calibration in which both the mass accuracy and the peak shape function are simultaneously calibrated (1,2). One of the features of this method is that in addition to calibrating the mass axis (mass accuracy), the spectral lineshapes are corrected to a known mathematical lineshape (spectral accuracy). The process of lineshape calibration is outlined in Figure 1. In summary, the mass spectrum is calibrated using a mathematically defined lineshape. Because the lineshape is now a known function, the theoretical spectrum of the possible formula candidates now can be calculated easily and directly compared to the calibrated mass spectrum. The authors call this method of comparison calibrated lineshape isotope profile search (CLIPS), which is illustrated in detail in Figure 1. The comparison results in the measurement of the root mean square error (RMSE), which is expressed as the percent spectral accuracy ([1 – RMSE] × 100).
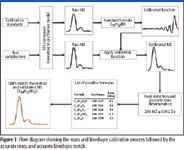
Figure 1
Sample Applications
Single-Quadrupole LC–MS for Pure Compound Identification
In this example, the user needs to identify small molecule pharmaceuticals rapidly and accurately. To show feasability, two commercially available compounds with nominal m/z at 260 and 280 Da were dissolved into a 1:1 (v/v) water–methanol mixture at a 2.5 μM concentration. The 280 Da ion with a known elemental composition of C19H22NO+ was used as the only internal calibration ion to determine the m/z of the 260 Da ion accurately enough for elemental composition determination. This binary mixture was infused into an Agilent MSD LC–MS system (Wilmington, Delaware) for a short duration of ~1 min with a syringe pump at a flow rate of 1 mL/min.
Repeated MS scans were acquired in scan mode over a mass range of 200–500 m/z with peak width setting at 0.05 min. An Agilent 1100 LC/MSD (G1946D) system was operated with an atmospheric-pressure chemical ionization (APCI) source and ChemStation Rev. A 09.03 [1417] software. The ion-counting threshold was set at zero with either 0.1 or 0.05 Da as the step size to allow for continuum profile mode data acquisition required of this analysis.
The profile mode mass spectra of the binary mixture were acquired continuously for 1 min during the infusion process with a total of 62 scans. The spectral calibration was created from the average of the mass spectral scans within a given time window between 0.2 and 0.9 min, as shown in Figure 2. The calibration was performed using the whole isotope envelope of the calibration ion C19H22NO+ near 280 Da. As mentioned previously, this calibration process calibrates both the mass and the mass spectral peak shape function, which is key for achieving high mass accuracy. The calibration was then applied to each full MS scan to transform each raw mass spectrum into its calibrated version with a mathematically defined symmetric peak shape located at accurate mass values. Peak detection can then be applied to calculate the m/z location of the 260 Da ion reliably and accurately for the purpose of elemental composition determination. The highly accurate m/z value thus obtained for the 260 Da ion can now be used to find a limited number of formulas within a small mass tolerance window, for example, ±5 mDa. The list of possible formulas is further refined and greatly shortened through the calculation of the spectral accuracy metric.
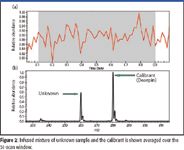
Figure 2
Results
All calibrations and calculations were performed using MassWorks software (Cerno Bioscience, Danbury, Connecticut). For the calibration ion shown in Figure 3, the raw mass spectral response (black) has a peak shape function of no particular given form and is typically nonsymmetrical, regardless of how carefully the mass spectrometer has been tuned, making peak detection and accurate monoisotopic mass determination difficult, if not impossible. After calibration (red, in Figure 3), the calibrated lineshape now has a symmetrical and mathematically definable peak shape, allowing for easy peak detection and accurate mass calculation. As a check on the calibration process itself, the mass error after calibration is at 0.2 mDa or 0.6 ppm. A true test of calibration mass accuracy would be to analyze the 260 Da ion, which is not used as one of the calibration ions.
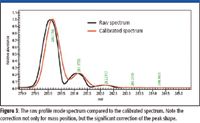
Figure 3
To assess the suitability of this approach for applications at real chromatographic time scale, only eight scans from scan 15 to 22 (lasting less than 7 s) are selected for accurate mass analysis. The same peak shape calibration and accurate mass determination have been performed, giving accurate mass readings of 260.1635 Da for the M ion, 261.1657 Da for the M+1 ion, and 262.1862 Da for the M+2 ion.
With the mass accurately determined, an elemental composition search can be performed in the same fashion as has been done with accurate mass from high resolution systems such as time of flight (TOF), quadrupole time of flight (qTOF), Fourier transform (FT)-MS, or Orbitrap, including common elements C, H, N, O, and S as possible elements and generic upper bounds as shown in Table I. With a tight mass tolerance of ±5 mDa, seven possible formulas are found (Table I). When sorted by mass accuracy, the correct formula ranks as the third hit on the list with -1.3 mDa or 5.2 ppm mass error. If the elemental composition is determined based on accurate mass measurement alone, the wrong formula C8H26N3O4S+ would have been proposed, which has the smallest mass error at -0.7 mDa or 2.7 ppm.
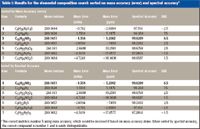
Table I: Results for the elemental composition search sorted on mass accuracy (error) and spectral accuracy
This ambiguity can be solved elegantly with the comprehensive calibration performed here. It is known that different elemental compositions generate not only different monoisotopic masses but also different isotope distributions. The difference in isotope distribution has been very hard to detect due to the typically unknown mass spectral peak shape functions, even for high-resolution data where M, M+1, M+2, and so forth are well separated. With the comprehensive calibration performed here that elaborately involves peak shape calibration as part of the calibration process, small differences in isotope distribution arising from different elemental compositions can be assessed with a unique level of accuracy through CLIPS, even at unit mass resolution where M, M+1, M+2, and so forth are overlapped partially. For each formula on the list in Table I, a theoretically expected isotope profile or envelope can be calculated that conforms to the same peak shape function into which the raw mass spectrum in Figure 3 has been calibrated. A quantitative match can then be performed between the calibration raw mass spectrum and each of the calculated isotope envelopes, resulting in a residual measure reflecting the goodness of fit between the calibrated mass spectrum and the theoretically calculated isotope envelopes. The residual is presented as mass accuracy %, or (1 – RMSE) × 100 where RMSE is the residual error from the match. Hence, a value of 100 (RMSE = 0) would be a perfect match. Results for the elemental composition search sorted on mass accuracy (error) and spectral accuracy. The correct match is number 3 using mass accuracy, which would be incorrect if based upon mass accuracy alone. When sorted by spectral accuracy, the correct compound is number 1 and is easily distinguishable. Table I shows the same list of formulas after sorting by this metric. It is now clear that the correct formula has the best match at 99.62% while all other formulas have residuals at least 1.7 times higher than that, demonstrating the high differentiating power of CLIPS. Figure 4 shows the calibrated mass spectrum overlaid with the isotope envelope theoretically calculated for the correct formula C16H22NO2+, demonstrating the level of spectral accuracy attainable through MassWorks calibration.
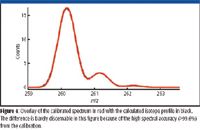
Figure 4
Application to GC–MS
In the previous example, an internal standard close in mass to the sample ion was used, which provides an optimum situation for accurate calibration. For LC–MS and GC–MS it is not always possible to use an internal calibration standard; therefore, an external standard must be used. In this GC–MS application example, an external calibration standard (PFTBA) is used to calibrate the full MS spectral range from 50 to 550 m/z and then applied to a separately measured run of pesticides, including PCB 209 at approximately 50 ng/μL (decachlorobiphenyl, C12Cl10).
The PFTBA standard was acquired in "raw" mode (non-peak detected) at a scan speed 2^2 (A/D samples = 4) over a mass range of 50–550 m/z. The profile mode mass spectra of the PFTBA calibration standard were acquired continuously for 5 min during the infusion process while the control valve was at the ON position. Similarly, during the separate GC–MS sample analysis, the profile mode mass spectral scans were collected repeatedly during the GC separation process for a total runtime of 19 min. The calibration was created from the average of the PFTBA mass spectral scans within a given time window.

Table II: PFTBA calibration ions used for calibration
Results
All calibrations and calculations were performed using MassWorks software. A total of 12 ions including the molecular ion of PFTBA were selected for the calibration. Their elemental compositions and theoretically calculated exact masses are listed in Table II. The average of scans 80–131 was used to build the calibration, which in turn was applied to all the scans to check for the mass accuracy within this run itself. Table II lists the calculated masses and mass errors for all 12 calibration ions for the calibration scans (acquired early in the run) as well as for test scans (acquired later in the run). The calibration mass errors are all within 0.5 mDa, whereas the test mass errors are all within 2.4 mDa.
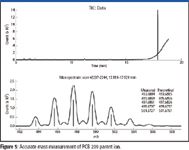
Figure 5
Although the results in Table II show good mass accuracy on the calibration ions themselves over a 5-min time period, a more stringent test would be to apply this calibration to other MS scans from a different run, preferably on a true chromatographic time scale. The GC–MS analysis of the pesticide mixture will serve as a true test of mass spectral calibration and its applicability across different runs and on ions other than the calibration ions on a real chromatographic time scale. Figure 5 shows the accurate masses reported for the average of eight mass spectral scans corresponding to the chromatographic elution profile of PCB 209. As can be seen, the reported accurate masses all come within 4 mDa of the theoretical masses calculated from its elemental composition. While this molecular ion is known and can be verified easily with certainty, the identification of some of its EI fragments is more interesting. For the ion fragment around 424 Da, the accurate mass for the monoisotopic mass is reported as 423.7428 Da. An elemental composition search with C, H, N, O, and Cl as possible elements lists C12Cl8+ (exact mass at 423.7503 Da) as the 17th candidate with -7.5 mDa mass error. When the whole isotope cluster is taken into consideration in CLIPS, however, it becomes obvious that C12Cl8+ is the only correct ion formula for this fragment (Figure 6), in spite of its somewhat larger mass measurement error.
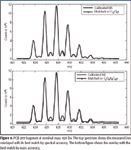
Figure 6
To demonstrate the application of accurate mass measurement for the identification of compounds, a section toward the end of the GC–MS run is averaged before accurate mass measurement to help identify possible GC column materials bleeding out of the system. Figure 7 (top) shows a section of the averaged mass spectrum that is correlated with the rise in total ion signal. With the accurate masses identified, a CLIPS elemental composition determination with possible elements C, H, N, O, and Si reveals a few possible candidates with their theoretical isotope patterns shown in Figure 7 (bottom). This list of possible candidates can be further refined based upon the knowledge of column chemistry to further the understanding of column bleeding.
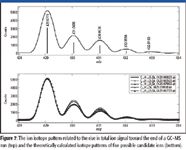
Figure 7
Conclusion
Mass accuracy alone cannot always uniquely identify elemental composition, even at very high mass accuracy (<3 ppm). With the ability to calibrate mass spectral lineshapes, a new metric, spectral accuracy, can be used to further discriminate between possible formula candidates. Using mass accuracy and spectral accuracy in combination allows for a much higher level of confidence for formula identification, even on instruments previously only considered capable of unit resolution measurements, such as quadrupole instruments.
Don Kuehl is Vice President, Marketing and Product Development, and Yongdong Wang is Founder and President, Cerno Bioscience, Danbury, Connecticut.
References
(1) M. Gu, Y. Wang, and D. Kuehl, Current Trends in Mass Spectrometry, May, 22–26 (2005).
(2) M. Gu, Y. Wang, X. Zhao, and Z. Gu, Rapid Commun. Mass Spectrom. 20, 764–770 (2006).

University of Rouen-Normandy Scientists Explore Eco-Friendly Sampling Approach for GC-HRMS
April 17th 2025Root exudates—substances secreted by living plant roots—are challenging to sample, as they are typically extracted using artificial devices and can vary widely in both quantity and composition across plant species.
Thermodynamic Insights into Organic Solvent Extraction for Chemical Analysis of Medical Devices
April 16th 2025A new study, published by a researcher from Chemical Characterization Solutions in Minnesota, explored a new approach for sample preparation for the chemical characterization of medical devices.


