Empirical Formula Prediction Using MS and MSn Spectra and Isotope Modeling
Special Issues
High mass accuracy is achievable on a number of mass spectrometry (MS) instrument platforms, including time-of-flight (TOF) mass analyzers, hybrid TOF systems (ion trap and quadrupole), and Fourier transform (FT) mass analyzers (Orbitrap and FT–ion cyclotron resonance [ICR]). Such technologies are playing an increasing role in drug characterization and metabolite identification groups to help identify or confirm empirical formulae assignments. Recently, software has been developed to match theoretical isotopic distributions and mass accuracy data with experimentally derived information, which combine sets of chemical or statistical rules to help increase the probability of assigning the correct empirical formula. In this article, we describe the use of empirical formula prediction software (Formula Predictor, Shimadzu, Manchester, UK) that takes into account MS and MSn spectra information with high mass accuracy and mass resolution to characterize a variety of sample types including unknown chemical entities (1) as well as natural products such as catechins in green tea.
Experimental
Sample preparation: One commercial green tea bag was boiled for 2 min in 250 mL water. After cooling, the tea solution was divided equally and loaded on six preconditioned solid-phase extraction (SPE) columns (Supelco Supelclean LC-18, 3 mL, Bellefonte, Pennsylvania). The SPE columns were conditioned first with three 3-mL rinses of methanol followed by five rinses of 3 mL of water. After the samples were loaded, each column was rinsed three times with 3 mL of water. The polyphenols were then eluted with 833 μL of extraction solvent, 70:29.5:0.5 acetone–water–acetic acid, and the six fractions were pooled to give a total volume of ~5 mL. The solution was centrifuged for 5 min at 7000 rcf, and a 1:10 dilution was used as the final working solution.
LC–MS analysis was carried out on an LCMS-IT-TOF system equipped with a Prominence LC system (both from Shimadzu). LC conditions included the use of a 150 mm × 2.0 mm Shim-pack VP-ODS C18 column (Shimadzu). Mobile phase A was composed of 0.5% acetic acid in water and B of 0.5% acetic acid in acetonitrile. The flow rate was 200 μL/min. The gradient elution time program was as follows: 5–12% B (0–5 min); 12–40% B (5–30 min); 40–70% B (30–35 min); 70% B (35–36 min); 70–5% B (36–38 min); 5% B (38–42 min).
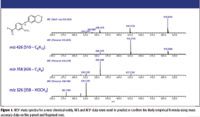
Figure 1
MS conditions included the following: (-) ESI; CDL temperature, 200 °C; block heater temperature, 200 °C; nebulizing gas flow, 1.5 L/min; scan range, 100–1500 m/z; ion accumulation time, 30 ms. CID experiments utilized argon gas for ion cooling and collisions.
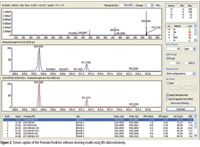
Figure 2
Results and Discussion
The formula prediction software was developed to support three stages of data processing. In stage 1, the MS spectrum data provides the molecular ion (or adduct) and mass accuracy information. At this stage, conventional filters also are applied, such as limiting the possible elements, the use of adducts, mass tolerance filtering, and other chemical rules such as the use of the nitrogen rule, double bond equivalency (DBE) range, and hydrogen to carbon ratio (H:C) (Figures 1 and 2). In stage 2, the MSn data provide the fragment ions for the parent molecular ion, and the software subsequently calculates the theoretical complement ion for each of the associated fragment ions. Stage 2 allows for the exclusion of invalid formulas based on the fragment ion data. This exclusion process is applied recursively throughout the various stages of MSn data — the elemental composition of MSn fragment ions filters the MSn–1 precursors' possible formulas, and the process continues back to the MS1 molecular ion (Figure 3). Mass accuracy and mass resolution are key parameters in identifying the correct empirical formula, but to increase the reliability of the candidate list, the experimentally derived MS data also is compared to the theoretical isotope pattern to provide an Iso score.
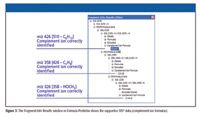
Figure 3
In stage 3, the theoretical isotopic distribution profile spectra for each of the generated formulae are produced. The experimental data is then compared with the theoretical distributions and a least squared fitting routine is applied. A likelihood scoring algorithm takes into account the closeness of fit to the theoretical isotope data, the variation in mass accuracy, and the candidate list filtered using MSn fragment data. A log transformation ranking score is reported that lists more probable candidates with a higher score in the 0–100 range (Figure 4).
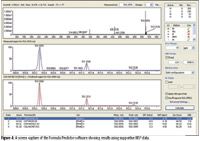
Figure 4
As an example of the use of the formula prediction software in the complex mixtures often associated with natural product samples, we analyzed an extract of green tea. The polyphenols or catechins in green tea are thought to possess many health benefits. These species possess antioxidative activity and also are thought to have chemopreventive effects against certain cancers. The antioxidative activity of catechins, for example, is theorized to help improve hypertension, reduce inflammation, and improve cognitive dysfunction in the elderly.
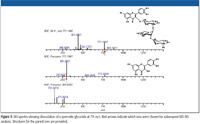
Figure 5
In Figure 5, the fragmentation spectra for a polyphenol at m/z 771 is shown, and characteristic loss of the sugar groups is observed. Subjecting the data to the Formula Predictor software results in a list of three possible empirical formula candidates, all of which meet the filtering criteria (Figure 6), and from which the compound listed as 1 later was confirmed to be the correct identification. The analysis of this class of compounds will continue to grow in importance and complexity as additional individuals and companies (particularly those in the nutraceutical industry) discuss the potential health benefits of naturally occurring substances.
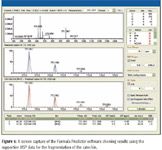
Figure 6
Conclusions
Current tools used to predict empirical formula from accurate mass data typically consider known chemical rules and isotope fitting routines. The formula prediction software used in this study combines MSn fragmentation data with mass accuracy information to quickly identify the formula of unknown compounds.
Joy M. Ginter, Joseph P. Fox, Holly M. Shackman, and Robert J. Classon are with Shimadzu Scientific Instruments, Columbia, Maryland.
References
(1) S. Ashton, R. Gallagher, N. Loftus, J. Warrander, I. Hirano, S. Yamaguchi, and N. Mukai, "Isotope Modeling Routines Applied to Empirical Formula Prediction," Proceedings of the 54th Conference on Mass Spectrometry and Allied Topics, Seattle, Washington, May 28–June 1, 2006.

Understanding FDA Recommendations for N-Nitrosamine Impurity Levels
April 17th 2025We spoke with Josh Hoerner, general manager of Purisys, which specializes in a small volume custom synthesis and specialized controlled substance manufacturing, to gain his perspective on FDA’s recommendations for acceptable intake limits for N-nitrosamine impurities.
University of Rouen-Normandy Scientists Explore Eco-Friendly Sampling Approach for GC-HRMS
April 17th 2025Root exudates—substances secreted by living plant roots—are challenging to sample, as they are typically extracted using artificial devices and can vary widely in both quantity and composition across plant species.
Determining the Serum Proteomic Profile in Migraine Patients with LC–MS
April 17th 2025Researchers used liquid chromatography–mass spectrometry (LC–MS) in their proteomic analysis to compare the serum proteome of migraine patients with healthy controls and to identify differentially expressed proteins as potential migraine biomarkers.


