A New Tool for Mass Analysis of Unknown Molecules: High-Resolution Multistep Tandem MS with Wide Dynamic Range Quantitative Analysis
Special Issues
Mass spectrometers are effective for identifying and quantifying unknown molecules, such as disease-related proteins and small molecules in pharmaceutical research and medical diagnosis. In addition, mass spectrometry (MS) can be particularly powerful when analyzing molecules with complex structures, such as posttranslationally modified proteins. Among various MS approaches, high-resolution multistep tandem MS (MS-MS) is an emerging methodology for accurate identification of complex molecules. In this article, we describe a new approach for mass analysis with enhanced quantitative capability combined with high-resolution multistep MS-MS, where the dynamic range of quantitation covers four orders of magnitude.
Mass spectrometers are effective for identifying and quantifying unknown molecules, such as disease-related proteins and small molecules in pharmaceutical research and medical diagnosis. In addition, mass spectrometry (MS) can be particularly powerful when analyzing molecules with complex structures, such as posttranslationally modified proteins. Among various MS approaches, high-resolution multistep tandem MS (MS-MS) is an emerging methodology for accurate identification of complex molecules. In this article, we describe a new approach for mass analysis with enhanced quantitative capability combined with high-resolution multistep MS-MS, where the dynamic range of quantitation covers four orders of magnitude.
Mass spectrometry (MS) is used widely to identify and quantify unknown molecules in a broad range of applications, such as pharmaceutical development and medical diagnosis. To clarify disease mechanisms, for example, MS is used to search for disease-related molecules, or biomarker molecules, such as proteins and metabolites. For such study of biomarker molecules, both qualitative and quantitative approaches are important; qualitative analysis discovers and identifies the structure of biomarker molecules, and quantitative analysis typically compares the amount of biomarkers in disease-state and healthy-state samples. Research on currently unidentified or unknown molecules relevant to specific biological and chemical functions of importance would be most effective when these qualitative and quantitative approaches are consolidated.
For the analysis of unknown molecules, ion traps and time-of-flight (TOF) mass analyzers are used widely because of their high speed in acquiring full mass spectra, thus facilitating discovery and identification of new biomarker candidates. Although ion trap analyzers have moderate mass accuracy, mass resolution, and quantitative dynamic range, they are unique in their ability for multistep MS-MS (MSn), which is advantageous in extracting molecular structure information on small molecules and posttranslational modified proteins (1–4). TOF mass-analyzers, on the other hand, are superior in mass accuracy, mass resolution, and quantitative dynamic range. Compared to ion traps, TOF analyzers offer higher mass accuracy and a wider dynamic range, which is advantageous for accurate determination of elemental composition of molecules.
An emerging new approach in the mass analysis of unknown molecules is a combination of the best of these two mass analyzers: high-resolution multistep MS-MS (5–14), which is a hybrid of an ion trap and a TOF mass analyzer. This hybrid system offers high mass resolution, quantitative dynamic range, and MSn capability (14–17).
Instrument Design
Figure 1 shows schematically the structure of the high-resolution multistep tandem mass spectrometer (NanoFrontier LD, Hitachi High Technologies America, San Jose, California), which is a liquid chromatography (LC)–MS system in which the mass spectrometer is a hybrid linear-ion-trap (LIT) TOF mass analyzer (14).
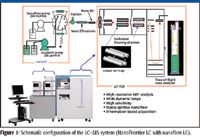
Figure 1
To optimize the TOF analyzer design for increased dynamic range, the TOF analyzer is coupled in an orthogonal arrangement relative to the LIT, so that the TOF response is highly linear to the sample concentration over a wide range. An important device for this orthogonal arrangement is a collisional-focusing chamber placed between the LIT and the TOF, in which the ion beam is focused into the TOF by a quadrupole ion-guide under collision with buffer gas. This region also can be used as a dissociation chamber.
In the MS1 mode, ions that are created in the ion source are transferred to the TOF analyzer through LIT. In the MS2 and MS>2 modes, the precursor ions are first isolated in the LIT and dissociated either in the LIT or in the collisional-focusing chamber.
In addition to the TOF analyzer arrangement, data-acquisition electronics that convert the ion signal to a mass spectrum are important in obtaining a wide dynamic range. For example, response saturation during data acquisition can result in decreased dynamic range performance. Conventional time-to-digital conversion (TDC) data-acquisition electronics are prone to this saturation because TDC has a dead time after an ion arrival at the detector. During this dead time, TDC cannot detect subsequent ion arrival, resulting in saturation during high ion intensity. To eliminate this saturation limit by TDC, the MS system is equipped with 2-GHz analog-to-digital conversion (ADC) data-acquisition electronics, which convert full temporal train of detector signal to digital without a conversion dead time. The result is a higher resistance to detector saturation and improved dynamic range compared with TDC.
The LC system for the MS system can either be a semimicro flow LC or a nanoflow LC (nanoLC) system, depending upon application. The nanoflow LC system is uniquely suited to the quantitative analysis of proteins because of its accurate reproducibility in chromatographic retention time for trace samples. It is capable of gradient flow at 50–250 nL/min rates with high stability and high reproducibility even at 50 nL/min, which is achieved by a splitless gradient mechanism called dual exchange gradient system (DEGS) (19,20).
Dynamic Range and Mass Resolving Power
Figure 2a shows a typical quantitative dynamic range of the mass spectrometer for reserpine. It shows a linear dynamic range of more than four orders of magnitude, spanning from 10 fg to 200 pg, for which the orthogonal arrangement of the TOF analyzer and the ADC data-acquisition electronics contribute considerably.
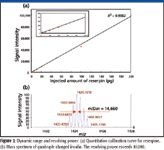
Figure 2
Figure 2b shows a typical mass spectrum of insulin, where the resolving power for quadruple charged ions of insulin is over 10,000, which is adequate for most high-resolution applications.
Therefore, the high-resolution multistep tandem mass spectrometer has high resolution combined with a wide dynamic range, which is suitable for accurate qualitative and quantitative analysis of unknown molecules and biomarkers.
Two Dissociation Modes in the LIT and in the Collision Chamber
For best performance for a broad range of application, two distinct modes of collisionally induced-dissociation (CID) are available with the MS system, which is realized by its unique orthogonal arrangement of LIT and TOF: LIT-CID and quadrupole-CID (or Q-CID). In the LIT-CID mode, ions are dissociated inside the LIT with capability for multistep MS-MS analyses (MSn), while in the quadrupole-CID (or Q-CID) mode, ions are dissociated inside the collisional-focusing chamber.
Though MSn in a LIT is a useful tool for the analysis of complex molecular structures, it is limited by a low-mass cutoff, resulting in difficulty detecting low mass fragment ions of m/z less than ¼ or ⅓ of the precursor ion. On the other hand, MS-MS analysis with the quadrupole-CID is characterized by the production of fragment ions of lower mass compared with that produced using LIT.
Figure 3 shows a comparison of the two types of MS-MS fragmentation modes, LIT and Q-CID, for a peptide [Glu]1-fibrinopeptide B. In the Q-CID MS-MS mode, ions with lower mass were observed, but they were not observed using the LIT MS-MS mode. The lower-mass ions consist of b2 ions, produced via fragmentation of sample peptide at the second peptide bond from the N-terminus, and y1 ions, produced via fragmentation at the peptide bond of the C-terminus. Thus, the MS-MS spectrum obtained using quadrupole CID yielded more information regarding amino acid sequence than that obtained via LIT. The method also might be beneficial for the structural analysis of small molecules, such as metabolites, where one might need information of low-mass fragment ions.
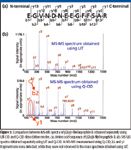
Figure 3
The MS system provides two choices, MSn measurement with LIT and MS-MS measurement with a quadrupole collision chamber, to support a variety of samples and purposes.
Software for the Efficient Search of Biomarker Molecules: Information-Based Acquisition
To use MSn capability efficiently, it is important that the mass spectrometer can control the spectral acquisition sequence intelligently.
The software for this purpose in the MS system is called information-based acquisition (IBA) (21,22) and has two major characteristic functions: real-time construction of an exclusion database and real-time intelligent triggering of MS3 data acquisition.
In the real-time construction capability of exclusion database, which is shown schematically in Figure 4a, IBA can store m/z and retention time information of the precursors, which have been analyzed already via MS-MS into an internal database in real time. During repeated LC–MS measurements of the same sample, subsequent measurements can reference the internal database and avoid duplication of the MS-MS spectra of identical precursor ions. By employing the IBA capability, as more measurements are repeated, an increased number of less abundant proteins–peptides, for example, can be identified. The IBA software allows editing of the internal database as well. Known information regarding interfering molecules, as shown in Figure 4a, can be registered in advance.
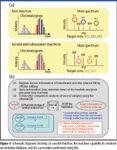
Figure 4
In realtime intelligent triggering of MS3 data acquisition, IBA can trigger MS3 upon user-designated conditions on the MS2 spectrum. For example, in protein applications, IBA can analyze de-novo sequence of the precursor peptide from the MS2 fragment peaks (21) in real time. If information in MS2 is not sufficient for de-novo sequencing of more than n amino acid residues, IBA triggers MS3 to obtain further fragmentation information. The n value is designated by the user. IBA can also trigger MS3 when a user-designated neutral-loss peak is found in the MS2 spectrum.
Figure 4b schematically depicts one procedure of using IBA for search of biomarkers. First, Sample A is measured to register information regarding the tandem-analyzed target precursors into the database in realtime. Next, during measurements of Samples B and C, the database is used as a reference to selectively obtain the MS-MS spectrum of a target component that is not included in Sample A. Reference 23 describes an application of such an IBA procedure for analysis of an unknown biomarker protein in serum.
An Example of High Resolution MSn Analysis of Small Molecules
A combination of high-resolution and multistep tandem analysis is advantageous for structure determination of complex molecules. Figure 5 shows an example of high-resolution LC–MSn analysis of a sample containing a family of erythromycins (erythromycins A to F) in which the major component was erythromycin A. Erythromycins B–F initially were unknown impurity components identified by this high-resolution LC–MSn experiment.

Figure 5
Figure 5a shows the structure and fragmentation diagram of erythromycin A and its MS1, MS2, and MS3 spectra. The major mass peak (m/z 576) in MS2 spectrum corresponds to a substructure composed of the amino sugar (denoted by substructure b) and the macrolide ring (substructure c), where the neutral sugar (substructure a) was removed as a neutral loss. The major mass peak m/z 158 in MS3 spectrum corresponds to the amino sugar, where the macrolide ring was removed from the MS2 peak as a neutral loss.
The base peak ion chromatogram is shown in Figure 5b where five impurity peaks are observed together with the major erythromycin peak, which was more than 140 times as intense as the smallest impurity peak, peak 1. The five impurity peaks were subjected to high-resolution MSn analysis similar to Figure 5a. Summary of the experiment is shown in the table of Figure 5c. The elemental composition can be deduced from the high accuracy m/z value of (M+H)+ ion in the MS1 spectrum for each impurity peak, which were within 5 ppm error from theoretical m/z values. Similarly, the elemental compositions for the substructures of the neutral sugar substructure (a), amino sugar (b), and the macrolide ring (c) all can be deduced from the high-resolution MS1, MS2, and MS3 spectra.
Using these high-resolution MSn results shown in Figure 5c, the impurity peaks were identified to erythromycins B–F with high confidence, as indicated in Figure 5d. Thanks to the wide dynamic range of the methodology, high-resolution MS3 analysis with a good signal-to-noise ratio was possible, which resulted in high-confidence identification even for the most minor impurity peak, whose intensity was less than 0.7% of the major component.
An Example of Nonlabeled Relative Quantitative Analysis of Proteins
In protein research, nonlabeled relative quantitation of a mixture of proteins between different samples often is used to search for biomarkers. Because mass chromatographic peaks must be compared between samples, reproducibility of the retention times of the peaks is important. The highly reproducible nanoflow LC portion of the LC–MS system is ideally suited for this application. To evaluate accuracy in such a relative quantitation experiment, two artificially prepared peptide mixture samples were analyzed as follows.
Both peptide mixture samples, samples A and B, were tryptic digests of four kinds of proteins: yeast enolase, phosphorylase b, yeast alcohol dehydrogenase, and bovine hemoglobin. The concentrations of phosphorylase b, yeast alcohol dehydrogenase, and bovine hemoglobin before digestion were 100 nmol/L in both samples, while the concentration of yeast enolase prior to digestion was 100 nmol/L for sample A and 200 nmol/L for sample B. A 1-μL volume of each sample was injected into the nanoLC system and detected by MS, resulting in MS spectra of the peptide mixture and MS-MS fragment mass spectra of peptides.
Relative-quantitative performance is shown in Figure 6. Figure 6a shows the total ion chromatograms of samples A and B. Here, the peptide peaks are well resolved with highly reproducible retention times. The chromatographic peaks, which correspond to the peptides, are categorized into two groups: peaks whose intensities are nearly equal for samples A and B, and peaks whose intensities are twice greater for sample B compared with sample A. Twice-greater peaks in sample B are derived from tryptic-digest peptides of yeast enolase, which is consistent with the sample preparation. Thus, these total ion chromatograms suggest a quantitative performance and qualitative selectivity suitable for relative-quantitation by LC–MS.
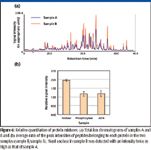
Figure 6
To characterize the performance more quantitatively, the proteins were quantified relatively as follows. First, to identify the proteins from the peptide fragment spectra, the MS-MS spectra were analyzed with the protein search software MASCOT (Matrix Science, Inc., Boston, Massachusetts), which resulted in the reliable assignment of each peptide peak to one of the four proteins. Next, intensity of each peptide mass-chromatographic peak was calculated relative to a major peptide peak of the bovine hemoglobin. Then, the ratio of the corresponding peak intensity in sample B to sample A was calculated. After grouping the identified peptide peaks according to their parent proteins, the relative peak-intensity ratios of the peptides belonging to a same protein were averaged to give an average relative-intensity-ratio between samples A and B for that protein, which is shown in Figure 6b.
For phosphorylase b and yeast alcohol dehydrogenase, the ratio of sample B to sample A was 1.16 ± 0.13 and 1.19 ± 0.16, respectively, while the ratio of yeast enolase in sample B to sample A was 1.95 ± 0.05. Thus, the relative quantitation experiment was accurate within 16% of the actual amounts of proteins in the sample, where the experiment includes not only LC–MS-MS, but also protein pretreatment such as digestion.
Conclusion
Improved identification and quantification abilities using high-resolution multistep MS-MS are expected to accelerate the qualitative discovery and quantitative validation analysis of unknown candidate molecules of chemical and biological relevance, such as biomarker molecules critical to medical diagnosis and pharmaceutical development.
Izumi Waki, Katsuhiro Kanda, Izumi Ogata, Tsukasa Shishika, Akira Owada, Shinji Yoshioka, Masaki Watanabe, and Yukie Sasakura are with Hitachi High-Technologies, Hitachinaka, Ibaraki, 312-8504, Japan. Chad Ostrander is with Hitachi High Technologies America, San Jose, California.
References
(1) E.H. Oliw, C. Su, T. Skogstrom, and G. Benthin, Lipids 33(9), 843–852 (1998).
(2) Y. Takegawa, S. Ito, S. Yoshioka, K. Deguchi, H. Nakagawa, K. Monde, and S.-I. Nishimura, Rapid Commun. Mass Spectrom. 18, 385–391 (2004).
(3) Y. Takegawa, K. Deguchi, S. Ito, S. Yoshioka, A. Sano, K. Yoshinari, K. Kobayashi, H. Nakagawa, K. Monde, and S.-I. Nishimura, Anal. Chem. 76, 7294–7303 (2004).
(4) C. Govaerts, H.K. Chepkwony, A. Van Sphepdael, E. Roets, and H. Hoogmartens, Rapid Commun. Mass Spectrom. 14, 878 (2000).
(5) S.M. Michael, M. Chien, and D.M. Lubman, Rev. Sci. Instrum. 63, 4277 (1992).
(6) J. Qin, R.J.M. Steenvooden, and B.T. Chait, Anal. Chem. 68, 1784 (1996).
(7) L. Ding, E. Kawatoh, K. Tanaka, A.J. Smith, and S. Kumashiro, Proc. SPIE-Int. Soc. Opt. Eng. 3777, 144–155 (1999).
(8) R. Emmanuel, K. Tanaka, and B. Ian, Proc. 50th ASMS Conf. Mass Spectrometry and Allied Topics, Orlando, Florida, June, 2002.
(9) C. Marinach, A. Brunot, C. Beaugrand, G. Bolbach, and J.C. Tabet, Int. J. Mass Spectrom. 213, 45 (2002).
(10) A. Okumura, A. Hirabayashi, T. Baba, Y. Hashimoto, I. Waki, and K. Yoshinari, Proc. 51st ASMS Conf. Mass Spectrometry and Allied Topics, Montreal, Canada, June, 2003.
(11) C. Marinach, A. Brunot, C. Beaugrand, G. Bolbach, and J.C. Tabet, Proc. 49th ASMS Conf. Mass Spectrometry and Allied Topics, Chicago, Illinois, June, 2001.
(12) J.M. Campbell, B.A. Collings, and D.J. Douglas, Rapid Commun. Mass Spectrom. 12, 1463–1474 (1998).
(13) Y. Hashimoto, I. Waki, K. Yoshinari, T. Shishika, and Y. Terui, Rapid Commun. Mass Spectrom. 19, 221–226 (2005).
(14) Y. Hashimoto, H. Hasegawa, and I. Waki, Rapid Commun. Mass Spectrom. 19, 1485–1491 (2005).
(15) K. Deguchi, H. Ito, Y. Takegawa, N. Shinji, H. Nakagawa, and S. Nishimura, Rapid Commun. Mass Spectrom. 20(5),741–746 (2006).
(16) K. Deguchi, H. Ito, T. Baba, A. Hirabayashi, H. Nakagawa, M. Fumoto, H. Hinou, and S.-I. Nishimura, Rapid Commun. Mass Spectrom. 21, 691–698 (2007).
(17) H. Ito, K. Yamada, K. Deguchi, H. Nakagawa, and S.-I. Nishimura, Rapid Commun. Mass Spectrom. 21, 212–218 (2007).
(18) Hitachi High Technologies America, San Jose, California.
(19) K. Deguchi, S. Ito, S. Yoshioka, I. Ogata, and A. Takeda, Anal. Chem. 76(5), 1524–1528 (2004).
(20) K. Deguchi, S. Yoshioka, S. Ito, and I. Ogata, The Hitachi Hyoron 86(10), 59–62 (2004).
(21) T. Yokosuka, K. Yoshinari, K. Kobayashi, A. Ohtake, A. Hirabayashi, Y. Hashimoto, I. Waki, and T. Takao , Rapid Commun. Mass Spectrom. 20(17), 2589–2595 (2006).
(22) IBA functions were developed through activities granted by NEDO: the New Energy and Industrial Technology Development Organization.
(23) Y. Sasakura, J. Krone, M. Nogami, S. Nagai, S. Watanabe, C. Ostrander, and K. Kanda, Current Trends in Mass Spectrometry, November 2006, http://www.lcgcmag.com/lcgc/article/articleDetail.jsp?id=390674

New Method Explored for the Detection of CECs in Crops Irrigated with Contaminated Water
April 30th 2025This new study presents a validated QuEChERS–LC-MS/MS method for detecting eight persistent, mobile, and toxic substances in escarole, tomatoes, and tomato leaves irrigated with contaminated water.
Accelerating Monoclonal Antibody Quality Control: The Role of LC–MS in Upstream Bioprocessing
This study highlights the promising potential of LC–MS as a powerful tool for mAb quality control within the context of upstream processing.
University of Tasmania Researchers Explore Haloacetic Acid Determiniation in Water with capLC–MS
April 29th 2025Haloacetic acid detection has become important when analyzing drinking and swimming pool water. University of Tasmania researchers have begun applying capillary liquid chromatography as a means of detecting these substances.

.png&w=3840&q=75)

.png&w=3840&q=75)


.png&w=3840&q=75)


.png&w=3840&q=75)


