A Single-Method Approach for the Analysis of Volatile and Semivolatile Organic Compounds in Air Using Thermal Desorption Coupled with GC–MS
LCGC Europe
This article describes a new, single method to replace the two-method approach using United States EPA Methods TO-15 and TO-13A for the analysis of both VOCs and SVOCs in air.
Page 624-631
This article describes a new, single method to replace the two-method approach using United States Environmental Protection Agency (EPA) Methods TO-15 and TO-13A for the analysis of both volatile organic compounds (VOCs) and semivolatile organic compounds (SVOCs) in air. The study presents evidence that these components can be determined using one analytical method that follows EPA TO-17 capturing the volatile compounds in addition to recovering the heaviest components, such as benzo[ghi]perylene. The investigation also takes a look at some of the 50 additional compounds that are expected to be added to this list in the near future.
There is an increasing need to determine both volatile organic compounds (VOCs) and semivolatile organic compounds (SVOCs) in air because many sites across the United States are being mandated to measure them to fully understand their impact on human health. Currently, the analysis of these compounds requires two analytical methods from the Environmental Protection Agency (EPA): EPA TO-15 (1) or TO-17 (2) for volatiles and EPA TO-13A (3) for semivolatile components. To enable the analysis of both volatile and semivolatile components in one air sample, a new thermal desorption (TD) sample tube was required.
The purpose of this study was to investigate whether one analytical method could be used following EPA Method TO-17 to monitor both the volatile and semivolatile target list mandated by regulatory agencies, including 1,3-butadiene, benzene, toluene, ethyl benzene, and xylenes (BTEX compounds) as well as 16 EPA-regulated polycyclic aromatic hydrocarbons (PAHs) up to benzo[ghi]perylene. One of the benefits of using TO-17 is that it is a performance-based method, meaning it can be used to analyze any compound as long as that compound meets the method criteria. This is emphasized in section 2.5 of the method, which states (2), ". . . this method provides performance criteria to demonstrate acceptable performance of the method (or modifications of the method) for monitoring a compound or set of compounds." Furthermore, by using this method only one air sample needs to be collected and analyzed instead of two, which significantly reduces sampling costs, enhances laboratory productivity, and improves safety, resulting in a more environmentally friendly analysis (4).
Discussion
Method TO-15, the conventional way of measuring VOCs in air, uses a large electropolished stainless steel vessel (Summa canister) that collects approximately 6 L of air. A fraction of this sample volume, typically 500 mL, is withdrawn from the canister and sent to a concentrator sorbent trap. The sample is then desorbed from the trap and focused onto a gas chromatography (GC) analytical column to be separated and analyzed by mass spectrometry (MS).
There are several limitations of the TO-15 approach. This method only reliably recovers up to naphthalene (C12) while several regulatory directives require measurements up to at least C13. In addition, many air samples might contain higher boiling substances, which can adsorb onto the sides of the canister and condense. Other challenges include analyzing air samples with high moisture content and the requirement for a greater number of analytes (in some cases up to C40) over a wide range of concentrations. Method TO-17 overcomes many of these challenges, by using a thermal desorption tube instead of a Summa canister to collect the sample. The thermal desorption process uses a sorbent tube, which contains adsorbent material specifically selected to trap the range of analytes of interest. A known volume of air is sampled through the tube, where the contents are then desorbed onto a secondary trap into the analytical column to be analyzed by GC–MS.
Method TO-13A for determining semivolatile organic compounds in air requires the use of a much higher volume sampling technique to acquire sufficient sample for analysis, mainly because of the relatively low levels of PAHs in the environment. Unfortunately, the volatility of certain PAHs prevents efficient collection on filter media alone, so the method necessitates both a filter and a backup sorbent cartridge to provide for efficient collection of the common PAHs.
In addition, the filter medium and sorbent material cartridges have to be cleaned in the laboratory for up to 16 h with a suitable solvent (typically, methylene chloride) and vacuum dried, before sampling can be carried out. Approximately 1000 m3 of air is drawn using a high-volume flow rate air sampler. The filter and sorbent cartridge are then sent to the analytical laboratory for analysis, where the compounds trapped on the filter and cartridge are removed by a 16-h Soxhlet extraction with methylene chloride. The extract is then concentrated and cleaned using column chromatography to remove potential interferences before analysis by GC–MS. Because Method TO-17 does not require the extraction, evaporation, and concentration of large volumes of methylene chloride it is much safer for the operator, as well as being a far more environmentally friendly approach.
One-Method Approach
The advantages of replacing Methods TO-13A and TO-15 with Method TO-17 for the analysis are the cost savings to both the laboratory and the client, and that TO-17 requires no sample preparation once the samples arrive at the lab. The tubes are simply placed on the autosampler and analyzed. After starting the thermal desorber, the instrument automates the process of desorbing the analytes from the tube, and injecting the sample into the analytical column for detection and analysis by GC–MS. In addition, the data generated from the site evaluation (shown later), will show that thermal desorption is more efficient than Soxhlet extraction and also requires significantly less operator intervention. A schematic of this desorption process is provided in Figures 1(a) and 1(b).

Figure 1: Schematics for (a) desorbing the sample tube by the thermal desorber and (b) desorbing the trap onto the analytical column by the thermal desorber.
Another limitation of Method TO-15 is that it cannot recover the PAH analytes listed in Method TO-13A, which makes it impossible to achieve the goal of measuring both volatile and semivolatile compounds by TO-15. It is also far more expensive, mainly because shipping costs are much higher as a result of the increased size of the canisters relative to the smaller desorption tubes. TO-15 is more labour intensive because it can require many hours or even days to ensure the canisters are evacuated of the previous sample and clean enough for resampling. From a performance standpoint, TO-17 can sample much larger volumes; therefore, the achievable detection limits are significantly lower with TO-17 than with Method TO-15.
Investigation
A primary goal of this investigation was therefore to design a tube and select a sorbent material to meet the demands of the greater boiling point component range found in both VOC and SVOC analytes using Method TO-17. After investigating several different sorbent materials, the result was a tube that contains multiple layers of charcoal based sorbents, arranged so that the sample is exposed to increasingly stronger sorbents as it penetrates the tube (XRO-40 Extended Range Organics TD tube, PerkinElmer, Inc.). This design prevents the adsorption of the heavier components onto the stronger sorbents, which would not release them. Instead the heavier components are adsorbed onto the weaker sorbents in the front of the tube while the lighter components are adsorbed onto the stronger sorbents in the back end of the tube. The weaker sorbents protect the strong adsorbents from irreversible adsorption and leave the tube clean after one desorption cycle. The tube is shown in Figure 2. It handles the analyte range of C4 to C40 which recovers the typical VOCs and all the regulated multiring PAHs up to benzo[ghi]perylene.

Figure 2: The thermal desorption tube (XRO-40 Extended Range Organics TD tube, PerkinElmer) used for trapping both VOC and SVOC analytes (C4 to C40) in air using multiple adsorbents.
The tubes were designed to fit onto an automated thermal desorber system (TurboMatrix 650 ATD, PerkinElmer, Inc.) for analysis. This system uses a two-stage thermal desorption process that concentrates analytes before they are introduced into a Clarus 680 GC system coupled with a Clarus SQ8 mass spectrometer (PerkinElmer, Inc.). This thermal desorber design provides high-temperature desorption capability that allows the determination of analytes up to C44 hydrocarbons. To minimize water vapour entering the system, which can quench target response in MS detection, the system uses dry purging of both the tube and the trap to ensure efficient water elimination even for high moisture air samples. The conditions for this study are shown in Table 1.
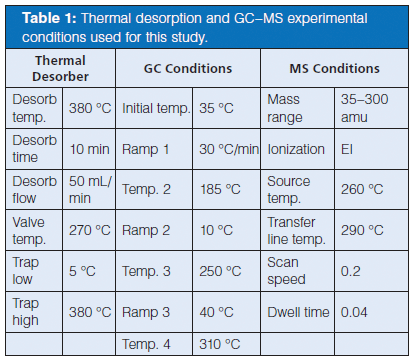
Table 1: Thermal desorption and GC–MS experimental conditions used for this study.
The scope of this investigation was therefore to assess the practicality of using just one method, Method TO-17, for both VOCs and SVOCs, by not only assessing performance metrics such as breakthrough volume, calibration linearity, reporting limits, precision, recovery, and carryover, but also by carrying out a real-world site evaluation.
Breakthrough Experiment
Breakthrough volume is a critical factor in the real-world performance of an adsorbent. It is defined according to EPA Method TO-17, when the amount of target analyte collected in a backup sorbent tube exceeds 5% of the total amount collected by both sorbent tubes. Several different adsorbent materials were investigated to ensure there was no detectable breakthrough of the most volatile components of interest. The breakthrough experiments were split into two main sections: site-based and laboratory study.
The background on the breakthrough tube was analytically investigated via thermal desorption GC–MS before these experiments on the same system where all tests are being performed. When the tubes returned to the laboratory, an empty tube was analyzed first to ensure instrument cleanliness. The breakthrough tube was then analyzed and the results compared to its background. There were no detectable target analytes on the breakthrough tubes from the field studies with an average of 45-L sample volume per tube.
For the laboratory-based investigation, a breakthrough tube was spiked with a standard consisting of 8000 ng of a suite of 16 VOCs and the 16 PAHs. This spiked tube was connected to a clean tube whose background was determined before the experiment. A manifold was created, as shown in Figure 3, which passed 10 L of humidified nitrogen (85% humidity) through the spiked tube at a rate of 100 mL/min for 100 min, duplicating a sampling environment.
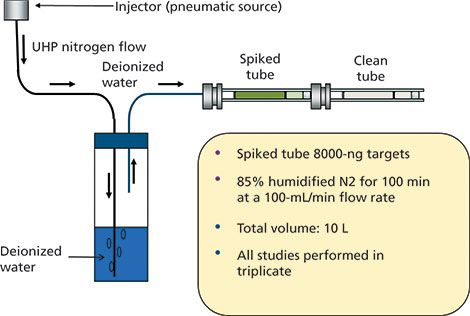
Figure 3: Setup for one of the laboratory breakthrough investigations.
The tube was then analyzed and compared to its background result using the following calculation for % breakthrough (BT):

The results for all 16 VOCs demonstrated that there was no detectable breakthrough of the target analytes from the spiked tube. An additional laboratory-based breakthrough test was performed, termed a tube loading study. The study was set up with a primary and breakthrough tube attached to a gaseous standard containing 81 TO-15 or TO-17 analytes at a concentration of 1.0 ppmv each, and set to a flow rate of 10 mL/min. Every 10 min, the breakthrough tube was removed and immediately replaced with a fresh one. The testing did not continue until breakthrough was observed, but rather ended after 60 min, at which time a total of 205 mg of the analytes had collected on the primary tube. Once again, all breakthrough tubes were clean and no analytes were detected.
Because it is not necessarily the volume of air passing through a thermal desorption tube that causes breakthrough, but rather the amount of analyte occupying the sorbent spaces, this tube loading study shows that the tube can be loaded to at least 205 mg of analyte without breakthrough. It is also important to emphasize that the highest calibration standard used is 50 ng (as demonstrated in the calibration section of the study), so if no breakthrough was detected from over 200 mg of analyte it is highly unlikely that any would be experienced from 50 ng. This means that even if the sampling volume of air is increased 10-fold, to 450 L, it would only result in 500 ng reaching the tube, which is still a factor of 400-fold lower than 205 mg.
Calibration, Precision and Reporting Limits
For this part of the evaluation, it was important to view the total chromatogram to ensure chromatographic focusing of the most volatile analytes and elution of the heavy analytes. This is demonstrated in Figure 4, which shows the total ion chromatogram (TIC) of a calibration standard displaying resolution of all target analytes.
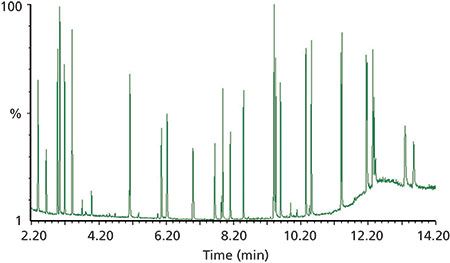
Figure 4: Total ion chromatogram of a VOC standard showing all target analytes have been separated.
The calibration curve experiments were then performed to determine the validity of combined VOC and SVOC analytical conditions, method linear range, and applicability of this linear range to real-world samples. The calibration curve was found to be valid by achieving linearity of both volatile and semi-volatile compounds within EPA TO-17 method limits of 30% averaged response factor or a linear regression value of >0.995. In fact, many target analytes achieved a linear regression value of >0.999.
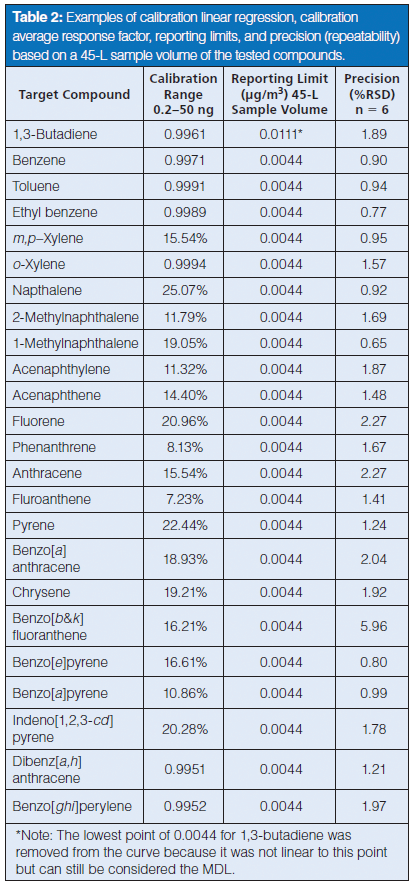
Table 2: Examples of calibration linear regression, calibration average response factor, reporting limits, and precision (repeatability) based on a 45-L sample volume of the tested compounds.
The calibration curve was also found to be applicable for real-world samples from our site studies, as most compounds fell well within the 0.2–50 ng linear range, and reporting limits with TO-17 are better than TO-15, essentially because of the larger sample volume allowed with TO-17. The samples were also evaluated for precision (repeatability), achieving relative standard deviations (RSD) for all compounds of <6%, which is significantly less than the EPA TO-17 method limits of <30%. The results for linearity, repeatability (n = 6), and reporting limits based on a 45-L volume of the compounds investigated can be found in Table 2. The calibration graph (0.2–50 ng) for one of the analytes (o-xylene) is shown in Figure 5.
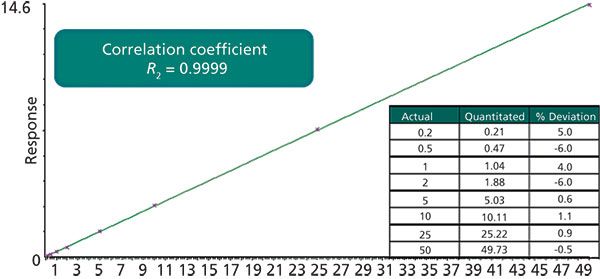
Figure 5: The calibration plot (0.2–50 ng) and statistical data of o-xylene.
Recovery and Carryover Tests
To ensure that the full amount of all analytes was recovered from the thermal desorption sample (primary) tube, a tube was spiked with 100 ng of the target analytes. This was followed by two injections of the trap, an empty tube, and a reinjection of the spiked tubes. Because the reinjections of both the trap and tube were found to be nondetects for the target compounds, there was full desorption of the analytes onto the analytical column.
An empty tube was analyzed between the trap test and the reinjection of the spiked tube to ensure the entire sample path was free of targets before the re-injection of the spiked tube to confirm recovery of the spiked tube. The injection of the empty tube also confirms that there wasn't any carryover in the valve or sample path.
Site Study
The site chosen for this study was a manufactured gas plant. In most states, these sites are regulated to measure their VOC and SVOC output into the surrounding air. When soil excavation of these sites occurs, fence-line monitoring is required to quantify toxic components in the air, such as BTEX and PAHs through to benzo[ghi]perylene, which could escape from the remediation site into the adjacent residential areas. Using the traditional Methods TO-13A and TO-15 for the collection of BTEX and PAHs is not only expensive, but it also creates a health and safety hazard, particularly when there is a need for high voltage power lines. Manufactured gas plant sites are typically remediated by "dig and haul" methods, which means there may be several soil excavations occurring at the site. The chances of heavy excavation equipment and personnel encountering these power lines are great; therefore, the use of Method TO-17 for the sampling and collection of BTEX and PAHs eliminates the need for Method TO-13A sampling, and as a result, is much safer to operate.
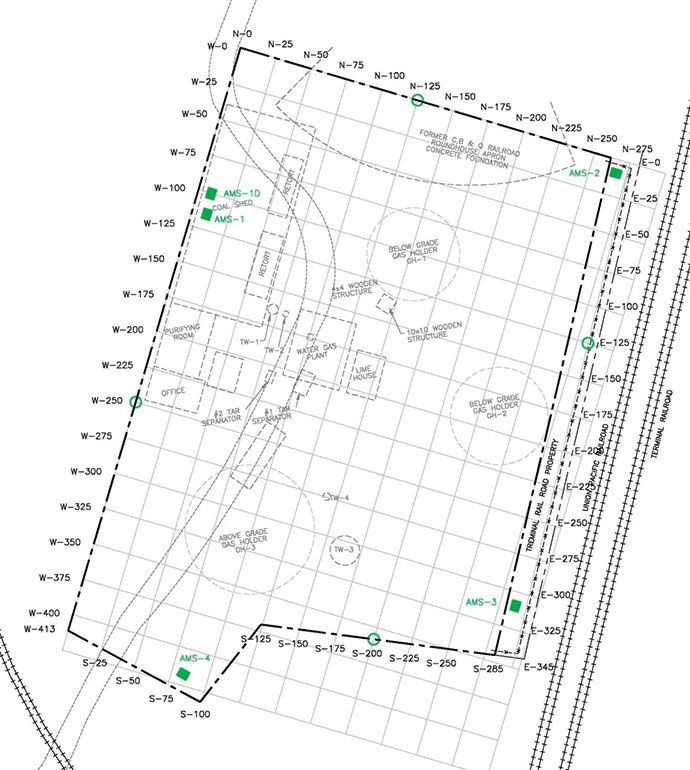
Figure 6: Layout of the MGP site. The sampling sites are shown in green.
The manufactured gas plant site consisted of three sampling sites (Sites 1, 2, and 3). A graphical layout of the site can be seen in Figure 6, and a photograph showing all three methods of sampling, plus an additional airborne particulates study (PM-10) is shown in Figure 7.
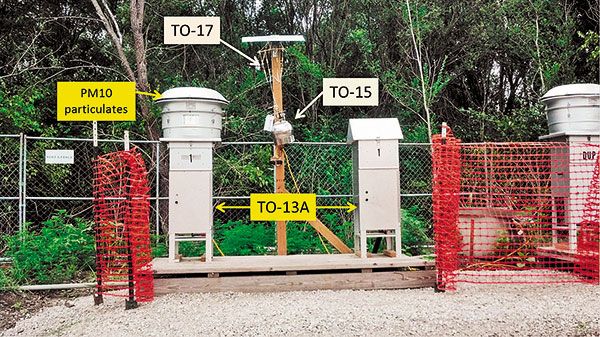
Figure 7: The three different methods of air sampling carried out at each site.
Real-World Capability
To assess and validate the real-world capability of the one-method approach, the three different field sites were sampled and the results using Method TO-17 were compared to a combination of Methods TO-13A and TO-15. There were four sampling events over a 10-day period at each of the sites. Two of the events at each site for TO-17 were sampled in duplicate. For this research, a manifold of four sample tubes was designed, which is shown in Figure 8. Each sample tube had a breakthrough tube connected to it, which was also analyzed. The flow through each tube was measured and recorded both at the start of sampling and again at the end of the sampling period. In this manner, the volume of air passed through each tube was accurately determined. Each tube had approximately a 10-mL/min sampling flow with a sampling duration of 72 h, producing a total volume sampled of approximately 45 L per tube. All calculations for the final results use the exact sampling volumes as recorded.
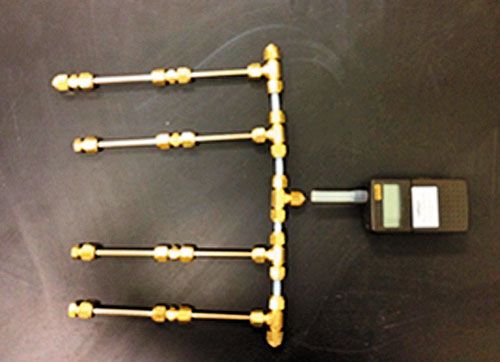
Figure 8: The sampling manifold used for the field site study.
Because water can interfere with both the adsorption and analysis of target analytes, it was important to determine the amount of water retained on the tube during sampling. It was empirically determined that after a 2-min dry purge any water retained on the tube was removed, which demonstrated that the adsorbents were hydrophobic and the water was not significantly retained during the sampling process.
The results from one of the sampling events at each site comparing TO-17 to TO-13A and TO-15 are shown in Table 3. The results compared very favourably with each other and in most cases TO-17 gave slightly improved recoveries over the other two methods. The reason for the improved recoveries can be explained by understanding the extraction process of TO-13A. The final step in the Soxhlet extraction is blow-down of the solvent sample to a very small volume, typically 0.5 mL or 1.0 mL for analysis. If the blow-down is too vigorous or the blow-down vessel unintentionally goes dry, the lighter PAHs such as the naphthalenes are irreversibly lost. Thermal desorption requires no laboratory preparation, and all analytes of interest are desorbed onto the trap and analytical column.
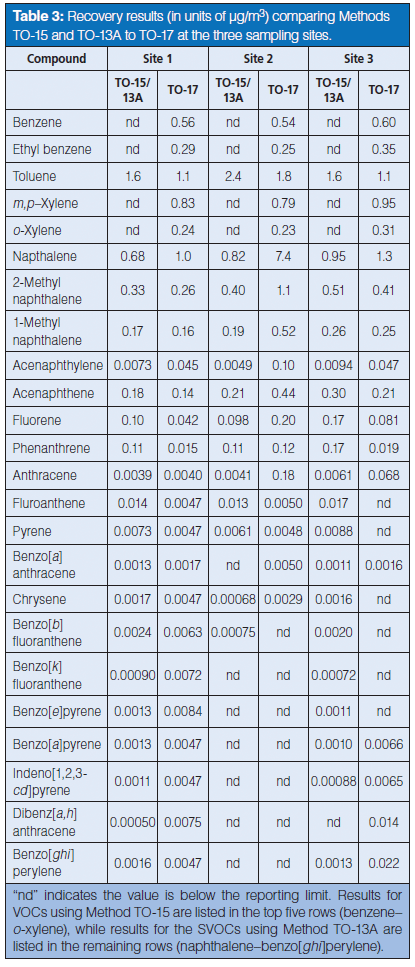
Table 3: Recovery results (in units of μg/m3) comparing Methods TO-15 and TO-13A to TO-17 at the three sampling sites.
Because the sampling volume of TO-17 is 45 L and the sampling volume of TO-15 is 6 L, the reporting limit for TO-17 is significantly lower than TO-15 for the volatile compounds. With regard to TO-13A, the sampling volume is approximately 1000 m3 and, therefore, the reporting limits in most cases are lower than TO-17, as can be seen in the method reporting limits shown in Table 4. The limits can be improved by using longer sampling times or faster flow rates with TO-17 to collect a larger volume. Our breakthrough experiments prove that larger volumes can be sampled without concern for breakthrough. It should also be pointed out that even though naphthalene is a target analyte for both TO-15 and TO-13A in the dual-method approach; the results from TO-13A are used since the recovery for this analyte is better than using TO-15.
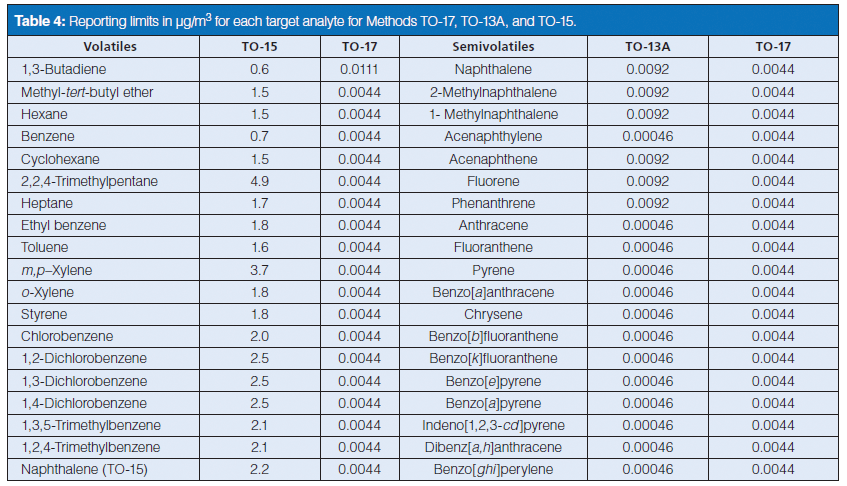
Table 4: Reporting limits in μg/m3 for each target analyte for Methods TO-17, TO-13A, and TO-15.
Other considerations that require discussion are the sampling techniques of TO-13A versus TO-17. The first consideration is that TO-13A sampling utilizes a filter as well as a sorbent cartridge to trap any SVOCs that may exist as particulates. Extraction procedures perform the solvent extraction on both the filter and cartridge, either together within the same extraction vessel, or separately followed by addition of the final results. To understand the impact of filters on the TO-17 data, half of the tubes were filtered using a 0.22-μm fibre filter and the other half were nonfiltered. The relative percent difference in TO-17 PAH results between the filtered and nonfiltered duplicate data was within experimental error, with no positive or negative bias, indicating that it makes very little difference whether the analytes are in the particulate or the gas-phase form.
The second consideration is the sample flow during collection of the TO-13A sample. To obtain a sample volume of 1000 m3 over the course of 72 h, a flow rate of 230 L/min is required. This is a very substantial flow rate that unavoidably disturbs the surrounding air mass. In contrast, the flow rate for TO-17 (in this case 10 mL/min) measures air in the immediate vicinity, and is a more accurate representation of the PAHs present at the fence-line.
Summary
The study has shown that it is possible to use one method for the analysis of both volatile and semivolatile organic compounds in air by GC–MS. By using a new design of thermal desorption sample tube and instrumentation capable of recovering up to C40, the performance-based EPA Method TO-17 can be used alone instead of the combination of Methods TO-13A and TO-15. There is no detectable breakthrough coupled with full desorption of analytes from both the tube and the trap, and very little carryover in the sample path. The calibration curves from 0.2 ng to 50 ng are linear for both volatile and semivolatile compounds. This calibration range appears to be appropriate for real-world samples, using a 45-L sample volume. Furthermore, the reporting limit for TO-17 analysis is dependent upon the volume of sample collected. Because the sorbent combination is hydrophobic, a sample volume of greater than 45 L is attainable.
Additional benefits of a single-method approach include significant cost savings to both the laboratory and its clients by reducing the number of samples that need to be collected. In addition, using a thermal desorption tube instead of a Summa canister translates to lower shipping costs. Laboratory efficiency and productivity are also improved as only one air sample needs to be analyzed instead of two. The fact that Method TO-17 does not use organic solvents also enhances safety, resulting in a more environmentally friendly analysis.
Acknowledgements
The authors would like to acknowledge Nathan Eklund, Program Manager, Specialty Analytical Services; and Amy Jacobson, Manager, Air Lab at Pace Analytical Services together with Jim Day, the PerkinElmer Service Engineer for their help and valuable contribution to this study.
Roberta Provost is a senior chemist in the Air Laboratory at Pace Analytical Services in Minneapolis, Minnesota, USA.
Lee Marotta is a GC and GC–MS product/application scientist at PerkinElmer, Inc., in Shelton, Connecticut, USA.
Robert Thomas is principal consultant at Scientific Solutions in Gaithersburg, Maryland, USA.
References
(1) Compendium Method TO-15, Determination of Volatile Organic Compounds (VOCs) In Air Collected In Specially-Prepared Canisters and Analyzed by Gas Chromatography/Mass Spectrometry (GC/MS) (U.S. Environmental Protection Agency, Office of Research and Development, Cincinnati, Ohio, USA, 18 March 1999).
(2) Compendium Method TO-17, Determination of Volatile Organic Compounds (VOCs) in Ambient Air Using Active Sampling on to Sorbent Tubes (U.S. Environmental Protection Agency, Office of Research and Development, Cincinnati, Ohio, USA, January, 1999).
(3) Compendium Method TO-13A, Determination of Polycyclic Aromatic Hydrocarbons (PAHs) in Ambient Air Using Gas Chromatography/Mass Spectrometry (GC/MS) (U.S. Environmental Protection Agency, Office of Research and Development, Cincinnati, Ohio, USA, 18 March 1999).
(4) R.L Provost and L.D. Marotta, "Single Tube Sampling and Analysis of Volatile and Semi-Volatile Organics in Air - The Cost Effective Green Solution," Separation Science Webinar, http://view6.workcast.net/?pak=5791542721847906.
New Study Reviews Chromatography Methods for Flavonoid Analysis
April 21st 2025Flavonoids are widely used metabolites that carry out various functions in different industries, such as food and cosmetics. Detecting, separating, and quantifying them in fruit species can be a complicated process.
Quantifying Terpenes in Hydrodistilled Cannabis sativa Essential Oil with GC-MS
April 21st 2025A recent study conducted at the University of Georgia, (Athens, Georgia) presented a validated method for quantifying 18 terpenes in Cannabis sativa essential oil, extracted via hydrodistillation. The method, utilizing gas chromatography–mass spectrometry (GC–MS) with selected ion monitoring (SIM), includes using internal standards (n-tridecane and octadecane) for accurate analysis, with key validation parameters—such as specificity, accuracy, precision, and detection limits—thoroughly assessed. LCGC International spoke to Noelle Joy of the University of Georgia, corresponding author of this paper discussing the method, about its creation and benefits it offers the analytical community.


