Quantifying Small Molecules by Mass Spectrometry
LCGC Europe
The use of a mass spectrometer in quantitative analysis exploits its exquisite selectivity and sensitivity as a detector, allowing a signal to be ascribed to a particular chemical entity with high certainty, even when present in a sample at a low concentration. There are, however, some special considerations that are necessary when a mass spectrometer is used as a quantitative tool.
Pages 653-658
The use of a mass spectrometer in quantitative analysis exploits its exquisite selectivity and sensitivity as a detector, allowing a signal to be ascribed to a particular chemical entity with high certainty, even when present in a sample at a low concentration. There are, however, some special considerations that are necessary when a mass spectrometer is used as a quantitative tool. In this instalment, we discuss the general precepts of quantitative analysis, as well as the concept of "fitness for purpose", in the context of those considerations.
The use of a mass spectrometer in quantitative analysis exploits its exquisite selectivity and sensitivity as a detector, allowing a signal to be ascribed with high certainty to a particular chemical entity, even when that chemical is present in a sample at low concentration. In what is often referred to as an increase in the ratio of signal to noise (S/N), the selectivity of the mass analyzer (or analyzer combinations) decreases the contribution of background ions to the measured signal, producing a net gain in sensitivity. By operating at enhanced resolution, or by adopting two stages of mass analysis (for example, tandem mass spectrometry [MS–MS]), the specificity is enhanced in a way that is unparalleled by other present-day analytical methods. This article abstracts information previously published by the authors in a book entitled The Principles of Quantitative Mass Spectrometry (1), combining it with new information that will be included in a planned second edition.
Quantitative analysis typically utilizes at least one scanning mass analyzer (that is, a quadrupole, but occasionally a magnetic sector) operated so as to maximize the efficiency of the ion-counting process and, thereby, increase the signal (and S/N) for specific ions or ion transitions of interest. This is often referred to as an increase in the duty-cycle because the mass spectrometer now spends significantly more time counting ions of interest and wastes no time acquiring data on other ions of little or no interest. For some instruments, notably those incorporating ion-trap or time-of-flight (TOF) analyzers, the collection of a full mass spectrum has no effect on the efficiency with which a single ion can be measured; thus, with ion trap and TOF analyzers, there is no sensitivity advantage inherent in the selected-ion monitoring (SIM) experiment. While these analyzers may not deliver the same lower limit of detection and the precision of a quadrupole or sector analyzer, the acquisition of the full mass spectrum often increases the certainty of the determination. As illustrated in Figure 1, with scanning instruments, full spectrum measurements can be abandoned in favour of more selective modes of measurement: monitoring the intensity of an ion characteristic of a compound, as is the case with SIM; several ions characteristic of a compound, as is the case with multiple-ion monitoring; or one or more characteristic ion transitions, such as single-reaction monitoring (SRM) or multiple-reaction monitoring (MRM), respectively. As used in the latter phrases, the term "reaction" indicates that a chemical change is involved: One or more selected (precursor) ions undergo collisional dissociation to yield one or more characteristic product ions. Only ion pairs that undergo this particular type of transition (or transitions) yield a measured signal (or signals).
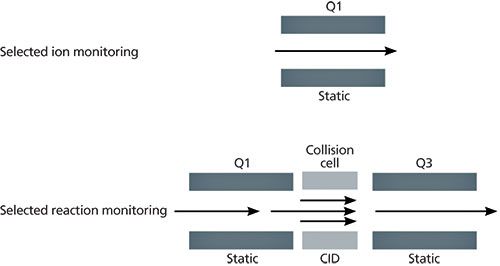
Figure 1: Diagrams of selected ion monitoring (upper diagram) and selected reaction monitoring (lower diagram).
The general approach to quantitative analysis is actually almost independent of the nature of the sample, the analyte (or analytes) of interest, and the separation and detection device. In any given setting, the measurement simply aims to provide the most suitable estimate, in a statistical sense, of the amount of analyte present in a sample. Some special considerations apply, however, when a mass spectrometer is used as a quantitative tool, and they are discussed below. In addition, some of the key terms that appear throughout this instalment are defined in the glossary near the end of the text. These definitions help readers who are unfamiliar with the use of these terms in a scientific context to understand their very precise definitions when used in an analytical setting.
Quantitative Relationships and Mass Spectrometry
Traditional measuring devices link concentration with such properties as absorption of ultraviolet light (spectroscopic techniques), absorption of visible light (colourimetric techniques), or current (electrical techniques). For most instrumental methods, over a limited range of concentration or amount, there is a linear response to some physical stimulus with respect to the amount of analyte specified. While ideally the relationship would be linear, in practice the curve may deviate from linearity at the lowest and highest concentrations.
On the basis of this fundamental relationship, the approach commonly used with any instrumental technique is the calibration-curve method. If the analysis of a series of standards is shown to be reproducible and rugged under well-defined conditions, a linear range and the relationship between the response and the concentration can be defined. Moreover, the response for each unknown can be translated into a concentration or amount by referring to that relationship (or calibration curve).
To perform quantitative analysis with a mass spectrometer, a relationship must first be established between an observed ionic signal for a compound and the amount introduced into the system, typically expressed as a concentration. In practice, absolute ion currents do not correlate well with the absolute amount of analyte: variations between instruments (or even for a given instrument over time) and sample composition preclude the establishment of a universal relationship that could be carried from one setting to another.
We can, however, expect that for two separate samples containing the same analyte and introduced into the mass spectrometer under identical conditions, the relationship between the signal intensity or response, R, observed for each will be in direct proportion to their respective concentrations, C. Thus, R1/R2 = C1/C2. Rearranging this equation such that R1 = (C1/C2)R2 means that if the concentration of the analyte in one sample is known, the concentration of the analyte in the second can be calculated.
In quantitative mass spectrometry, because the response of a mass spectrometer fluctuates with time and also as a consequence of other components in a matrix, the internal standard calibration curve method is frequently used. With the addition of a chemical mimic of the analyte added to all samples and standards at a fixed and known concentration, the signals for the analyte and the internal standard are measured, and the ratio R/RIS is determined for each point. The ratio R/RIS versus concentration is plotted for all standards, yielding a calibration curve. Thereafter, for all unknowns, the concentration of the target analyte is determined by referencing the calibration curve. Evaluation of the quality of the regression is sometimes facilitated by using a ratio transform: Replacing the concentration of the standard as the x-axis variable with the ratio of concentration of the standard to the (fixed) concentration of the internal standard and replotting the data. Having both axes given as ratios yields a regression line for which the slope should always equal 1.00 and the intercept always zero. One advantage to this approach is that statistical tests are readily available to assess the significance of slope deviations from 1.00. In addition, by centering the unit ratio (that is, when the analyte concentration equals the internal standard concentration) within the range of measurements and then restricting the total range of the analysis to about two orders of magnitude, ratios of high precision result because of matched S/N of each value at each point on the standard curve.
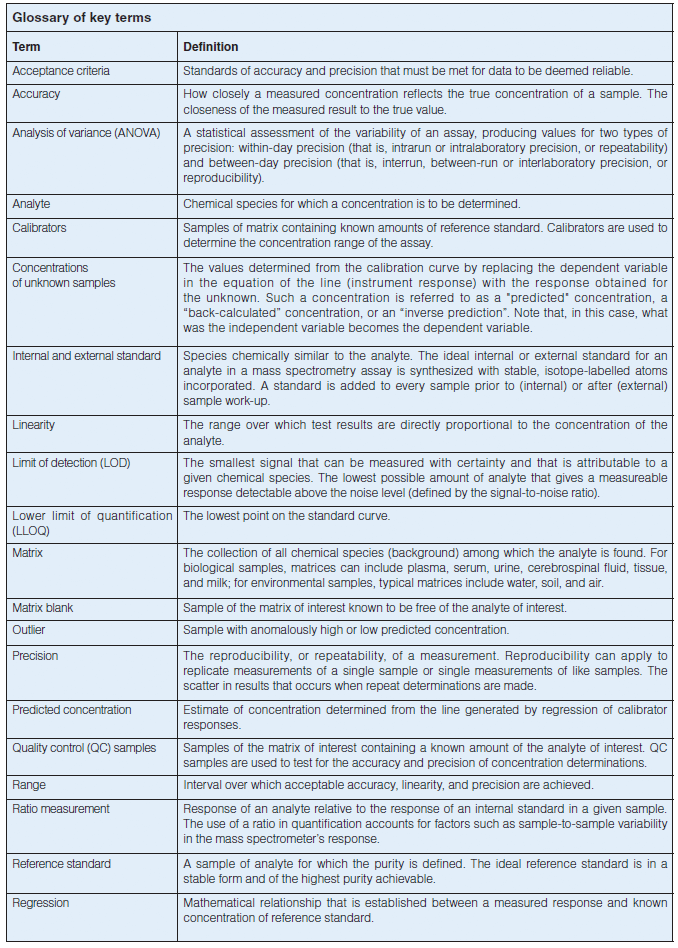
Glossary of key terms
The standard addition method, an alternative approach to quantification, is typically adopted when matrix effects are pronounced; analyte concentrations are at or near the limit of detection; the sample set is unique or diverse in composition; or when an analyte-free matrix is unavailable. The method of standard addition involves dividing a sample containing an unknown amount of analyte into two (or more) portions, after which a known amount of that analyte (often referred to as a spike) is added to one of these. The two samples are analyzed, and the analyte response in the spiked sample is compared to that in the unspiked sample. The larger response in the spiked sample is ascribed to the (additional) amount of analyte in the sample before the spike. The response provides a calibration point to determine the amount of analyte in the original sample. A linear response with concentration (or amount) is assumed with this two-point (or more) determination.
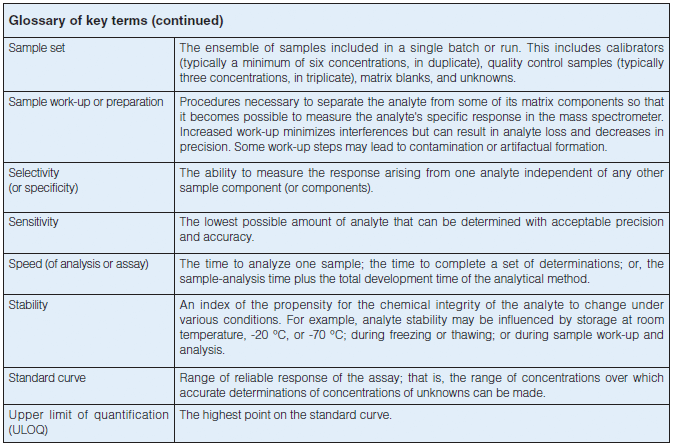
Glossary of key terms (continued)
Steps in a Typical MS Quantitative Assay
Although the steps vary, depending on the analyte and the matrix, the scheme described below is typical of what is used for the majority of small-molecule quantitative determinations based on MS. The objective is to generate two completely independent signals: one for the analyte and the other for the internal standard. The internal standard, if carefully selected and added early in the process, not only improves precision in the mass analysis steps, but also accounts for analyte loss during sample manipulation, work-up, and introduction (typically liquid chromatography [LC] or gas chromatography [GC]).
Preparation of Standards: Absolute quantification requires that relative levels be converted to absolute levels by reference to the calibration curve. As described above, the curve (or mathematical relationship between amount and response) is generated from data obtained by analyzing the standard samples that contain differing known amounts of the analyte of interest. The standards that constitute this curve are prepared in the same matrix and worked up at the same time as the samples.
Solubilizing the Analyte: When working with solid samples, a critical step is to dissolve the analyte of interest completely in a suitable solvent to create a stock solution that can be used to spike the calibration standards. It is also important to remove particulate debris from the stock that might otherwise interfere with the analysis.
Addition of the Internal Standard: A fixed amount of an appropriate internal standard is added to each sample: standard, quality control (QC), and unknown.
Sample Work-Up (Extraction and Concentration): The objective of sample work-up is to remove as many of the interfering substances as possible from the sample matrix, thus generating a relatively clean solution containing the highest possible concentration of the analyte per unit volume.
Sample Analysis: Frequently, sample analysis involves introducing the sample into a separations device (for example, GC or LC) coupled directly to the mass spectrometer. The mass spectrometer monitors at least two separate signals for all samples: one characteristic of the analyte and the other characteristic of the internal standard.
Regression of Calibrator Responses: The mathematical function that best fits the relationship between concentration and response (or, more correctly, response ratio) in the set of standard samples is determined.
Calculation of the Concentrations of the Analyte in All Samples: The ratio of the peak intensities for the analyte and the internal standard in each unknown sample is determined, and that ratio is converted to an absolute concentration or amount by reference to the calibration curve.
Evaluation of Data: Data evaluation is based on additional samples included in the analysis set, such as matrix blanks and quality-control samples. It is important to note the response of a sample containing no analyte, to ensure that no interferences occur within the matrix. It is also important to determine the appropriateness of the regression by calculating concentrations for samples of known composition. These test samples are often referred to as QCs.
The Need for Assay Validation
Quantitative analysis methods that rely on MS frequently undergo validation, a process that demonstrates the ability of an assay in toto to achieve its purpose. That purpose is to quantify analyte concentrations with a defined degree of accuracy and precision. Thus, the validation process demonstrates whether an analytical method performs as intended.
Validation ensures that an assay will produce quantitative data uncompromised in quality by errors in procedure. The primary objective is to assess the method's accuracy and precision: the value obtained must be a (statistically) good estimate of the true value, and repetitive measurements must yield values within the statistical distribution of good estimates of the true value. Secondarily, validation will establish the concentration range over which the method is reliable (the upper and lower limits of quantification), the selectivity (the presence or absence of interfering peaks), the amount of analyte recovered from a sample during its preparation for analysis, and the stability of the analyte in samples under defined conditions of storage.
Overview of Validation Procedure
Extrapolation of values beyond the range of the calibration curve is generally not acceptable. Such values would lie outside the linear range of the assay. Thus, for a given assay, the lowest and highest calibrators constituting the curve define the limits of quantification. The lower limit of quantification (LOQ or LLOQ) is the smallest amount or lowest concentration quantifiable that is consistent with the accuracy and precision required by the assay. Operationally, the International Union of Pure and Applied Chemistry (IUPAC) defines LOQ as the concentration that gives rise to a signal 10 times the standard deviation of the matrix blank and three times that of the limit of detection (LOD) (2). The upper limit of quantification (ULQ or ULOQ) may be determined by the physical - linear boundary of the regression line, potential for contamination of samples at low concentration, ion-suppression effects at high concentration, or simply by an experiment's parameters. A recent discussion of these and related topics can be found in reference 3.
Accuracy measures the closeness with which an individual measurement approaches the true value. Because all actual measurements are estimates of the true value, only by producing replicate measurements of the concentration of a sample is the true value approached. In practice, accuracy is often defined in terms of the deviation of the concentration predicted by the standard regression from the nominal concentration ascribed to it based on its preparation.
Two kinds of precision pertain. The first is associated with the repetitive (typically 3–6) measurements of a single sample (repeatability or the precision of the measurement) and the second is associated with repetitive (typically 3–6) preparations of a single homogeneous sample (reproducibility or precision of the method).
Because they provide different information, the precision of the measurement and method are often calculated and reported separately. The errors associated with the method, in toto, exceed in number those arising from instrument variation alone. The difference between the two is a measure of the errors associated with sample preparation. It should be noted that the error associated with any step is a function of the random errors contributed by all of the components and that the overall random error is, therefore, dominated by the least precise step or component.
A statistical assessment of the variability of an assay is often calculated as a part of the validation process. This analysis of variance (ANOVA) produces values for two types of precision: within-day precision (that is, intra-run or intra-laboratory precision, sometimes referred to as the repeatability) and between-day precision (that is, inter-run, between-run, or inter-laboratory precision, some-times referred to as the reproducibility).
Because more steps and more variables are involved in an assay process that extends over several days, the within-run relative standard deviation (RSD) is generally less than the between-run RSD. Nevertheless, fortuitous cancellation of errors between days can (very) occasionally result in a between-day precision value less than that of the within-day precision value. It should be noted that the precision decreases as the analyte concentration decreases, ultimately reaching unacceptable values to the point at which the measured signal approaches the LOQ. Characterization of the precision of the method over the entire concentration range, therefore, requires that the assessment be done at several different concentrations.
Additional Considerations
The combination of detection, identification, and measurement of target compounds, especially at low concentrations, is one of the most challenging tasks that mass spectrometrists undertake. In these situations - where a need exists to justify the choice of a particular method or substantiate the data obtained - the issue of "fitness for purpose" is crucial.
The term "fitness for purpose" describes " . . . the property of data produced by a measurement process that enables the user of the data to make technically correct decisions for a stated purpose" or ". . the magnitude of the uncertainty associated with a measurement in relation to the needs of the application area" (4–6). Yet "fitness for purpose" can also be described as the process by which the nature of a task is allowed to define the requirements of the method. Work that is primarily quantitative requires measurement at a specific level or within a specific range, and assay performance standards can be set to define a "zone of uncertainty" above or below a particular decision point, as shown in Figure 2. For work that blends qualitative and quantitative analyses, a decision point can be set at the centre of the zone of uncertainty with accuracy and precision indicated by expressions of associated confidence intervals.
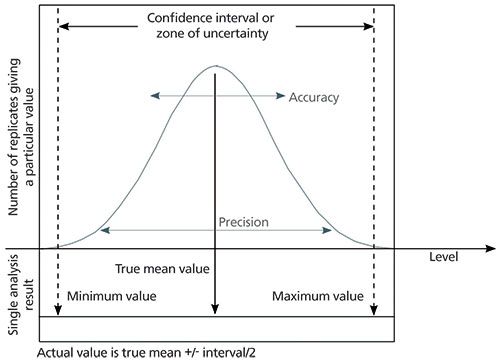
Figure 2: Uncertainty in quantitative analysis.
The goal is always to choose experimental conditions and mathematical manipulations that bring the mean result closer to the true mean and to minimize the confidence interval around the measurement, increasing accuracy and precision. When choosing the analytical approach, considerations such as cost, time, and the available instrumentation are major factors. The key to performing successful quantitative analyses, however, is to ensure that a chosen analytical method fits the specific purpose and to provide a level of uncertainty in measurement that lies within acceptable limits.
To ensure that the uncertainty associated with the results has been acknowledged and accepted, it is often useful, at the outset of planned work, to do as follows:
- Define the analytical problem, and consider the needs of all interested parties.
- Evaluate the perceived risk associated with the analyte and the consequences associated with the result.
- Balance thoroughness with time and resources.
- Define the tolerance or uncertainty.
- Specify limits for accuracy, precision, and false identification.
- Estimate the expected concentrations, and choose the range of calibrators accordingly.
Only in this way can answers be confidently given to questions posed by those who would use the data to make decisions.
P. Jane Gale, PhD, is currently Director of Educational Services at Waters Corporation. She has spent her career working in the field of mass spectrometry, first at RCA Laboratories and later at Bristol-Myers Squibb, where she was responsible for overseeing the development of quantitative bioanalytical assays to support clinical trials. She is a long-time member of the American Society for Mass Spectrometry (ASMS) and, together with Drs. Duncan and Yergey, created and taught the course in Quantitative Analysis given by the society at its annual conference for nearly a decade.
Mark W. Duncan, PhD, is active in the application of mass spectrometry to the development of biomarkers for disease diagnosis and patient management. He currently works both as an academic in the School of Medicine at the University of Colorado, USA, and as a research scientist at Biodesix Inc., in Boulder, Colorado. He also holds a visiting appointment at King Saud University in Riyadh, Saudi Arabia.
Alfred L. Yergey, PhD, obtained a B.S in chemistry from Muhlenberg College and his PhD in chemistry from The Pennsylvania State University. He completed a postdoctoral fellowship in the Department of Chemistry at Rice University. He joined the staff of the National Institute of Child Health and Human Development (NICHD), NIH in 1977 from which he retired in 2012 as Head of the Section of Metabolic Analysis and Mass Spectrometry and Director of the Institute's Mass Spectrometry Facility. Yergey was appointed as an NIH Scientist Emeritus upon retirement and maintains an active research program within the NICHD Mass Spectrometry Facility.
"MS - The Practical Art" Editor Kate Yu joined Waters in Milford, Massachusetts, USA, in 1998. She has a wealth of experience in applying LC–MS technologies to various application fields such as metabolite identification, metabolomics, quantitative bioanalysis, natural products, and environmental applications. Direct correspondence about this column should be addressed to "MS – The Practical Art", LCGC Europe, Honeycomb West, Chester Business Park, Chester, CH4 9QH, UK, or e-mail the editor-in-chief, Alasdair Matheson, at amatheson@advanstar.com
References
(1) M.W. Duncan, P.J. Gale, and A.L. Yergey, The Principles of Quantitative Mass Spectrometry (Denver, Rockpool Productions LLC, 2006).
(2) L.A. Currie, Pure and Appl. Chem.67(10), 1699–1723 (2009).
(3) H. Gu, G. Lui, J. Wang, A.-F. Aubry, and M.E. Arnold, Anal. Chem.86(18), 8959–8966 (2014).
(4) R. Baldwin, R.A. Bethem, R.K. Boyd, W.L. Budde, T. Cairns, R.D. Gibbons, J.D. Henion, M.A. Kaiser, D.L. Lewis, J.E. Matusik, J.A. Sphon, R. Stephany, and R.K. Trubey, J. Am. Soc. Mass Spectrom. 8, 1180–1190 (1997).
(5) R.A. Bethem and R.K. Boyd, J. Am. Soc Mass Spec.9, 643–648 (1998).
(6) R.A. Bethem, J. Boison, J. Gale, D. Heller, S. Lehotay, J. Loo, S. Musser, P. Price, and S. Stein, J. Am. Soc Mass Spectrom.14, 528–541 (2003).

New Study Reviews Chromatography Methods for Flavonoid Analysis
April 21st 2025Flavonoids are widely used metabolites that carry out various functions in different industries, such as food and cosmetics. Detecting, separating, and quantifying them in fruit species can be a complicated process.
University of Rouen-Normandy Scientists Explore Eco-Friendly Sampling Approach for GC-HRMS
April 17th 2025Root exudates—substances secreted by living plant roots—are challenging to sample, as they are typically extracted using artificial devices and can vary widely in both quantity and composition across plant species.

.png&w=3840&q=75)

.png&w=3840&q=75)


.png&w=3840&q=75)


.png&w=3840&q=75)


