Pinning Down Tailing Peaks
LCGC North America
The causes and cures for peak tailing are discussed, along with the various ways that chromatographers measure tailing peaks.
In an ideal world, chromatographic peaks always would be perfectly shaped, symmetrical Gaussian entities, but in the real world of inlets, columns, and detectors, much can happen to distort peaks' shapes and lead to peak tailing — the appearance upon elution of a significant portion of a peak's mass away from the apex toward later times.

John V. Hinshaw
Why Do Peaks Tail?
The familiar Gaussian peak shape really is only an approximation. It arises from a simplified peak elution theory that assumes, among other things, that interactions between solutes and the chromatographic system are symmetrical and independent of solute concentration. In a real instrument, solutes encounter extra mobile phase volumes in inlets, connections, and detectors, and the solutes' chemical interactions with the system are composed of multiple, often nonideal, concentration dependent encounters with the stationary phase, the support, and other materials.
Volumetric tailing: Solutes move through a chromatographic system while dissolved in the mobile phase — in the carrier gas when performing gas chromatography (GC). Solutes diffuse in all directions in the mobile phase as they are carried along. This is well and good as long as the flow path is free of extra void volumes or unswept areas. Figure 1 illustrates what can happen when void or unswept volumes are present. As a peak moves past an unswept area, some of the peak's mass can diffuse into it. After the peak moves on, solute molecules that diverted into the unswept area can diffuse back into the main mobile phase stream, but now they join the back of the peak and appear in the peak tail. The solute concentration in the unswept area declines at an approximately exponential decay rate as solute leaves the area and is replaced by carrier gas molecules.

Figure 1
A number of problems can cause volumetric peak tailing in GC. Installing a fused-silica column with the tip of the column too low in a split–splitless inlet can create tailing peaks because the full carrier gas split flow cannot reach the column entrance and sweep residual sample away. A similar problem exists in some detectors if makeup gas is not used: solute molecules can become trapped in unswept detector areas.
Volumetric peak tailing is a potential problem in splitless injection as well. Sample vapors expand rapidly and fill the inlet liner during the initial splitless injection period after sample has been deposited in the inlet liner. The split vent flow is disabled, so sample vapors flow through the liner and enter the column at the column flow rate: as much as 2 min can be required to transfer 80% or more of the vaporized sample into the column. Allowing this low flow condition to persist for much longer results in a severely tailing solvent peak that might obscure early eluted peaks. By establishing a high split flow after sample transfer into the column, the back of the solvent peak is cut off effectively.
Lack of sufficient septum-purge flow also can cause peak tailing when some solute or solvent escapes from the inlet liner up into the septum area during injection and is trapped there. The volatile material will escape slowly, and if not swept away by septum purge flow, it will be free to diffuse back into the carrier gas split flow and on into the column.
Tailing due to adsorptive interactions: As solutes move through a chromatographic system, they can undergo interactions other than normal adsorption–desorption onto or solution–dissolution into the stationary phase. One effect familiar to gas chromatographers is caused by active sites on surfaces exposed to the solutes — such as a poorly deactivated inlet liner or exposed areas of the column wall or support material. Such sites can engage in additional solute retardation mechanisms that hold solutes back from the main peak and cause tailing peak shapes. These interactions tend to manifest at lower solute concentrations, and as such, usually are present to some degree. Higher solute concentrations can provide enough additional material to saturate the active sites so that only a small fraction of the total solute present is affected.
Poorly cut capillary column ends can expose active surfaces to the sample, as will the careless insertion of a column into a ferrule without making a clean cut afterwards. Accumulation of nonvolatile sample residues in the inlet or the column entrance also can lead to peak tailing, which will be cumulative as the residues build up from one run to the next. Sometimes overheating a column, or exposure to large amounts of the wrong solvent, will remove or strip the stationary phase and result in peak tailing from the exposed, more active surfaces.
It is difficult to avoid some degree of peak tailing for polar or labile peaks that strongly interact with surface imperfections. Carboxylic acids as well as strongly basic compounds will tail strongly, although specialized stationary phases are available for many such problem samples.
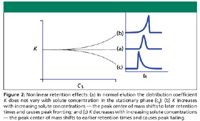
Tailing due to nonlinear retention: Ideal stationary phase retention does not depend upon the solute concentration: the strength of retention, as expressed by the distribution coefficient K, should be constant across an entire peak, from start to finish. In a sense, solute molecules should behave as if infinitely dilute in the stationary phase and should not be affected by the presence of other solute molecules.
Peak tailing arises when solute interactions with the stationary phase change with concentration. As solute concentrations rise during the front half of a peak, the value of K might change if the chemical nature of the stationary phase is modified by the presence of larger solute concentrations, so that the solute molecules themselves become an active part of the stationary phase. As a result, those solute molecules present near the middle of the peak at sufficiently high concentrations will be shifted relative to those in low concentration areas near the start and end of the peak. Peak fronting results if concentration-related changes in retention across a peak cause the peak's center of mass to shift to later retention times, while tailing occurs if the opposite is true. Figure 2 illustrates these situations.

Figure 2
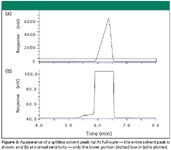
Fortunately, concentrations sufficiently high to cause these effects are not encountered normally in elution gas chromatography, except in the case of a large solvent peak such as encountered in splitless injection. Figure 3 shows what a fronting splitless solvent peak looks like when viewed with the entire splitless solvent peak on scale, as compared with the more familiar square looking peak viewed at sensitivity high enough to reveal solute peaks at normal GC concentrations. Splitless injection uses this solvent peak fronting effect to advantage by engendering a rapidly declining solvent peak, which makes it easier to discern peaks that are eluted close after the solvent peak. This effect is in addition to the solvent peak cutoff that occurs when split flow is restored after a splitless injection.

Figure 3
Measurement of Peak Tailing
Several peak-tailing measurements are in use today. Most of these measurements do not correlate directly or scale with each other, so it is important to use one measurement method consistently. There is no standard symbol for chromatographic peak symmetry or asymmetry: in this article, the symbols Sp and As, respectively, will be used. The subscripts will be followed by an indication of the type of measurement used for the calculation, for example, the term As, 10% refers to an asymmetry calculation made on the basis of peak measurements at 10% of the peak height.
Peak symmetry and asymmetry are terms used in this context to describe either the lack or extent of peak tailing or fronting. Peak asymmetry is equal to one over the symmetry, as calculated from the same measured parts of a peak:

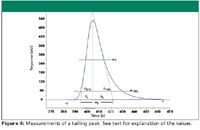
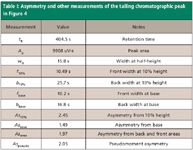
Peak asymmetry is sometimes called the tailing factor; however, this is true only for tailing peaks. A value of 1.0 indicates the peak is symmetrical — its front and back sections are nominally the same width. Asymmetry measurements for the peak in Figure 4 are given in Table I for each of the following calculation methods.

Figure 4
Front-to-back ratio measurements: The simplest type of peak symmetry measurements relate the width of the peak before and after its retention time. Figure 4 shows a tailing peak and various measurements of the times between the peak's rising side, its retention time, and the falling side of the peak.

Table I: Asymmetry and other measurements of the tailing chromatographic peak in Figure 4
One commonly used (1) asymmetry measurement takes the ratio of the front to back widths at 10% of the peak height:

In this measurement, an asymmetry value of greater than one indicates a tailing peak, and an asymmetry less than 1 indicates a fronting peak profile.
A related measurement uses the front and back widths at the baseline, where the lines tangent to the peak's inflection points intersect it:

The United States Pharmacopeia (USP) definition of asymmetry (2) uses peak widths at 5% of the peak height to divide twice the front peak width into the total width:

This definition assumes that, for moderately tailing peaks, the front width of the peak is close to the front width of a nontailing peak: the term 2f5% is an approximation of the width at 5% that a nontailing peak would exhibit. Thus, equation 4 gives the ratio of the actual peak width at 5% to an approximation of the total peak width that might be observed if there were no tailing. The more strongly a peak tails, the larger the value of AsUSP.
It is important to note that equation 2 (now calculated with peak widths measured at 5% of the peak height) and equation 4 do not produce the same values except when the front and back widths are the same and the asymmetry is equal to 1.0:

If the peak has a fronting profile, the 2f5% term in equation 4 no longer approximates a nontailing peak's width. Instead, an estimate of twice the peak's backwidth would be suitable in the fronting-peak case. Ettre (3) defines asymmetry in terms of the absolute difference Δw between the front and back portions of a peak:

The asymmetry of a peak can then be written as

Asymmetry calculated according to equation 4 is equal to that calculated using equation 7 with measurements at 5% of peak height when the back part of a peak is larger than the front part, in other words, for a tailing peak. For a fronting peak, equation 7 gives the same asymmetry value as for an equivalent but reversed tailing peak. In this case, however, it is necessary to specify whether the peak in question has a tailing or fronting profile.
Other measurements: Two other measurements of peak tailing should be mentioned. First, some authors have used the ratio of the area of a peak after the apex, to the area before the apex:

This metric is more difficult to calculate unless it is preprogrammed into a chromatography data-handling system.
Another method uses the statistical moments or their estimates to compute asymmetry. The statistical moments themselves, as computed from the raw chromatographic data points, are prone to large fluctuations due to the statistical accumulation of noise present in the base chromatographic signal. Pseudomoments can be estimated from area slices across sections of a peak and then used to calculate asymmetry. Interested readers should refer online to reference 4 for a detailed description, which is too long to include here. The calculation of asymmetry from pseudomoments of the peak in Figure 4 was performed by adding the relevant computations described in reference 4 to a proprietary chromatography data-handling system, and not with the commercial system mentioned in the reference. Due to the nature of ongoing software development, subsequent revisions to the commercial software can produce different results than described in the reference.
Finally, it is possible to fit a theoretical peak shape to the real chromatographic data, and then derive the asymmetry plus many other statistics from the fitted peak. Felinger's comprehensive book Data Analysis and Signal Processing in Chromatography (5) describes at least 11 variations on various empirical peak-shape models that can be applied. The exponentially modified Gaussian (EMG) method was used to generate the peak in Figure 4. Again, however, these methods must be programmed into a computer system for practical implementation.
Conclusion
Most chromatographic peaks tail to some degree. Small amounts of peak tailing are tolerated and not usually observed except at very low concentrations. The presence of significant peak tailing indicates a potential problem with extra unswept dead volumes, low flow rates, active sites, or nonlinear retention effects.
Peak asymmetry can be calculated by a number of different methods that are not directly related. Chromatographers should ensure that peak asymmetry and other statistical measurements are measured consistently with the same methods from well controlled chromatograms whenever such metrics are to be used for comparative, quality control (QC), regulatory, or system suitability requirements.
By measuring and controlling peak asymmetry, chromatographers can achieve better quality separations, and can benefit from early indications of a systematic problem. The effects of poor peak symmetry on plate numbers and resolution will be addressed in a future installment.
John V. Hinshaw
"GC Connections" editor John V. Hinshaw is senior Research Scientist at Serveron Corp., Hillsboro, Oregon, and a member of LCGC's editorial advisory board. Direct correspondence about this column to "GC Connections," LCGC, Woodbridge Corporate Plaza, 485 Route 1 South, Building F, First Floor, Iselin, NJ 08830, e-mail lcgcedit@lcgcmag.com. For an ongoing discussion of GC issues with John Hinshaw and other chromatographers, visit the Chromatography Forum discussion group at http://www.chromforum.com.
References
(1) H.M. McNair and J.M. Miller, Basic Gas Chromatography (Wiley Interscience, New York, 1998), pp. 35–36.
(2) The United States Pharmacopeia, XX Revision (USP, Rockville, Maryland, 1988), pp. 943–946.
(3) L.S. Ettre and J.V. Hinshaw, Basic Relationships of Gas Chromatography (Advanstar, Cleveland, Ohio, 1993), pp. 15–17.
(4) "Evaluating System Suitability" (Agilent Technologies, Santa Clara, California), http://www.chem.agilent.com/Library/Support/Documents/a10424.pdf
(5) A. Felinger, Data Analysis and Signal Processing in Chromatography (Elsevier, Amsterdam, The Netherlands, 1998).

Detecting Hyper-Fast Chromatographic Peaks Using Ion Mobility Spectrometry
May 6th 2025Ion mobility spectrometers can detect trace compounds quickly, though they can face various issues with detecting certain peaks. University of Hannover scientists created a new system for resolving hyper-fast gas chromatography (GC) peaks.
Altering Capillary Gas Chromatography Systems Using Silicon Pneumatic Microvalves
May 5th 2025Many multi-column gas chromatography systems use two-position multi-port switching valves, which can suffer from delays in valve switching. Shimadzu researchers aimed to create a new sampling and switching module for these systems.
New Study Reviews Chromatography Methods for Flavonoid Analysis
April 21st 2025Flavonoids are widely used metabolites that carry out various functions in different industries, such as food and cosmetics. Detecting, separating, and quantifying them in fruit species can be a complicated process.

.png&w=3840&q=75)

.png&w=3840&q=75)


.png&w=3840&q=75)


.png&w=3840&q=75)


