Separation, Identification, and Quantitation of Water-Soluble Vitamins by HPLC
LCGC North America
The authors set out to perform a separation of seven water-soluble vitamins without the use of ion-pair reagents.
The accurate measurement of vitamins in conventional dietary supplement tablets and dietary supplement drinks that are consumed widely by the general public is of utmost importance. Vitamins are necessary for proper body function, and consuming too little or too much can be harmful to an individual's health. This makes it imperative that values reported for the amounts of vitamins in these supplements are measured accurately. Dwyer and colleagues (2) have shown that while analytically validated information on the vitamin content in food is relatively complete, the same information for dietary supplements is not. According to the authors, the differences between label values and actual content of vitamins in dietary supplements have not been studied extensively. Labels are required to reflect minimum content of nutrients according to U.S. regulatory requirements, so the actual nutrient content often is higher than stated. The amount of the overage is dependent upon several factors, including the cost of the vitamin and its stability.
Many methods, including USP methods (3) currently used for the separation and quantitation of water-soluble vitamins use mobile phase additives including ion-pair reagents and EDTA. Ion-pair reagents are used as mobile phase additives to allow successful separation of polar substances on reversed-phase high performance liquid chromatography (HPLC) columns. They improve resolution and peak shape, particularly by reducing tailing. However, their use can result in irreversible changes in column performance due to adsorption of the ion-pair reagent onto the stationary phase (4), resulting in either a change in selectivity of the column or longer equilibration times. Through the elimination of ion-pair reagents, the proposed method avoids this damage to the chromatographic column. In addition, the simplified mobile phase lowers the cost of analysis and avoids interferences with the separation and problems with detection during gradient elution.
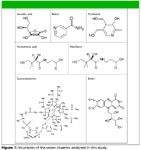
Figure 1
Experimental
Materials: Analytical grade vitamin standards were purchased from Sigma-Aldrich (Milwaukee, Wisconsin). See Figure 1 for structures. Water (EMD Chemicals, Gibbstown, New Jersey) and methanol (Burdick and Jackson, Muskegan, Mchigan) were HPLC grade. Sodium dihydrogen phosphate, ultrapure bioreagent grade, was purchased from J.T.Baker, Phillipsburg, New Jersey, and phosphoric acid, HPLC grade, was purchased from Fisher Scientific, Pittsburgh, Pennsylvania.
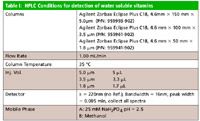
Table I
Instrumentation: An Agilent 1200 SL Rapid Resolution liquid chromatograph with a binary pump, autosampler, inline degasser, temperature-controlled column compartment, and an 80 Hz diode-array detector (Agilent Technologies, Inc., Santa Rosa, California) were used for the analysis. The detector flow cell selected for this study was a micro flow cell with a 2-µL volume. Sample peaks were identified positively by two methods: by matching retention times and by comparison of UV spectra from a spectral database created with this instrument. Spectra also were used to determine the peak purity. Chemstation for LC 3D Systems, Rev. B.03.01, was used for data collection and analysis.
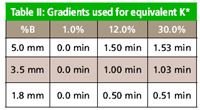
Table II
Standard preparation: Individual standards used for retention time determination and preparation of spectral database were prepared by weighing the appropriate amount of standard using a microbalance and then dissolving in 10 mL of water. Calibration standards were prepared by serial dilution of a stock solution that included all the vitamins being analyzed.
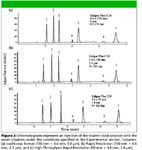
Figure 2
Sample preparation: Aliquots of VitaminWater (Glaceau, Flushing, New York) were injected without dilution. A minimum of 30 vitamin tablets (Berkley & Jensen Children's Chewable Complete Multi Vitamins and Minerals Supplement, Natick, Massachusetts, and Equate Adult Multivitamin, Walmart, Bentonville, Arkansas) were ground and the equivalent of one tablet was weighed out and extracted in water in an ultrasonic bath for 5 min.
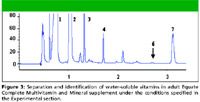
Figure 3
All samples were filtered before injection with Agilent syringe Econofilter, regenerated cellulose, 25-mm diameter, 0.20-µm porosity. Due to decomposition issues all solutions were prepared daily (5,6).

Figure 4
HPLC conditions: All separation conditions are reported in Table I. The flow rate was kept constant for all three column dimensions, but the gradient was changed as shown in Table II to keep the K* values equivalent. The injection volume also was scaled based upon the column dimensions.

Table III
Results and Discussion
Figure 2 shows chromatograms of vitamin standards injected on three columns of different dimensions for comparison. Peaks are identified in Table III. Seven water-soluble vitamins were separated without the use of ion-pair reagents. The average tailing factors for the analytes on all the columns was < 1.2, well within the acceptable limits for tailing factors for these compounds as stated by the USP (3). The average % RSD for retention times on the 1.8-µm column was 0.4 % with none greater than 1.4 %, showing that the chromatographic method is precise for seven replicate injections.

Table IV
As shown in Figure 2, the separation was quite good, with all the peaks being well resolved. Based upon this observation, the method could have been optimized further by increasing the flow rate. This was done at a flow rate of 1.5 mL/min without negative effects on the separation of solution standards. When the vitamin supplements were analyzed using the faster flow rate, however, the identification of some of the vitamins of interest could not be performed due to overlapping unidentified peaks from other ingredients in the vitamins. Because of this, the flow rate was kept at 1.0 mL/min for analysis of the vitamin supplements.

Table V
Identification
Figures 3 and 4 show chromatograms of the adult and children's chewable vitamin supplements, respectively. The solutions of these supplements were prepared as indicated in the experimental section, with no additional clean up before injection. In both vitamin supplements, six of seven vitamins of interest were identified. In the VitaminWater vitamin supplement drink, only five of the vitamins of interest were present, and four of these were positively identified. Sample peaks were identified positively by two methods: by matching retention times and by comparison with their reference spectra. Cyanocobalamin was not identified in any of the vitamin supplements or the vitamin drink, because it is needed in only very small amounts in the body, and only a few micrograms are present in the samples. The vitamin-containing water was not as complex a matrix to analyze and displayed only a few well resolved peaks. The chromatogram was not included.
Quantitation
Quantitation was performed for pyridoxine and niacin in both the supplements and the vitamin drink. These analytes were selected because they were present in all three samples, and they did not require additional clean up procedures to eliminate interferences. The results for the quantitation of these analytes are shown in Table IV. The expected values are given to the number of significant figures listed on the label or provided by the manufacturer. As expected due to U.S. regulatory requirements, all except one of the measured values was greater than the label value for the two vitamins used for quantitation.
Comparison of Column Configurations
The final goal was to investigate the effects of column dimension and particle size on resolution, separation time, pressure, and sensitivity. The three columns used in this study were manufactured using the same type of base silica. The variable column dimensions are given in Table I. The columns all have the same inner diameter, so the same flow rate can be used and the linear velocity will remain constant. The variables that differ for these columns are the length and the particle sizes.
The dwell volume was the same for all the separations, so no adjustment needed to be made for this. A gradient was used in this separation, so it must be adjusted to account for the difference in column length. This involves calculating the number of column volumes in each segment of the original gradient and adjusting the gradient times used for each column to give the same number of column volumes between each segment on each column. Equation 1 was used to calculate the gradient times for the three columns, and the resulting values are given in Table II. In this equation, t g is the gradient time, F is the flow rate, L is the column length, and d is the column diameter.

The injection volumes also needed to be adjusted for each column because the three columns had different dimensions and therefore different sample capacities. This is done to avoid phase overload, keeping the chromatograms consistent from column to column. Equation 2 was used to calculate the appropriate injection volumes for the three columns, and the resulting values are given in Table I. In this equation, the variables are the same as Equation 1, and V is the injection volume.

As seen in Figure 2, the separation times decreased as the shorter columns were used; however, the separation remained consistent without loss of resolution. The column pressure did increase from 170 bar to 300 bar as the particle size was decreased from 5 µm to 1.8 µm. However, at these pressures, the separation still could be performed on a traditional HPLC instrument as long as care was taken in reducing the extra column volume.
The increase in sensitivity as the column configurations were changed is probably the most striking difference in the comparison of the three columns. Table V shows the gain in sensitivity for cyanocobalamin. For this portion of the experiment, the standard vitamin mixture was injected into the three different columns. The injection volume was scaled proportionally to column length, so the peak heights are not compared directly. To compare the sensitivity, the amount injected is normalized, making the ratio of the peak areas to injected amounts the same. The data in Table V show that there is still a significant difference in the ratio of the heights and the injected amounts. This means there is a significant increase in the sensitivity of the 3.5-µm column compared with the 5-µm column, and another significant increase in the sensitivity of the 1.8-µm column. The values shown in Table V are for the gain in sensitivity in comparison to the 5-µm column. The gain in sensitivity when the column is changed from a 5-µm column to a 3.5-µm column is 34%, while the gain in sensitivity when the column is changed from a 5-µm column to a 1.8-µm column is 52%. This gain in sensitivity is due to the higher efficiency (that is, lower dilution factors) of the smaller particles, not simply because the analytes spend less time in the column (7).
Conclusion
Separation, identification, and accurate quantitation of vitamins in commercially available supplements is very important because the health of consumers may be dependent upon the amount of vitamins consumed through their diet and the use of supplements. U.S. regulatory requirements state that labels must reflect the minimum amount of the vitamins present, which does not necessarily give consumers the information they need to make informed choices. A method has been presented that can be used for the determination of seven water-soluble vitamins in different commercially available supplements. This method does not require the use of ion-pair reagents or many additives to the mobile phase, as many previous methods have.
By using three column dimensions, the data also can be used to illustrate the effect of decreasing particle size in the columns and changing the lengths of chromatographic columns on different separation attributes. Knowledge of these effects is of great importance as modern HPLC technologies are tending toward smaller particle sizes and faster separations.
Different types of supplements contain different binders and other substances that can interfere with the quantitation of vitamins. Each type of sample requires a specific method of sample preparation and clean up before introduction into the HPLC column. Some of these samples require methods as simple as the use of syringe filters or centrifugation, while others require methods such as solid phase extraction. If adequate sample clean up is performed before HPLC analysis, the flow rate used for the analysis can be increased without loss of separation.
Acknowledgments
The Authors would like to thank Ron Majors and Agilent Technologies for the loan of the instrument, donation of the columns used, and funding to complete this project.
Karyn M. Usher, Anna Glinko, Michael J. Bozym, and Michelle L. Owens
Department of Chemistry, West Chester University of Pennsylvania, West Chester, Pennsylvania
Please direct correspondence to KUsher@wcupa.edu
References
(1) G. F. Combs, Jr., The Vitamins: Fundamental Aspects in Nutrition and Health, San Diego: Academic Press, 1998.
(2) J.T. Dwyer Anal. Bioanal. Chem.389, 37–46 (2007).
(3) U.S. Pharmacopeia National Formulary, USP 31 NF 26, May 1, 2008.
(4) L.R. Snyder, J.L. Glajch, and J.J. Kirkland, Practical HPLC Method Development, 2nd ed. (Wiley, New York, 1997)
(5) J.P. Yuan and F. Chen, J. Agric. Food Chem. 46(12), 5078–5082 (1998).
(6) S.A. Margolis and E. Park, Clinical Chem.47, 1463–1464 (2001).
(7) A. Glinko, M.J. Bozym, M.L. Owens, K.M. Usher, R. Majors, Agilent Technologies Pharmaceutical Food/Beverage application note, 5989-9313EN, (2008).

Polysorbate Quantification and Degradation Analysis via LC and Charged Aerosol Detection
April 9th 2025Scientists from ThermoFisher Scientific published a review article in the Journal of Chromatography A that provided an overview of HPLC analysis using charged aerosol detection can help with polysorbate quantification.
Analyzing Vitamin K1 Levels in Vegetables Eaten by Warfarin Patients Using HPLC UV–vis
April 9th 2025Research conducted by the Universitas Padjadjaran (Sumedang, Indonesia) focused on the measurement of vitamin K1 in various vegetables (specifically lettuce, cabbage, napa cabbage, and spinach) that were ingested by patients using warfarin. High performance liquid chromatography (HPLC) equipped with an ultraviolet detector set at 245 nm was used as the analytical technique.
Removing Double-Stranded RNA Impurities Using Chromatography
April 8th 2025Researchers from Agency for Science, Technology and Research in Singapore recently published a review article exploring how chromatography can be used to remove double-stranded RNA impurities during mRNA therapeutics production.


