Ion Mobility Spectrometry (IMS): How It Works and Its Use in Biotechnology
IMS is a valuable tool for biopharmaceutical analysis. Two formats in particular have proven useful: cyclic IMS and structures for lossless manipulations (SLIM).
Why has IMS and IMS-MS become so prevalent and popular to use within the past decade or two for proteins, biopolymers, biopharmaceuticals, antibody–drug complexes, and related materials?
Ion mobility spectrometry (IMS) is not a new technique, and has been described in the scientific literature for more than 50 years (1,2). Because it is a separations technique, IMS can stand alone without being connected to mass spectrometry (MS), but it requires some sort of detector, which is fed newly resolved ions from the original sample, often separated via a drift tube (DT), which can be seen in Figure 1a (1). There are two commonly used formats for doing IMS, the first being drift tube ion mobility spectrometry (DTIMS), and the second being a traveling wave ion mobility spectrometer (TWIMS), as seen in Figure 1b (1). TWIMS is usually the higher resolving or separations module. DTIMS has been termed as high-field, asymmetric waveform ion mobility spectrometry (FAIMS).
FIGURE 1: Two conceptual schematic diagrams of commercially available time-dispersive IM-MS instrumentation. (a) An electrostatic drift tube ion mobility spectrometer (DTIMS) coupled to a quadrupole time-of-flight (QTOF) mass spectrometer, and (b) an electro-dynamic traveling wave ion mobility spectrometer (TWIMS) coupled with a quadrupole mass filter and a QTOF instrument. Conceptual experimental sequences are shown in the insets of each panel and illustrate the mechanism giving rise to the temporal separation of smaller and larger collision cross section ions experimentally observed in each technique (Reprinted with permission from American Chemical Society).
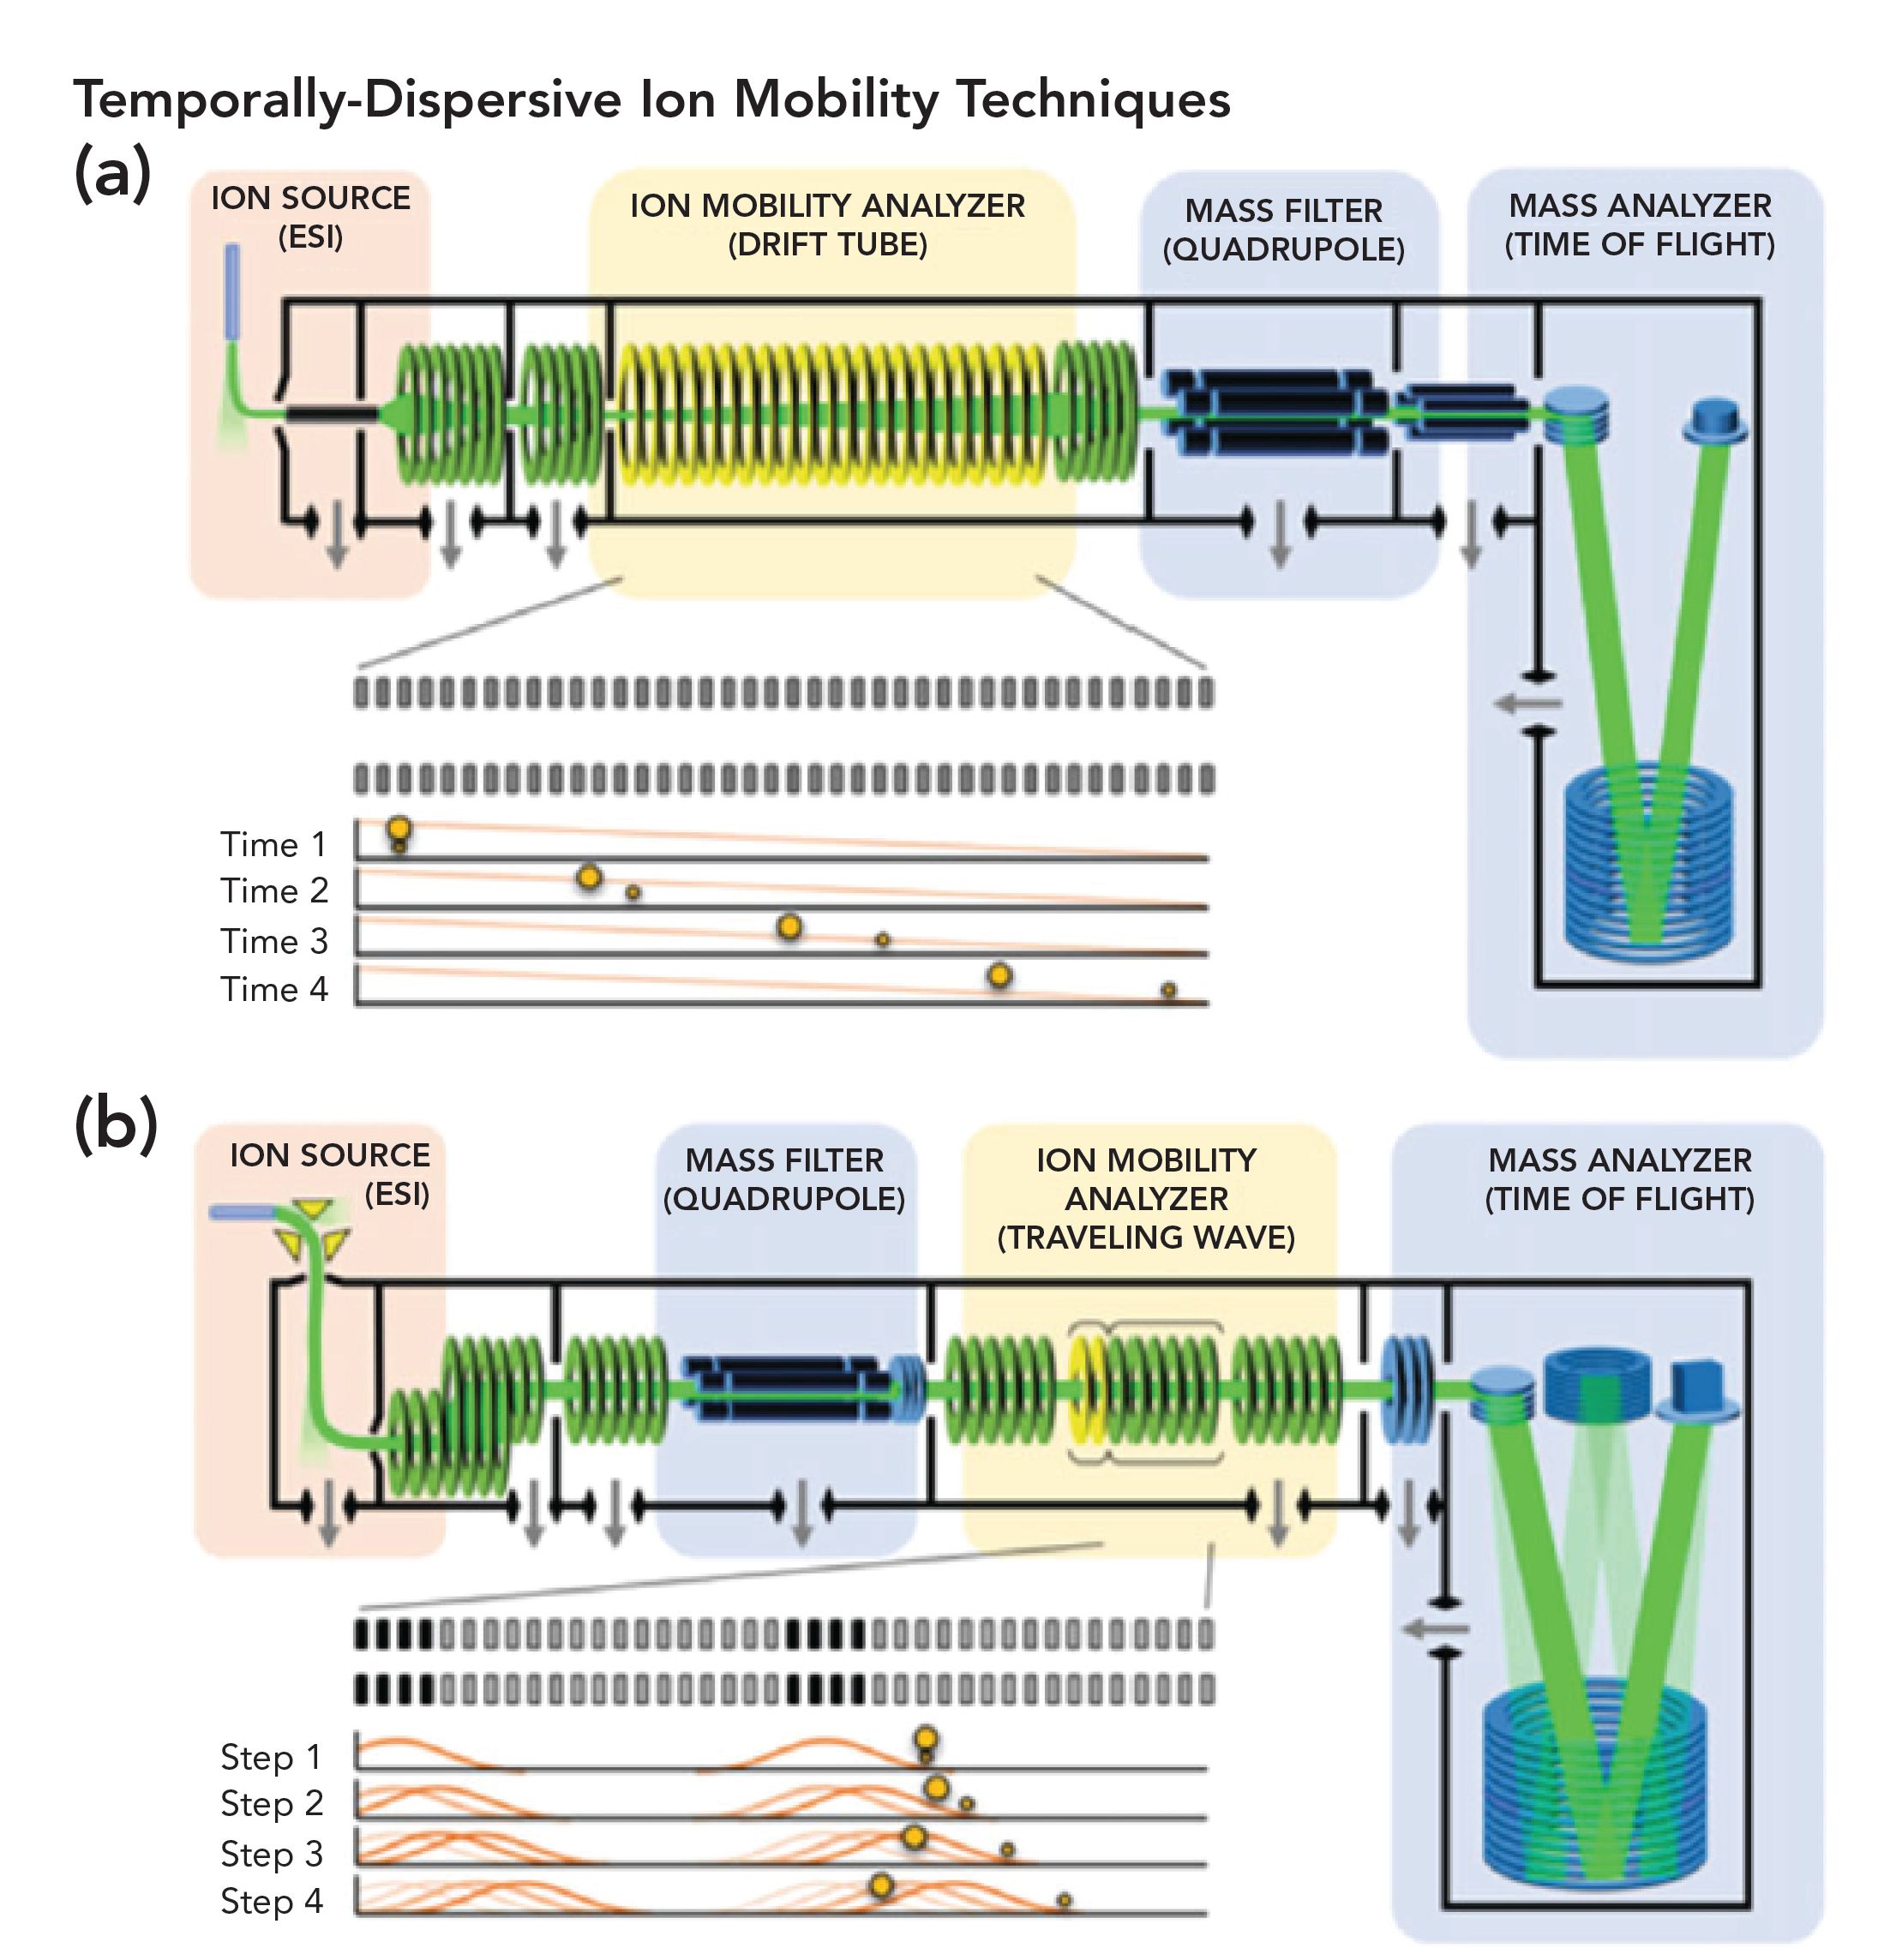
In these configurations, there is a need for a carrier gas to sweep the ions coming from the ion source. This is almost always an electrospray ionization (ESI) system. In either of these instrumental configurations, modern interfacing almost always relies on some MS instrumentation. MS detection provides a direct ability to determine parent ion structures, as well as fragmentation mechanisms, coming from the original molecular ion after the IMS. IMS is a separations instrument, and depending on what is used, as seen in Figures 1a and 1b, it provides low and high ion resolutions. Figure 1a shows the resolution via the drift tube of the parent ion and moving, inert gas, as well as the single quadruple. Figure 1b, on the other hand, shows how the parent ion fragments via the single quadruple before each of these fragments is resolved via the IM analyzer’s traveling wave. Finally, each remaining fragment is resolved by time-of-flight mass spectrometry (TOF-MS). However, the literature does not appear to cover resolution differences between these two instrumental configurations. It has been difficult to locate a study that makes a direct comparison between DTIMS and FAIMS, though we believe that FAIMS has the higher resolving power.
Considering the separation of the two components first introduced, Figure 1a shows that, as a function of distance, these components become better resolved based on differences in their collisional cross sections (CCS). When IMS is used without a MS, the only useful information provided is CCS. Indeed, there is extensive literature, especially coming from around the year 2000, that did not use MS but instead used a refractive index (RI), ultraviolet (UV), or electron capture detector (ECD). There were numerous applications for such instrumentation, especially as sniffers for drugs of abuse, explosives at airports, check-in counters, and other, simpler applications. Almost all of the literature discusses using cationic fragmentation, and most also discus electrospray ionization (ESI), but some have used matrix assisted laser desorption ionization (MALDI) as well.
Figure 2 illustrates in diagrammatic format a conceptual IM-MS analytical workflow that incorporates various front- end separation techniques, then combining a conventional drift cell, showing separation of the sample ions and structure separations arising from differences in drift time (2). Finally, each individual sample component is separately introduced into the MS analyzer. On the far right of Figure 2, the resolution of sample components comprising glycans, peptides, lipids, and their metabolites is indicated. Each of these species has a different drift time and m/z ratio, but only some of them represent the original, parent species first introduced with the same molecular weights and molecular ions. The other ions represent fragmentations that occurred along the way through the IM-MS system.
FIGURE 2: A conceptual IM-MS analytical workflow incorporating various front-end separation techniques (SPE–solid-phase extraction; SFC–supercritical fluidic chroma- tography; LC–liquid chromatography; CE–capillary electrophoresis GC–gas chroma- tography). The resulting IM-MS analysis yields drift time vs. m/z spectra that can be interpreted for relative size-mass information intrinsic to different biochemical classes (Reprinted with permission from Elsevier).

The resulting IM-MS analysis thus yields drift time compared to the m/z spectra, which can then be interpreted for relative, size-to-mass information, intrinsic to different biochemical classes. There are very few, alternative analytical techniques that can provide both IMS relative mobilities and sizes, resolution of different groups of organic analytes, and identification by high-resolution mass spectroscopy (HRMS) of individual, original sample components, most fully resolved from one another (2).
Before leaving this section, we must emphasize the importance of determining CCS information about the ions going into the MS instrument. Because this is a drift gas separation, the lightest ions will emit from the drift tube before the higher molecular weight (MW) species. Multiply charged ions may be emitted, depending on the efficiency of the ESI steps. The larger the starting molecules, the more multiply charged ions that may be observed. It is, of course, essential or desirable to have the length of the drift tube sufficient so that these differently charged ions can be separated before the MS steps. Thus, longer drift tubes and times usually result in an improved resolution of multiply charged ions before the MS steps, making it much simpler to interpret each MS spectrum. Cyclic-IMS (cIMS) accomplishes this very desirable feat, and with greatly improved resolution of most or all initial species.
There are various lengths of fixed-length drift tubes that can be utilized for any given analyte mixture, usually depending on its complexity and number of analytes needing resolution before the MS step. We should also mention that IMS can be used for direct sample introduction or it can readily be interfaced with almost any previously described separations method known today. Most often, these would include ultrahigh performance liquid chromatography (UHPLC), high performance capillary electrophoresis (HPCE), “high performance gas chromatography (HPGC) or high resolution gas chromatography (HRGC). IMS is not (other than cIMS) a high resolution technique; it is an interface between such steps and the final mass spectrometry and is all online and automated, with direct sample introduction and data collection. The total resolution comes from the UHPLC, IMS, and MS systems. What IMS adds are the additional separations steps (in the case of cIMS, these can be almost any length or times), and the ability to study individual, multiply charged ions from the original analyte. This becomes very useful and interesting with higher MWs of biochemical and organic structures. The ability to study higher charge states of highly complex organic or bio-organic analytes is only possible using this combination of UHPLC-IMS-HRMS. This point leads us to a discussion of more hyphenated techniques in IMS and a plethora of acronyms.
Comparing IMS techniques for Resolution of Complex Mixtures of Proteins and Peptides
IMS originally was a single separation step (FAIMS or TWIMS), whose separation potential was dependent on the length of the FAIMS drift tube or the dimensions of a TWIMS dimension system. This was drastically changed by the introduction of cyclic IMS, aka cIMS, in the mid-1990s, which has only recently been commercialized. To our knowledge, there is today but a single source for commercial cIMS instrumentation.
Cyclic IMS (cIMS)
One cannot do cIMS with any current, off-the-shelf IMS system without major modifications. To our understanding, the only commercial system is that from Waters Corporation. Their website contains a plethora of useful information regarding their recently introduced cIMS package. However, non-commercial cIMS instrumentation was introduced long before the Waters system became commercialized in 2019.
There were, since the late 1990s, at least two major research and development (R&D) groups interested in converting traditional IMS methods, DTIMS and TWIMS, into instrumentation able to improve resolution and lower limits of detection for complex samples. Perhaps the first of these to publish extensively was led by David Clemmer and his group at Indiana University. He is still very active in this field, having realized significant improvements in resolution utilizing IMS. His R&D team emphasized determining structures in large, low-symmetry systems in the gas phase, but it is really cIMS. A second, very active group in this area has been currently at the University of Connecticut, led by Don Fabris (3).
A third R&D group, since about 2014, having originally introduced the Waters line of TWIMS instrumentation about 2005, not involving cIMS, has been led by several R&D scientists within Waters, such as Emma Marsden-Edwards (3,4). Their first product involving cIMS was introduced in 2019. To our knowledge, this is today the only commercially available cIMS system. The goal of both the Clemmers and Waters groups has always been to design and produce new IMS technology with higher resolving power to provide analysis of the finer, structural differences between analytes. This has not been accomplished by drastically varying the fundamental nature of the IMS system, at least in the Waters case. Rather, it has involved enabling repeated passages of the starting analytes through basically the same IMS unit (FAIMS). That creates more separating potential in the IMS alone, which when matched with HRMS leads to vastly improved and enhanced MS data and informational content. Cyclic IMS realizes these advantages, and they are real advantages over conventional IMS of any type because of the much improved resolving ability of repeated passages through the same IMS system. Each injection experiences, within the FAIMS part of the instrumentation, a much longer pathlength before entering the MS instrument itself. As we have already learned, longer pathlengths lead to improved resolution, as seen in techniques like Fourier-transform infrared spectroscopy (FT-IR), fluorescence (FL) spectroscopy, UV-vis, and Raman spectroscopy.
Figure 3 shows that both research groups produced a cyclic pathlength design that permitted ions to move around in multiple passes, achieving higher resolution without requiring an extended, linear arrangement. In essence, such arrangements, strikingly similar between both R&D groups, then permitted greater resolving power in the same space, through multifunction capabilities, using IMSn selection and activation experiments. A major design obstacle has been finding a method to transport ions from the original, straight-line path through the device, orthogonally around the cyclic path. This was eventually solved in the Waters group as it had been earlier in Clemmer’s group. However, in Waters‘s instrumentation, a newer array of electrodes could control whether the traveling waves moved the ions in the direction of the main axis of the MS instrument or around the cyclic path length. In both groups, through using different engineering, this obstacle has been fully resolved and both instrumentation sets are perhaps equally able to perform high resolution IMS studies and analyses.
FIGURE 3: (a) Instrument schematic showing the Q-cIM-ToF geometry, (b) Cartoon showing the orthogonal arrangement of the cyclic IMS and neighboring species, (c) Multifunction region (Reprinted with permission from John Wiley and Sons).
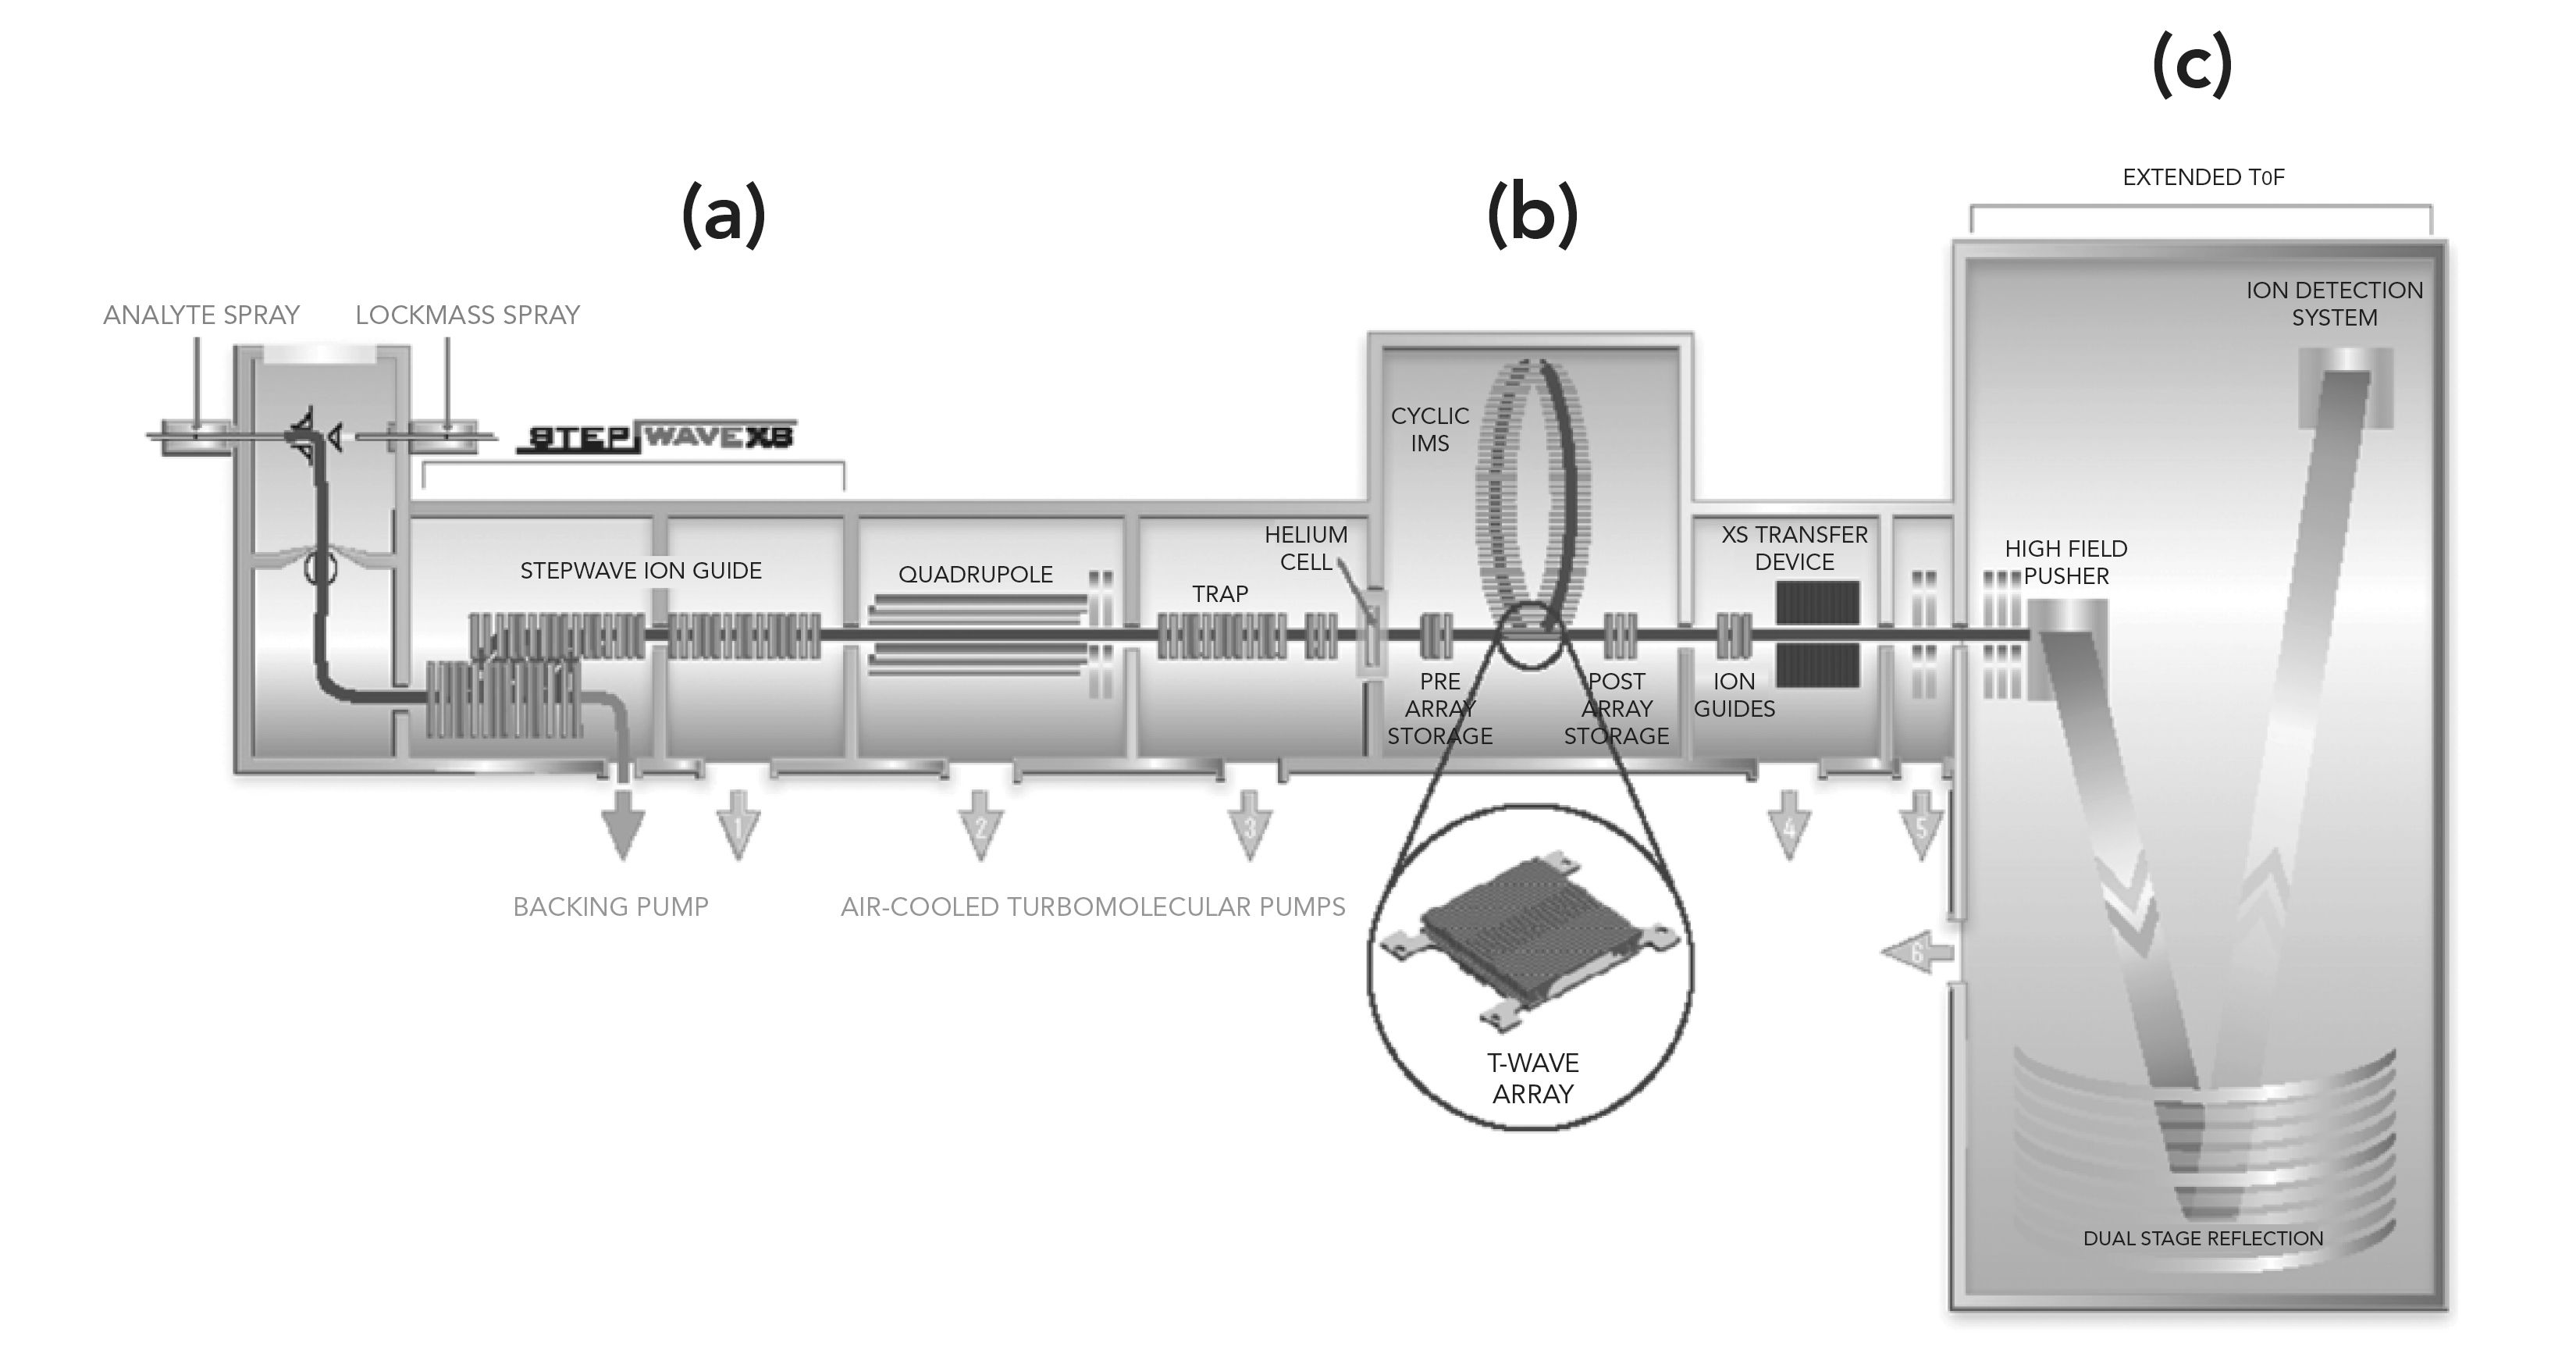
Clemmer’s work has been more academic than the work from Waters, though both groups have engineered extremely successful and useful advanced cIMS instrumentation and applications. In earlier work, Clemmer’s group designed an IMS instrument that included a cyclotron geometry drift tube. This was the first, cyclotron geometry drift tube, wherein a packet of ions was introduced into the cyclotron (not ICR-MS), and then transmitted through multiple cycles by oscillating the applied drift fields at an appropriate frequency. Species with different mobilities are pulled apart at different times. After a desired number of cycles, only those species with mobilities in resonance with the drift field application frequency are trapped. Subsequently, these ions are then released into a mass analysis region of the MS instrument and detected.
In all of this work, both the Clemmer group and at Waters, the goal has been to construct IMS instruments with higher resolving powers. This goal has been realized and continues to improve in both of the above R&D groups as well as in others (5–7).
Structures for Lossless Ion Manipulations (SLIM)
SLIM stands for structures for lossless ion manipulations, invented by R.D. Smith and colleagues (1,8,9). In SLIM, two printed circuit boards, with a mirrored electrode symmetry, can be placed both above and below one another. These circuit boards create the ion path of travel between the boards, and dynamic electric fields are used to contain and guide the ions through the entire SLIM device. SLIM allows for high ion transfer through elevated pressure regions. SLIM-based IMS instruments, based on both DTIMS and TWIMS, have already been demonstrated. The final product allows for numerous ion manipulation modules to be fabricated and even modules can move ions at a 90-degree angle. It is thus possible to have both cyclic racetrack and serpentine geometries fabricated for long pathlength, and with the use of “T” junctions, it is possible to select a discrete, ion mobility region for further tandem IM or MS analysis. Figure 4 illustrates a typical, SLIM-based IMS instrumental arrangement. Other designs have allowed the creation of instruments with some of the highest IM resolutions yet available (1, 8–10). The advantage of using SLIM or any of the other approaches to improve resolution in the IMS region before MS is simply the same as for any high resolution analytical technique. It is to resolve or separate each analyte from the next, with no overlap before introduction into the MS instrument. That then allows the MS instrument to provide the final MS data for a single species, always a desirable outcome. It is because the resolution within the IMS step has been improved that even low resolution MS units become more specific, more accurate, and more useful, which is what both cIMS and SLIM are all about. They just go about achieving higher resolution via different approaches. However, in cIMS, there is really no outer limit to the number of passes possible, there is limitless resolution capability that just requires more time but not more money.
FIGURE 4: (a) A schematic of the multipass, SLIM Super IM-MS instrument. (b) Photograph of one of the two SLIM surfaces that are stacked in mirrored symmetry in the instrumentation, (c) an illustration of an ion switch, which is used to direct through the various stages of the experiment (Reprinted with permission from American Chemical Society).
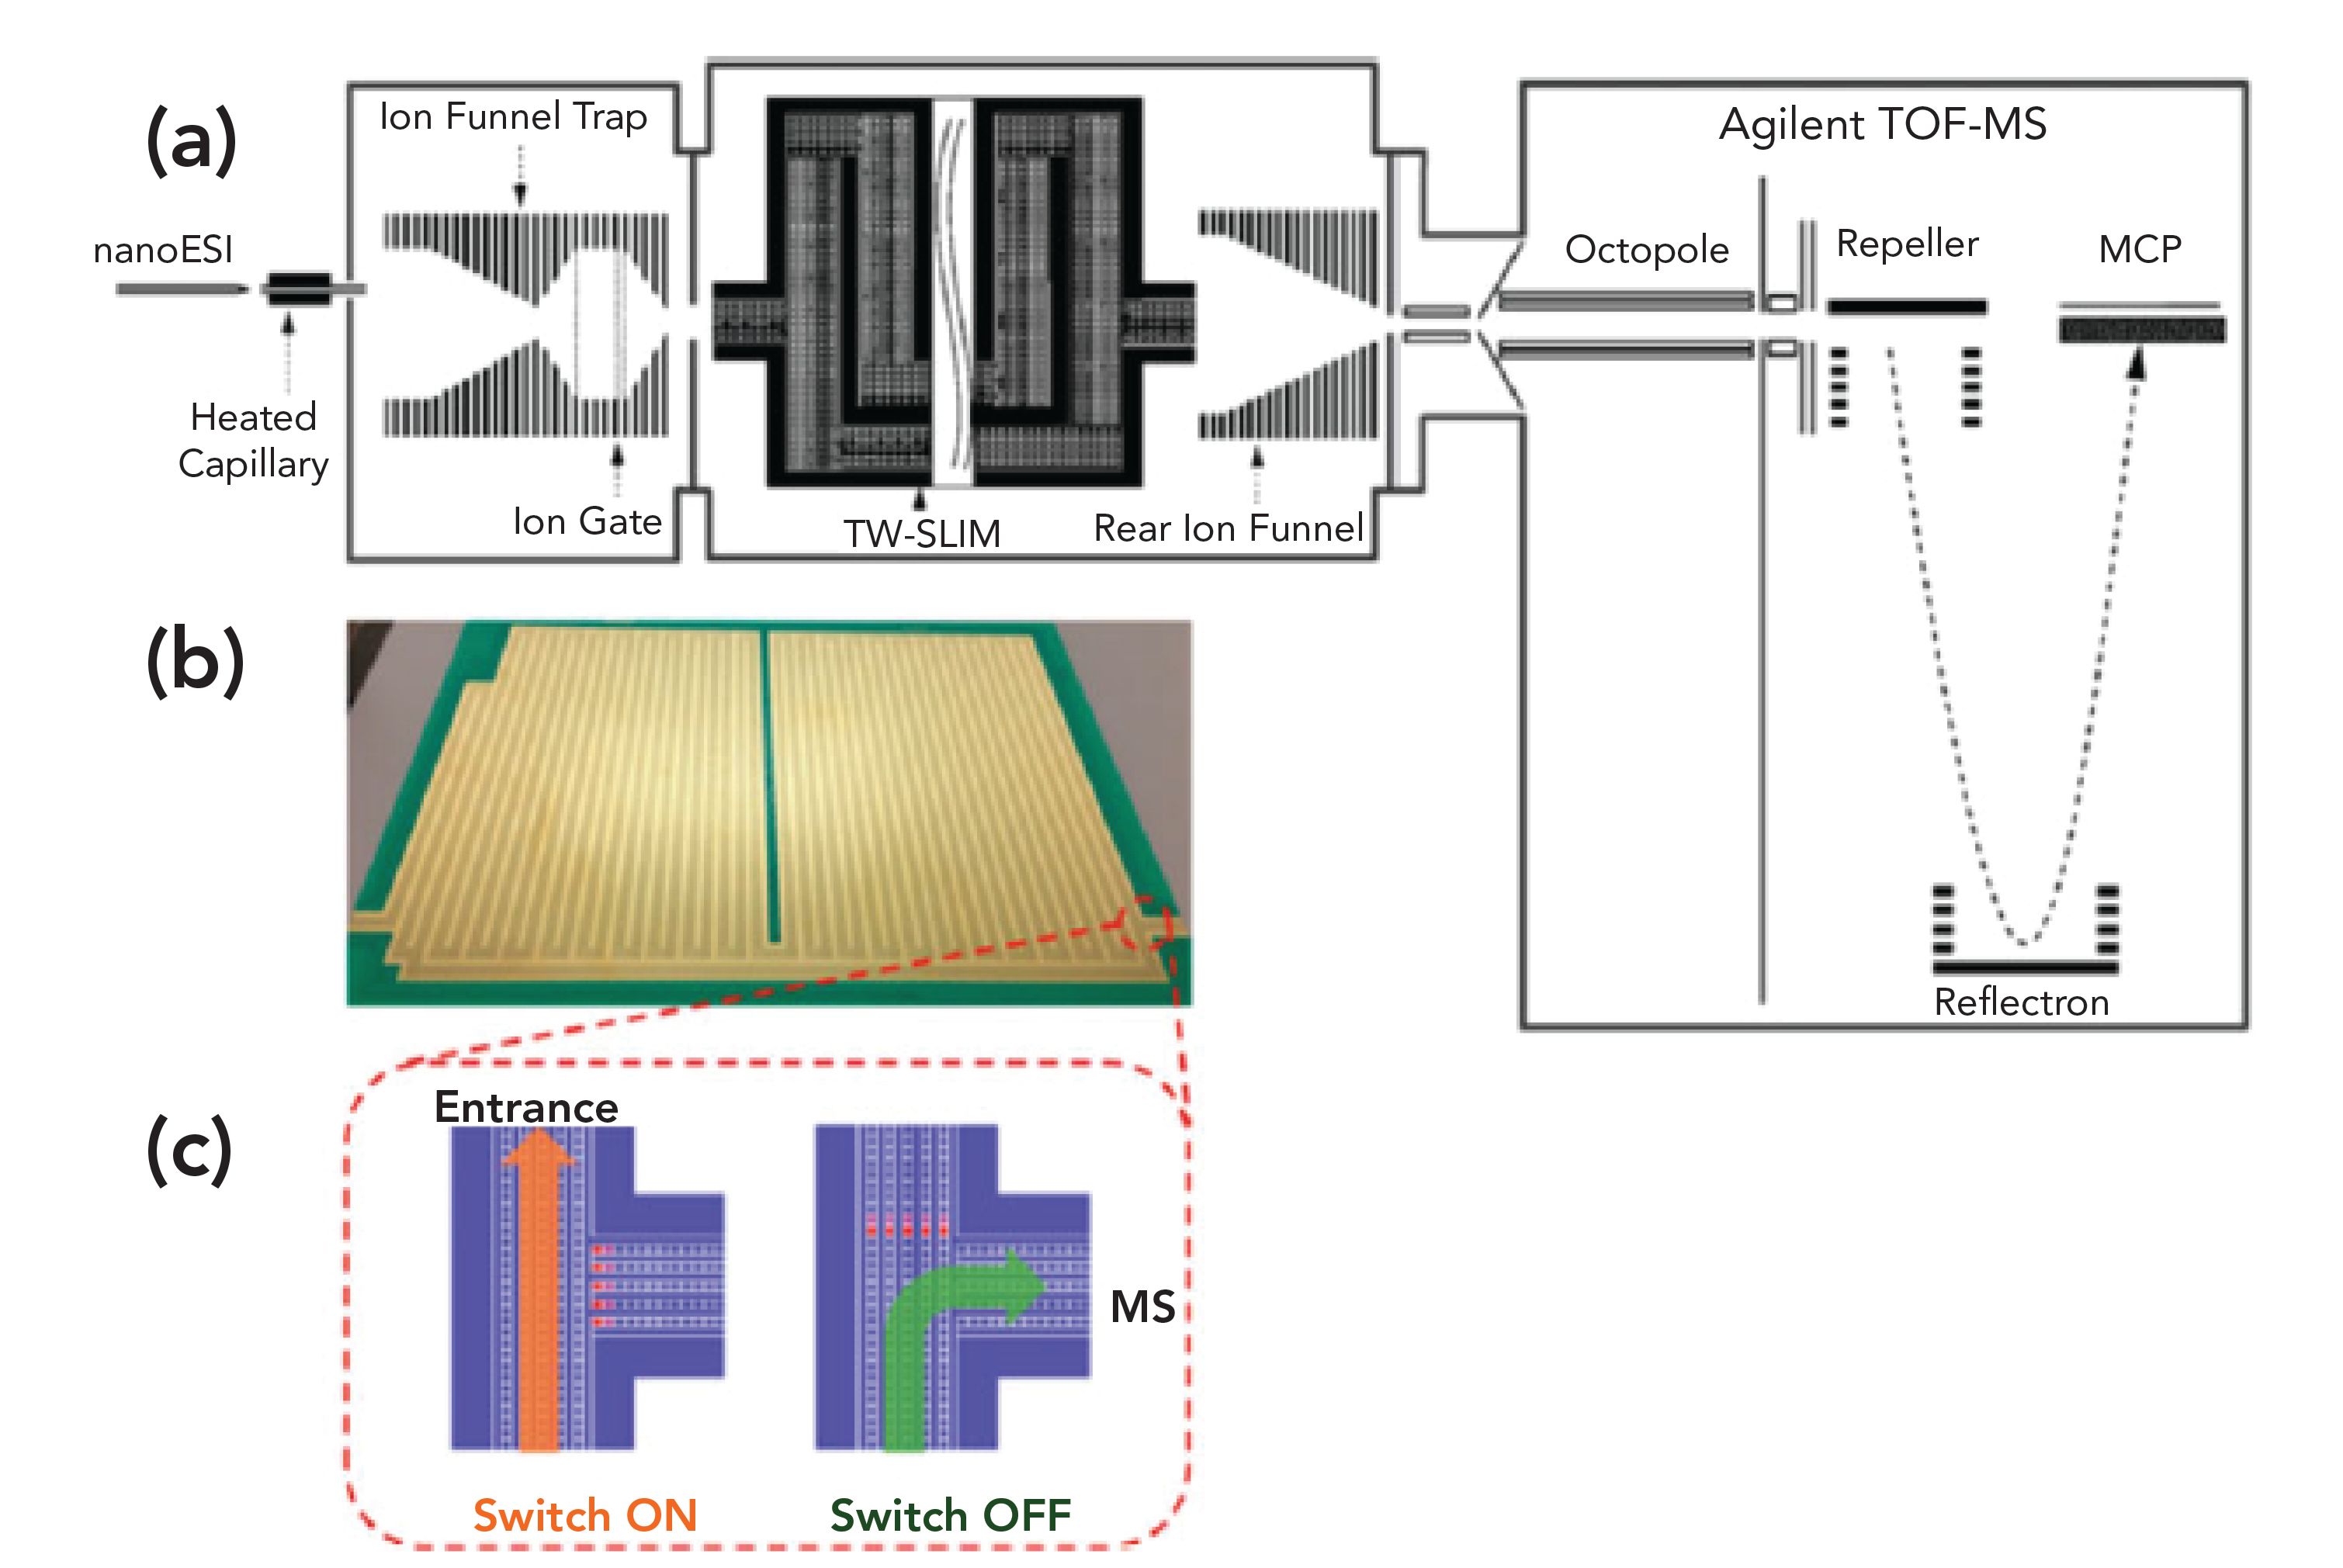
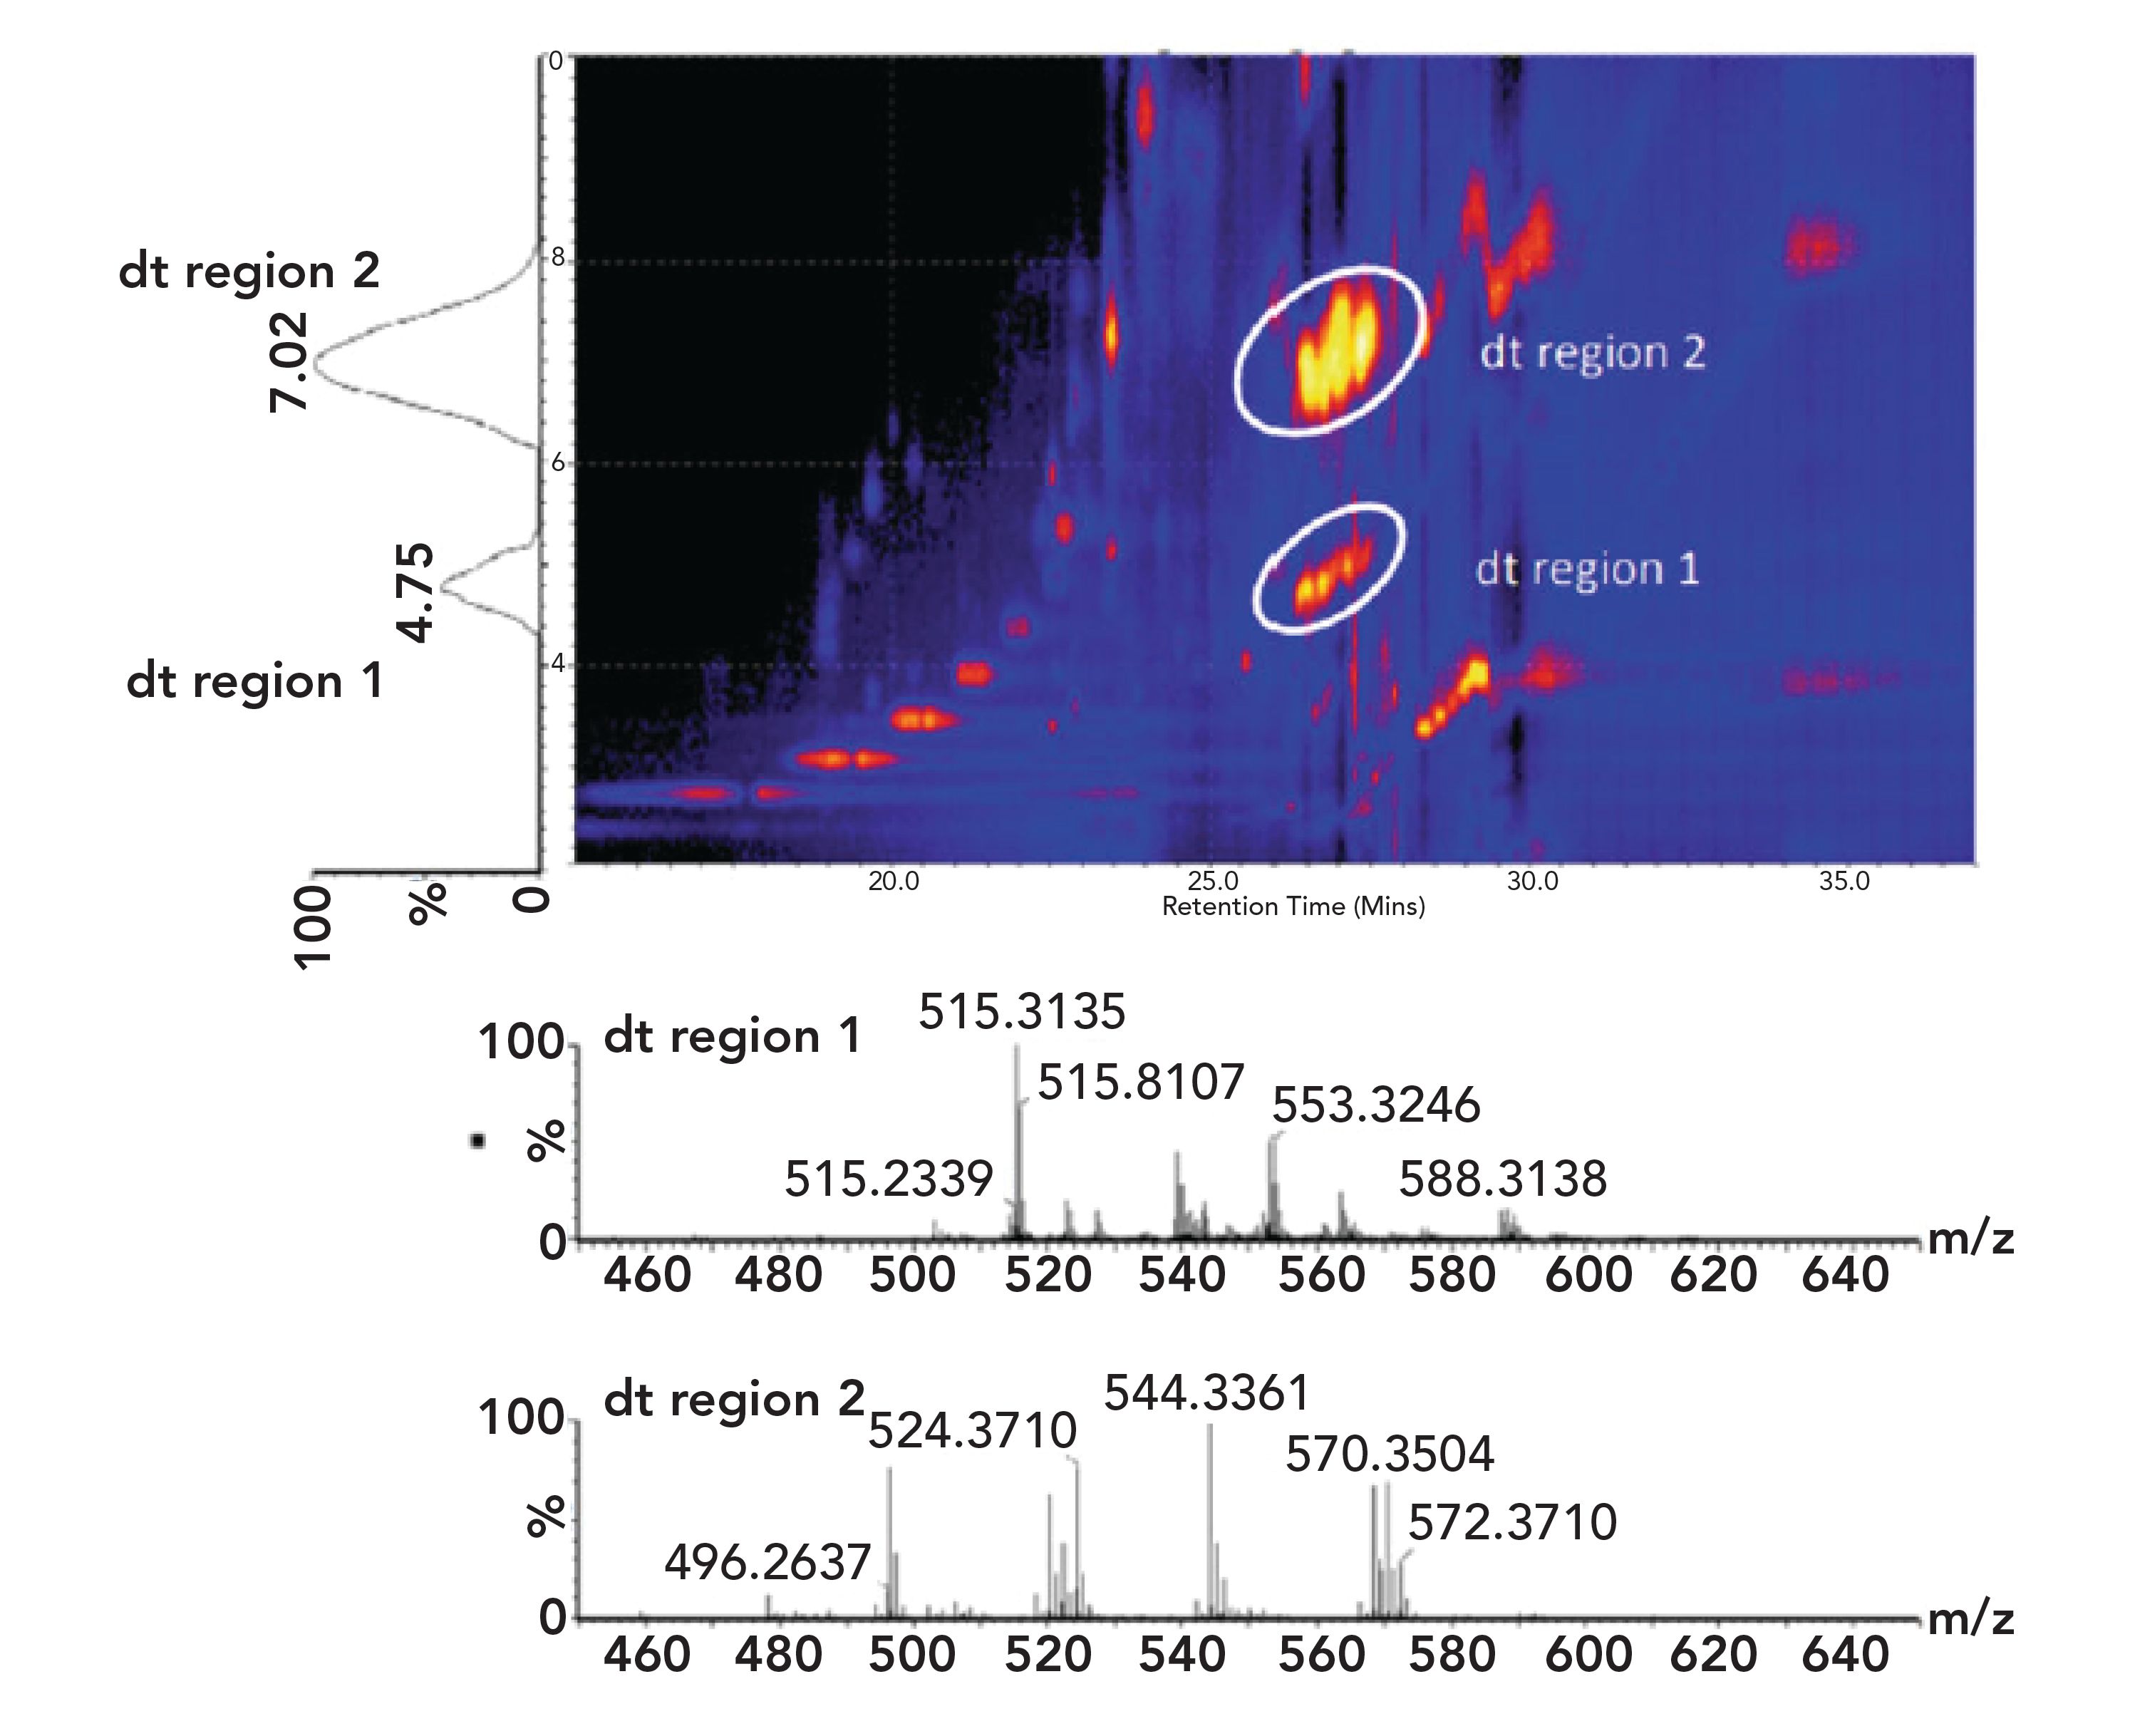
Figure 5 illustrates what information can be obtained by using any number of IMS approaches. The plot on the vertical axis represents the migration time of (at least) two resolved ions, in two distinct drift time regions. The times of their drift time regions are indicated. On the bottom are the two different and distinct MS spectra, electron impact, coming after the drift time region, in blue and red, with retention times of all ions and m/z (MW) as indicated. The blue middle region of Figure 5 illustrates retention times of the two ions but now also yellow and red spots of retention time compared to m/z ratios. The two peaks on the y-axis correspond to the most intense ions in the middle panel. What about the other red spots? Those represent other m/z ions from the same starting materials with lower or higher values left and right. The most intense ions are those most commonly formed, and the most important for m/z determinations of actual structures, as in the bottom-most panel. Those two panels represent the usual fragmentation patterns (and derived structures) from any electron impact MS instruments (11,12).
FIGURE 5: An example of 2D LC-IM spectrum (drift time vs retention time) showing IM separation of different compound classes observed in rat plasma. The encircled regions represent compound classes that elute at a similar retention time (26–28 min). Extracted IM spectra (bottom) reveal that these two regions of ion signal represent different lipid classes, namely lyso-PC and SM lipids (sphingosine phosphocholines). (Open access from S.I. Wickramasekara et al., Metabolites 3, 701–717, [2013]).
Does IMS Have a Role in Biopharmaceutical Regulatory Approvals?
We have already discussed IMS in general and more specifically, cIMS, FAIMS, SLIMS and other types of IMS. The question remains, what is the relevance of IMS in biopharmaceutical manufacturing and approval? This, indeed, is a great question.
Of the many critical quality attributes (CQAs) that are monitored in the approval of biopharmaceuticals, one is structural analysis. As we all learned in our introductory biochemistry courses, structure equals function. If the structure is not correct, then the function of the protein (mAb) is not what it should be. Thus, in the case of a drug, it would not work.
Structural analysis is currently performed of biopharmaceuticals, especially for regulatory filings by nuclear magnetic resonance (NMR), analytical ultracentrifugation (AUC), and X-ray crystallography (XRC). None of these techniques, though, is easy or robust.
Thus, based on the use of MS for intact mass analysis, pep- tide mapping and glycan analysis, we suggest that IMS serves as a powerful, improved alternative to the above-mentioned techniques. It can serve to monitor structural characteristics of biopharmaceuticals especially when considering biosimilars. The new methods in IMS, such as FAIMS, cIMS, SLIMs and others, can provide valuable insights into the structure of a protein drug by using instrumentation that already exists in analytical laboratories. It is also faster and cheaper than other methods such as NMR and X-ray crystallography. Thus, we would suggest that IMS is an alternative and viable approach to elucidate structural information about a biopharmaceutical. In part, by showing the structure and CCS, thus function, of a protein drug is intact. This knowledge gives confidence that the drug will be safe, efficacious, and with the correct structure, ensure quality.
Acknowledgements
For most installments of this column, we typically cite many original research papers and review papers, after having sewn together key information from these articles into a broad overview of the topic. That was not the case for this column, however. The reason is that although IMS has been around for several decades and has attracted a large number of excellent publications, fewer reviews have been published. The book cited as reference (1) by Paglia and Astarita is an excellent and comprehensive text on the topic, containing almost 310 pages and 19 chapters from many authors, and countless references. Therefore, the authors have drawn extensively on this text and used several figures from that text with permission. If this article has piqued your interest in further knowledge on this topic, we highly recommend that book.
Farewell from Columnist Ira S. Krull
I first started writing LCGC columns in the late 1990s. The first was “Validation Viewpoint” with Mike Swartz. Later, I began collaborating with Anurag Rathore on this column, initially called “Biotechnology Today” and recently renamed “Focus on Biopharmaceutical Analysis.”
However, all good things must come to an end. Though I only look about 40, in reality, I am already double that and counting, so it is time for me to retire from this column. I thank everyone involved: my co-columnist, Anurag Rathore, who will continue the column, as well as our editors, including Laura Bush, LCGC’s editorial director and John Chasse, LCGC’s managing editor. I also want to thank Meg L’Heureux, who was the previous managing editor, and is now the editor in chief of a sister magazine, Cannabis Science and Technology.
References
(1) G. Paglia and G. Astarita, Eds., Ion Mobility-Mass Spectrometry, Methods and Protocols, Methods in Molecular Biology (Springer Nature, New York, 2020).
(2) C.B. Morris, J.C. Poland, J.C. May, and J.A. McLean, in Fundamentals of Ion Mobility-Mass Spectrometry for the Analysis of Biomolecules (Springer Nature, New York, 2020), pp. 8.
(3) T. Kinderdine, R. Nemati, A. Baker, M. Palmer, J. Ujma, M. Fitzgibbon, L. Deng, M. Royzen, J. Landgridge, and D. Fabris, J. Mass Spectrom. 55(2), 44–65 (2019) https://doi.org/10.1002/jms.4465.
(4) Roy Martin, PhD, personal communications, 2020.
(5) C. Eldrid, J. Ujma, S. Kalfas, N. Tomczyk, K. Giles, M. Morris, and K. Thalassinos, Anal. Chem. 92, 7554–7561 (2019).
(6) K. Giles, J. Ujma, J. Wildgoose, S. Pringle, K. Richardson, D. Landgridge, and M. Green, Anal. Chem. 91, 8564–8573 (2019).
(7) S.I. Merenbloom, R.S. Glaskin, Z.B. Henson, and D.E. Clemmer, Anal. Chem. 81, 1482–1487 (2009).
(8) L.L. Deng, I.K. Webb, S.V.B. Garimella, A.M. Hamid, X.Y. Zheng, R.V. Norheim, S.A. Prost, G.A. Anderson, J.A. Sandoval, E.S. Baker, Y.M. Ibrahim, and R.D. Smith, Anal. Chem. 89(8), 4628– 4634 (2017).
(9) C.B. Morris, J.C. Poland, J.C. May, and J.A. McLean, in Fundamentals of Ion Mobility-Mass Spectrometry for the Analysis of Biomolecules (Springer Nature, New York, 2020), pp. 17–18.
(10) G. Nagy, I.K. Attah, C.R. Conant, W. Liu, S.V.B. Garimella, H.P. Gunawardena, J.B. Shaw, R.D. Smith, and Y.M. Ibrahim, Anal. Chem. 92, 5004–5012 (2020).
(11) C.B. Morris, J.C. Poland, J.C. May, and J.A. McLean, in Fundamentals of Ion Mobility-Mass Spectrometry for the Analysis of Biomolecules (Springer Nature, New York, 2020), pp. 16.
(12) S.I. Wickramasekara, F. Zandkarimi, J. Morre, J. Kirkwood, L. Legette, Y. Jiang, A.F. Gombart, J.F. Stevens, and C.S. Maier, Metabolites 3(3), 701–707 (2013).

Ira S. Krull is a Professor Emeritus with the Department of Chemistry and Chemical Biology at Northeastern University in Boston, Massachusetts, and a member of LCGC’s editorial advisory board.

Jared Auclair is an Associate Teaching Professor in the Department of Chemistry and Chemical Biology at Northeastern University in Boston, Massachusetts. He is also the Director of Biotechnology and Informatics, as well as the Director of the Biopharmaceutical Analysis Training Laboratory.

Anurag S. Rathore is a professor in the Department of Chemical Engineering at the Indian Institute of Technology in Delhi, India. Direct correspondence to: LCGCedit@mmhgroup.com

Polysorbate Quantification and Degradation Analysis via LC and Charged Aerosol Detection
April 9th 2025Scientists from ThermoFisher Scientific published a review article in the Journal of Chromatography A that provided an overview of HPLC analysis using charged aerosol detection can help with polysorbate quantification.
Removing Double-Stranded RNA Impurities Using Chromatography
April 8th 2025Researchers from Agency for Science, Technology and Research in Singapore recently published a review article exploring how chromatography can be used to remove double-stranded RNA impurities during mRNA therapeutics production.


