Effects of Sample Diluents and Sample Matrices on Residual Solvents in Pharmaceuticals Analyzed with Static Headspace Gas Chromatography
In static headspace gas chromatography (HS-GC) sample diluents and sample matrices can affect analytical method sensitivity, accuracy, and interferences. By applying the rules revealed by this study, these problems can be avoided.
The effects of sample diluents, including Dimethyl sulfoxide (DMS), N,N-dimethylacetamide (DMA), and N,N-dimethylformamide (DMF), and the effects of sample matrices of a drug substance on 16 residual analyte solvents were studied using static headspace gas chromatography (HS-GC). The results showed that analyte solvents with polarities higher than those diluents had higher peak responses in DMA or DMF than they had in DMS, and vice versa. From DMS to DMA, diluent effects were approximately linearly proportional to the values of solvent polarity relative to DMS. The tendencies and magnitudes of diluent effects were mainly dependent on the polarities of analyte solvents and diluents. As sample amounts increased, analyte solvents exhibited various positive or negative matrix effects. The tendencies and magnitudes of matrix effects were mainly dependent on the polarities of analyte solvents, diluents, and samples and were further affected by sample solvation processes. Applying the rules of effects of sample diluents and sample matrices can improve method sensitivity and accuracy and avoid interferences as well.
Static headspace gas chromatography (HS-GC) has been widely used for analysis of residual solvents in pharmaceuticals (1–3). In closed headspace vials, the sample mixture is composed of sample diluents (also called sample solvents), samples, and analyte solvents that are to be tested. The analyte solvents are dissolved in the sample mixtures (the liquid phase) before partitioning into the gas phase. The peak response of a solvent is directly proportional to its gas phase concentration, which is dependent on its initial concentration in the liquid phase, and eventually dependent on its concentration in the sample. Many factors can affect the partitioning processes of solvents (4,5). Adjusting diluents by adding water to organic solutions to increase peak responses for nonpolar solvents and by adding inorganic salts to aqueous solutions to increase peak responses for polar solvents have been reported (4–7). The effects of several diluents on peak responses of some residual solvents also have been reported (8).
Sample matrices also have impacts on solvent peak responses. The effects of sample matrices on some residual solvents have been studied (9). The counts of hydrogen (H) bond acceptors and donors in compounds have been used to explain the causes of matrix effects. However, the principles of diluent effects and matrix effects on residual solvents analyzed with HS-GC are still not clear.
In this study, effects caused by sample diluents and sample matrices are analyzed. From the perspective of polarities, interactions between diluents, analyte solvents, samples, and sample solvation processes were analyzed to reveal the rules governing diluent effects and matrix effects. The use of the acquired understanding of diluent effects is then illustrated in a troubleshooting example.
Experimental
Materials and Methods
All of the chemicals and reagents used were common inventories. A GC 7890 series instrument with a 7697A headspace autosamplers and a flame ionization detector (FID) was used, along with a capillary column DB-624 with a 3.0 μm film thickness, 75 m x 0.53 mm (Agilent Technologies) were employed for analysis. Data acquisition and analysis were performed by Empower software (Waters).
Chromatographic Parameters
The parameters for the headspace autosampler were as follows: The temperature for the oven was kept at 80 °C, the loop at 170 °C, and the transfer line at 175 °C. The times for the GC cycle, vial equilibration, pressure equilibration, and injection were 45, 30, 0.10, and 0.5 min, respectively. The vial fill mode was “fill to pressure” with the fill pressure at 10 psi. The loop fill mode was “default”; shake level was at “7.” The loop size was 1.0 mL, and a 20 mL headspace vial was used.
For the GC parameters, the carrier gas was helium, and the constant flow mode had a flow rate 5.0 mL/ min. The inlet was a volatile interface inlet with a split ratio of two and the temperature was set at 180 °C. For the GC oven program, the initial temperature was set at 40 °C and held for 20 min before being increased to 140 °C at a rate of 10 °C/min, and held for 1 min. It was later further increased at a rate of 30 °C/min to 230 °C and held for 6 min. The FID temperature was set at 250 °C, with the hydrogen flow at 40 mL/min, the air flow at 400 mL/min, and the make-up gas (helium) at 25 mL/min.
Standard Solution Preparation
Standard solutions containing 16 analyte solvents with concentrations of ~120 μg/mL each of methanol, ethanol, acetone, 1-propanol, isopropyl alcohol (IPA), t-butanol, acetonitrile, dichloromethane (DCM), ethyl acetate, and benzene, ~40 μg/mL each of tetrahydrofuran (THF), cyclohexene, and toluene, and ~10 μg/mL each of ethyl ether, cyclohexane, and n-hexane were prepared in dimethyl sulfoxide (DMS), N,N-dimethylacetamide (DMA), or N,N-dimethylformamide (DMF), separately.
Headspace (HS) Vial Preparation
Next, 2.0 mL of the diluent, standard solutions, or samples plus 2.0 mL of the diluent or spiking standard solutions were put into a 20-mL size HS vial and sealed for use. For the purpose of this experiment, one injection per vial was made.
Results and Discussion
Effects of Different Sample Diluents on Common Residual Solvents
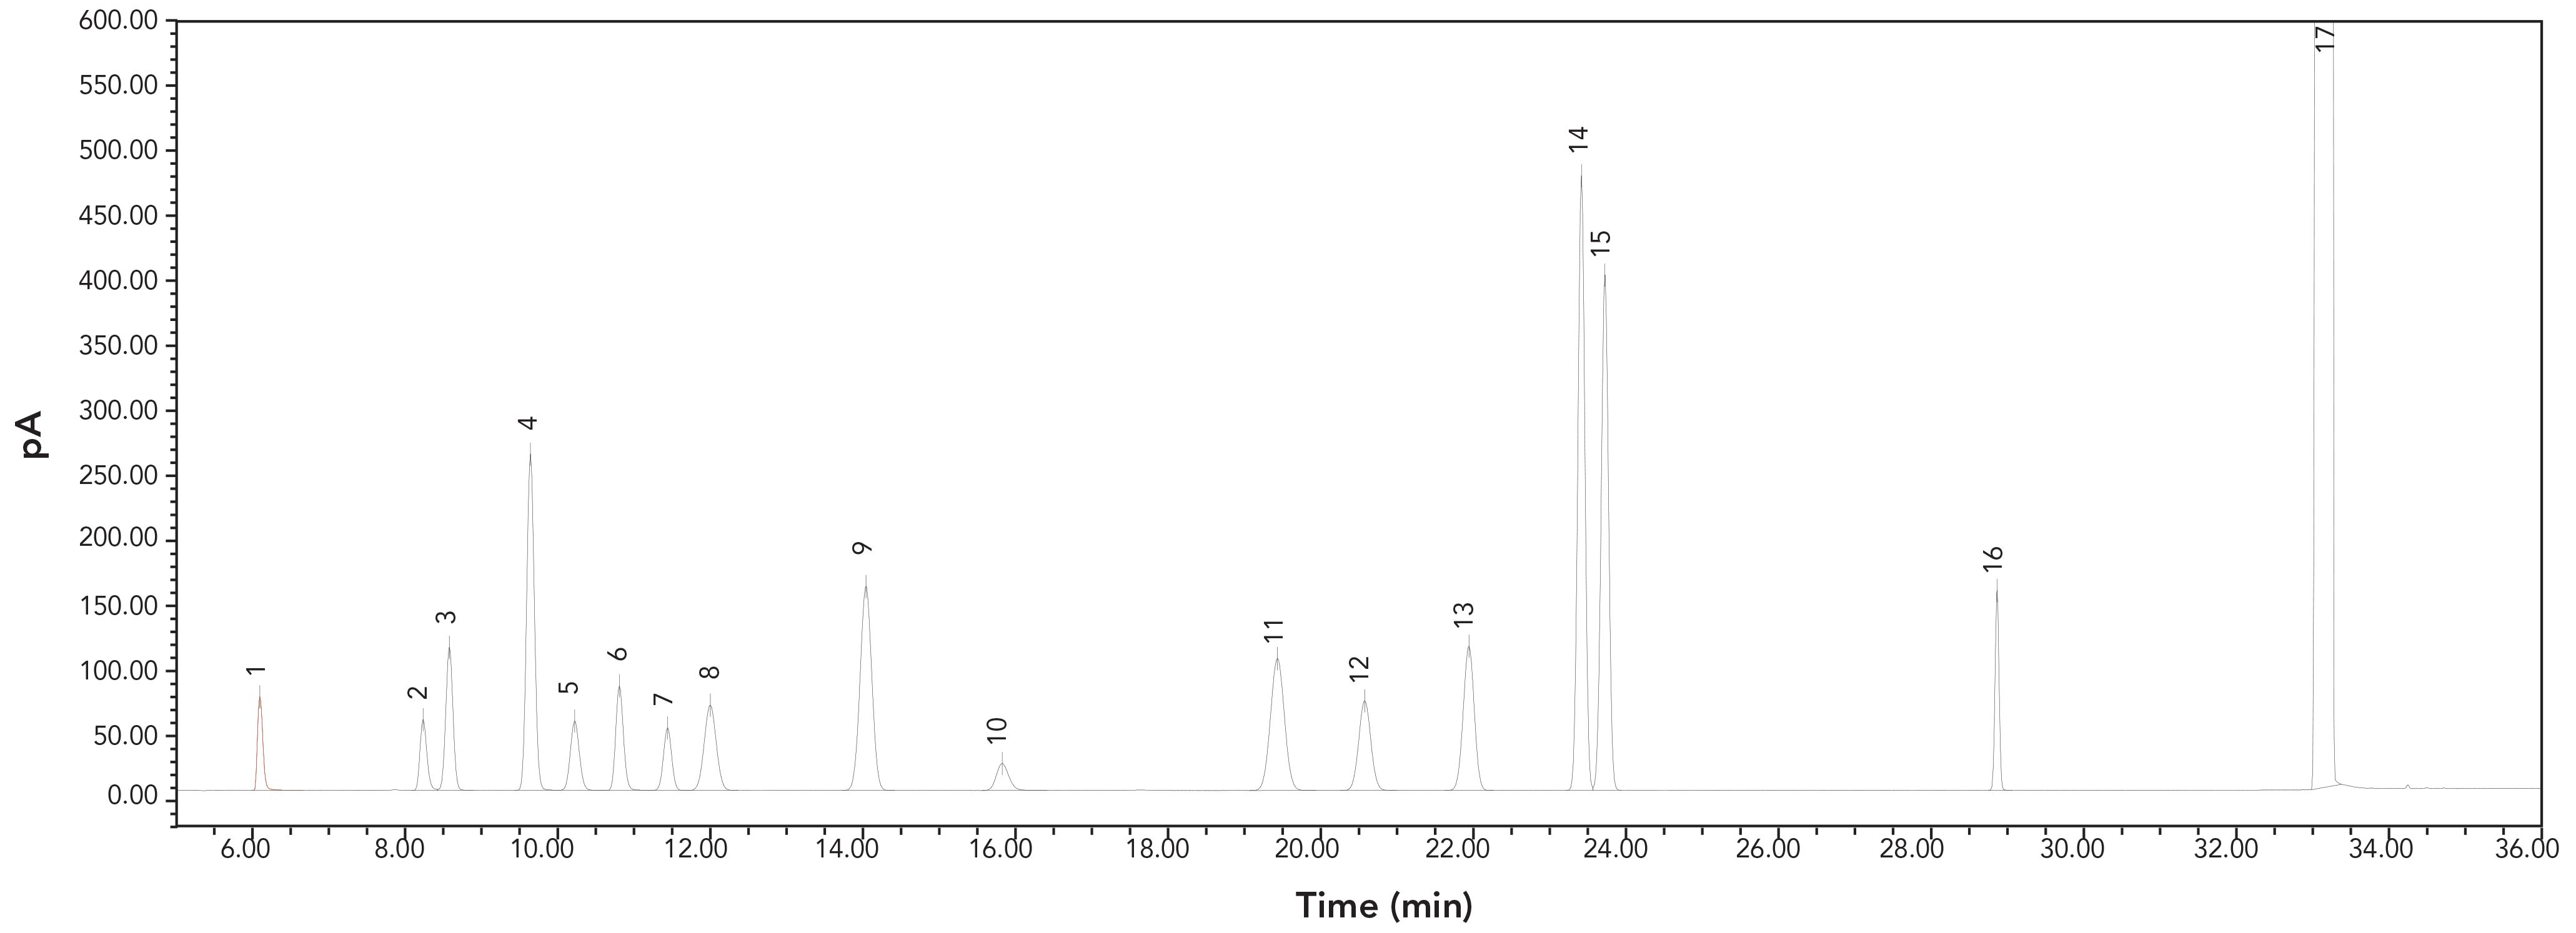
Standard solutions prepared in DMS, DMA, or DMF were injected. Figure 1 illustrates the representative GC chromatogram of 16 analyte solvents in DMS. Figure 1 shows that the peaks of all analyte solvents were well resolved. There were no significant interferences for any solvent, including the diluents. The peak retention times of the same analyte solvent in different diluents of DMS, DMA, or DMF were technically identical.
FIGURE 1: GC chromatograms of analyte residual solvents from the standard solution. Peaks were: 1: methanol; 2: ethanol; 3: ethyl ether; 4: acetone; 5: isopropanol; 6: acetonitrile; 7: dichloromethane; 8: t-butanol; 9: n-hexane; 10: 1-propanol; 11: ethyl acetate; 12: tetrahydrofuran; 13: cyclohexane; 14: benzene; 15: cyclohexene; 16: toluene; 17: dimethyl sulfoxide.
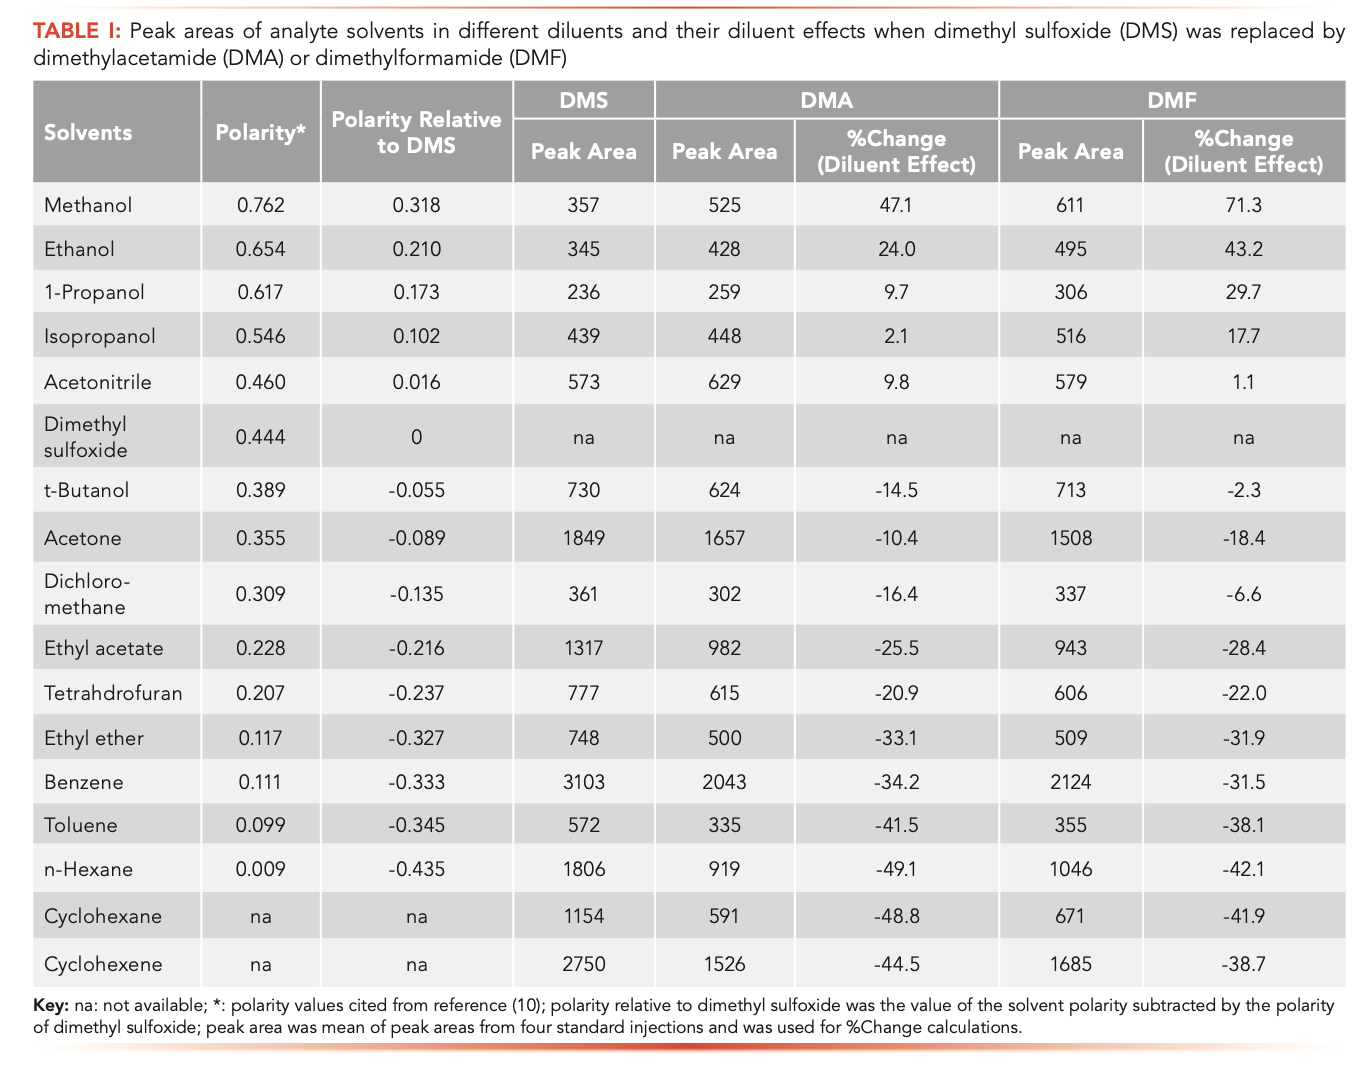
Peak responses of analyte solvents in different diluents of DMS, DMA, or DMF were tabulated and appear in Table I. Compared to peak responses of solvents in DMS, it was found that some solvents had higher peak responses and others had smaller peak responses in DMA or DMF. These up or down changes on peak responses of analyte solvents caused by different diluents were diluent effects.
There are two aspects of the characteristics of diluent effects: the direction (up or down) of the change and the magnitude of the change. The term, ±%Change, in peak response was introduced to describe these properties when the diluent was changed. It was calculated by the equation below:

The calculated diluent effects (±%change in peak responses) on all analyte solvents after DMS was replaced by DMA or DMF are listed in Table I. It was shown that the direction of change (positive or negative) and the magnitude of diluent effects varied from solvent to solvent. For example, methanol saw a 47.1% increased peak area, and n-hexane obtained a 49.1% decreased peak area in DMA than in DMS. By relating diluent effects to polarities, it was found that after DMS was replaced by DMA, methanol, ethanol, 1-propanol, IPA, and acetonitrile had higher polarity values and had positive diluent effects. On the other hand, t-butanol, acetone, ethyl acetate, dichloromethane, ethyl ether, benzene, toluene, cyclohexane, cyclohexene, tetrahydrofuran, and n-hexane had smaller polarity values and had negative diluent effects. When DMS was replaced by DMF, the diluent effects were similar to those seen with DMA, for all analyte solvents.
In chemistry, it is common knowledge that polar attracts polar and nonpolar attracts nonpolar. When two solvents are mixed, they will attract each other more strongly when their polarities are closer. DMS, DMA, and DMF have intermediate polarity values, with DMS being greater than DMA and DMF (10). Applying this knowledge to static headspace analysis, it can be inferred that solvents with polarity values higher than that of DMS will be more strongly trapped in the liquid phase of DMS than that of DMA. Consequently, such solvents will produce a lower concentration in the gas phase and smaller peak responses in DMS than in DMA. In contrast, solvents with polarity values lower than that of DMS will be less strongly trapped in the liquid phase of DMS than that of DMA. Thus, such solvents will yield higher concentrations in the gas phase and larger peak responses in DMS than in DMA. The results shown in Table I match the above hypothesis correctly. Therefore, it was concluded that diluent effects were highly dependent on the polarities of analyte solvents and diluents.
To describe the relationships of polarities to diluent effects, the concept of solvent polarity relative to diluents was introduced. This value is the difference in polarity between a solvent and a diluent, calculated by subtracting the solvent polarity by the diluent polarity. The values of solvent polarity relative to DMS for analyte solvents are listed in Table I as well. For the values of solvent polarity relative to DMS, solvents possessing positive numbers had positive diluent effects. Coincidently, solvents possessing negative numbers had negative diluent effects. Furthermore, solvents with larger absolute values of positive numbers, such as methanol, had larger magnitudes of positive diluent effects. Solvents with larger absolute values of negative numbers, such as n-hexane, had larger magnitudes of negative diluent effects when DMS was replaced by DMA, and vice versa.
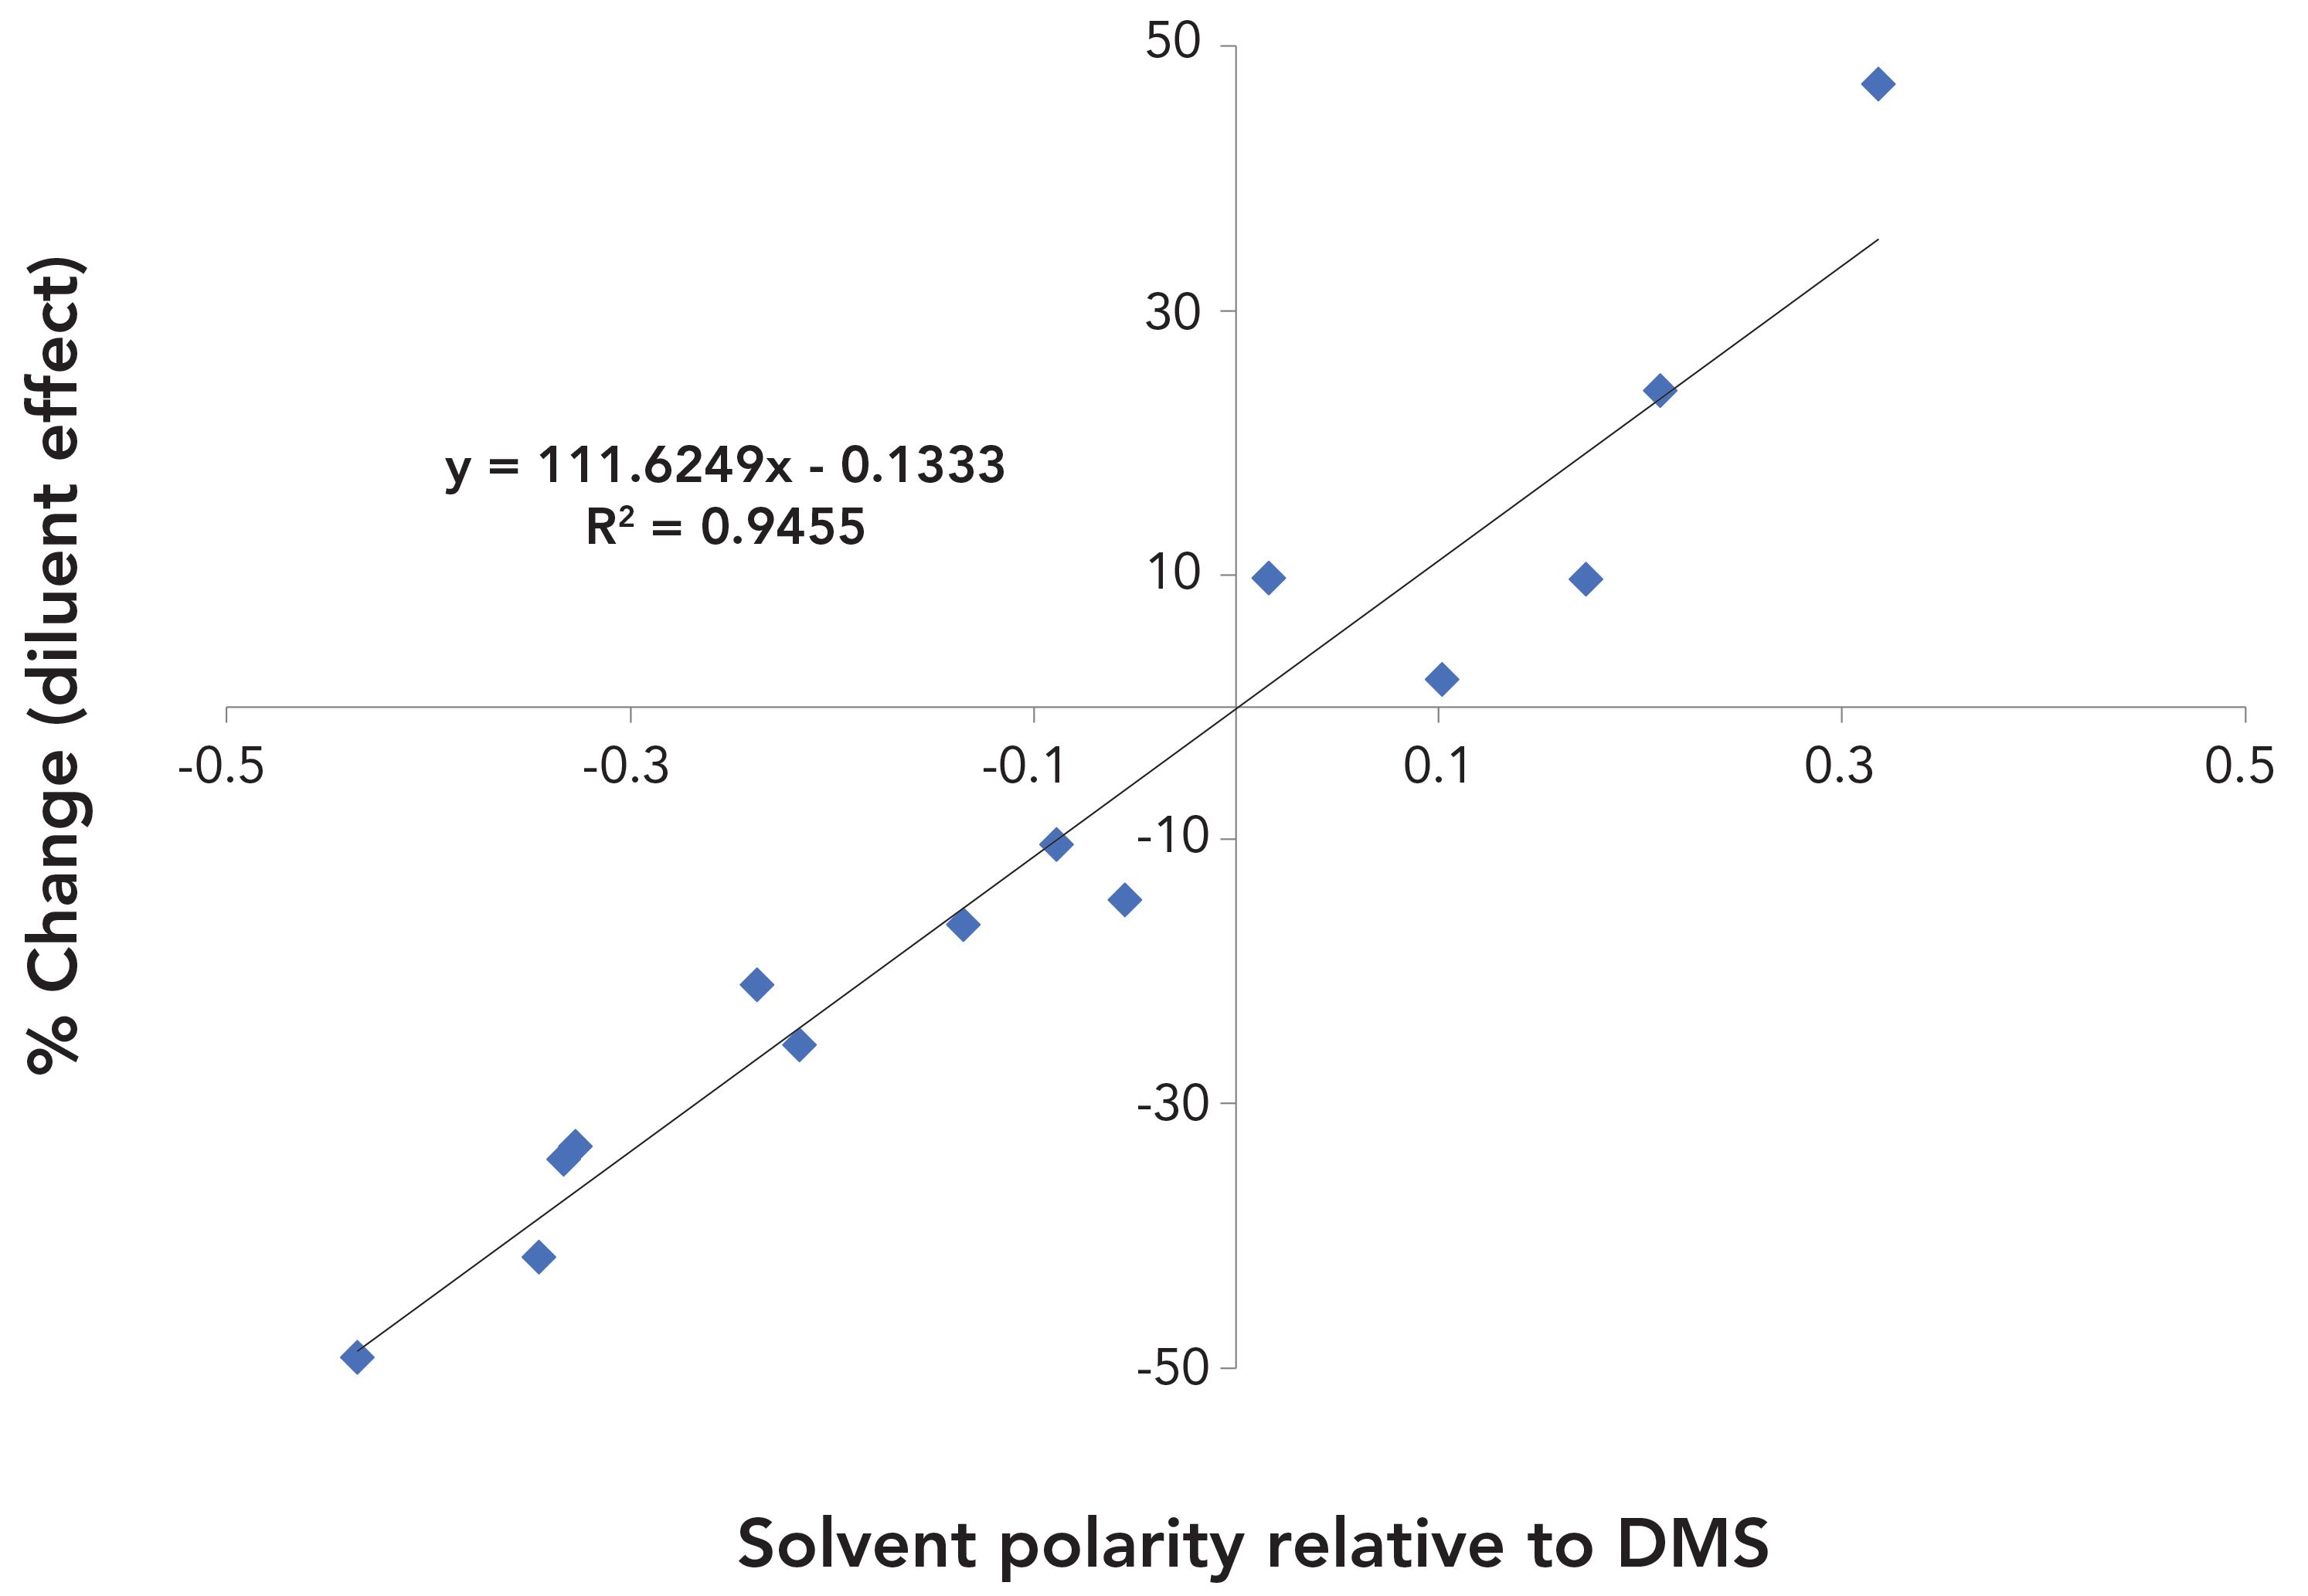
Figure 2 shows the correlation between %change and the values of solvent polarity relative to the polarity of DMS for 14 analyte solvents. It was found that there was an approximately linear correlation between them. This relationship provides a simple approach for using the polarities of solvents and diluents to predict the approximate diluent effects when DMS is replaced by DMA.
FIGURE 2: Relationships of diluent effects to solvent polarity relative to dimethyl sulfoxide when the diluent was changed from dimethyl sulfoxide to dimethylacetamide.
Based on the above analysis, it can be inferred that adding less-polar additives (modifiers) to existing diluents, such as adding DMA to DMS, will reduce the overall polarity of diluents, and then will increase the volatility of polar solvents and decrease the volatility of nonpolar solvents. Conversely, adding more polar additives, such as adding water to DMS, will increase the overall polarity of diluents, and then will reduce the volatility of polar solvents and increase the volatility of nonpolar solvents. Correspondingly, based on the polarities of diluents and analyte solvents and using the rules of diluent effects, enhanced peak responses of residual solvents can be achieved by properly choosing or adjusting diluents to improve method performance, such as method sensitivity.
Matrix Effects on Residual Solvents
Sample matrix effects are defined as the change in peak responses of analyte solvents in given diluents before and after adding samples. A standard solution and samples spiked with the same standard solution are usually used to study matrix effects. A standard solution of 16 residual solvents prepared in DMS and an organic drug substance (with 11 H-bond acceptors and 4 donors) were used in this study. Triplicates of spiked samples with sample amounts of 100, 200, 400, 600, and 800 mg were prepared and consecutively injected.
Similar to diluent effects, the %change in peak response was used to indicate characteristic properties of matrix effects (the positive or negative change and the magnitude of change) on solvents. It was calculated by the equation below:

The matrix effects on all tested solvents with different sample amounts are summarized in Table II. As with diluent effects, matrix effects also varied from solvent to solvent. For example, methanol yielded 12.5% and 27.1% matrix effects, and n-hexane yielded -6.8% and -8.9% matrix effects with sample amounts of 100 mg and 800 mg, respectively.
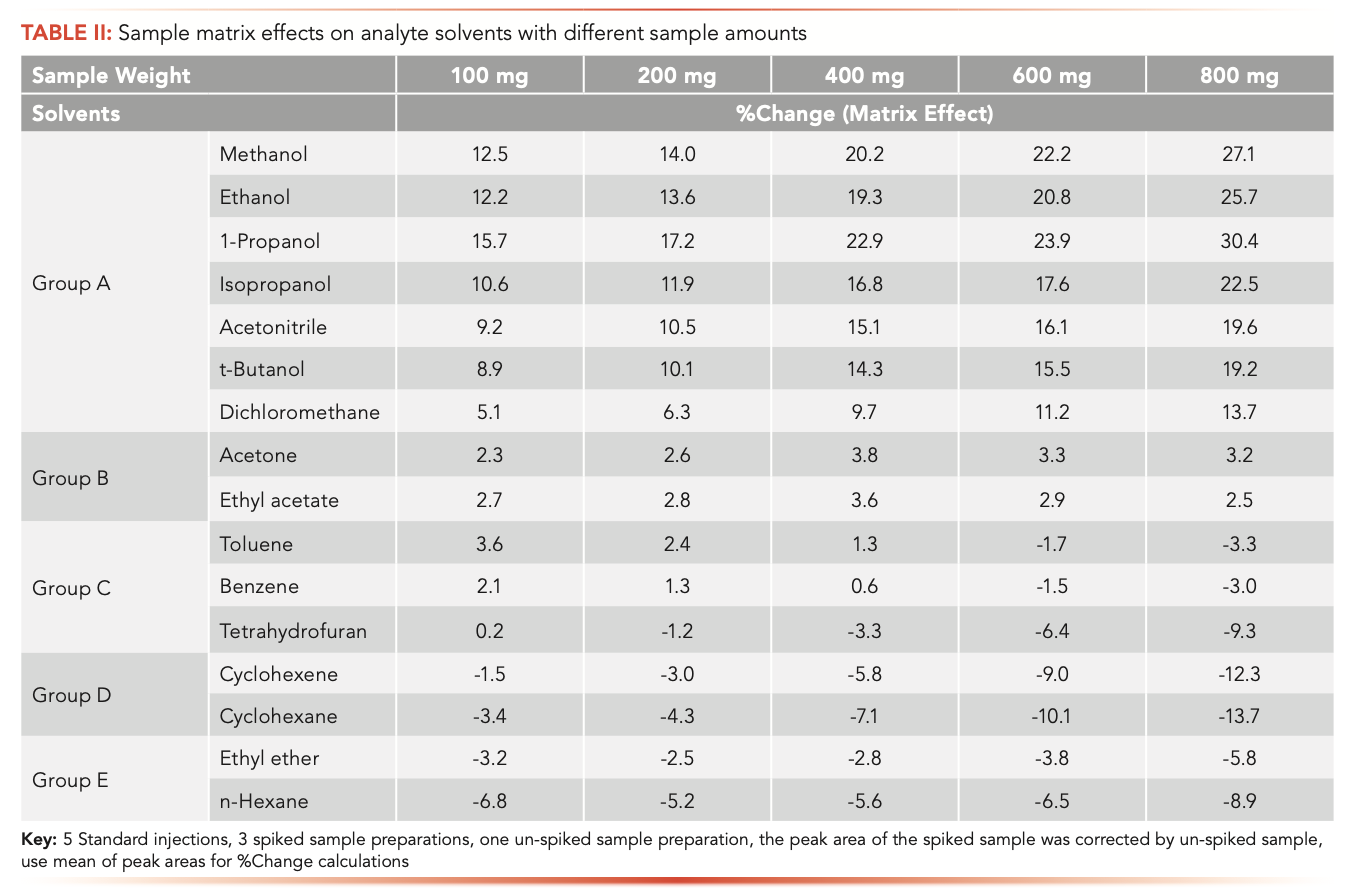
Based on the characteristics of matrix effects, 5 different types of matrix effects were classified, and all tested solvents were sorted into different groups. As sample amounts increased, group A solvents (methanol, ethanol, 1-propanol, IPA, acetonitrile, t-butanol, and dichloromethane) had significant positive effects with increasing trends, group B solvents (acetone and ethyl acetate) had slightly positive effects with no trends, group C solvents (toluene, benzene, and THF) had slightly positive effects at lower sample amounts and gradually turned to negative effects at higher sample amounts with decreasing trends, group D solvents (cyclohexene and cyclohexane) had negative effects with decreasing trends, and group E solvents (ethyl ether and n-hexane) had negative effects with no trends. These changing trends of matrix effects along with sample amounts were statistically confirmed by p-values with a threshold of 0.05. To clarify the trends and characteristics of different types of matrix effects, using one solvent from each group, %change versus sample concentrations is graphically illustrated in Figure 3.
FIGURE 3: Sample matrix effects versus sample concentrations for 5 types of matrix effects on solvents (one solvent from each group was used to illustrate the positive or negative changes, magnitudes, and trends of matrix effects as sample amount was increased).
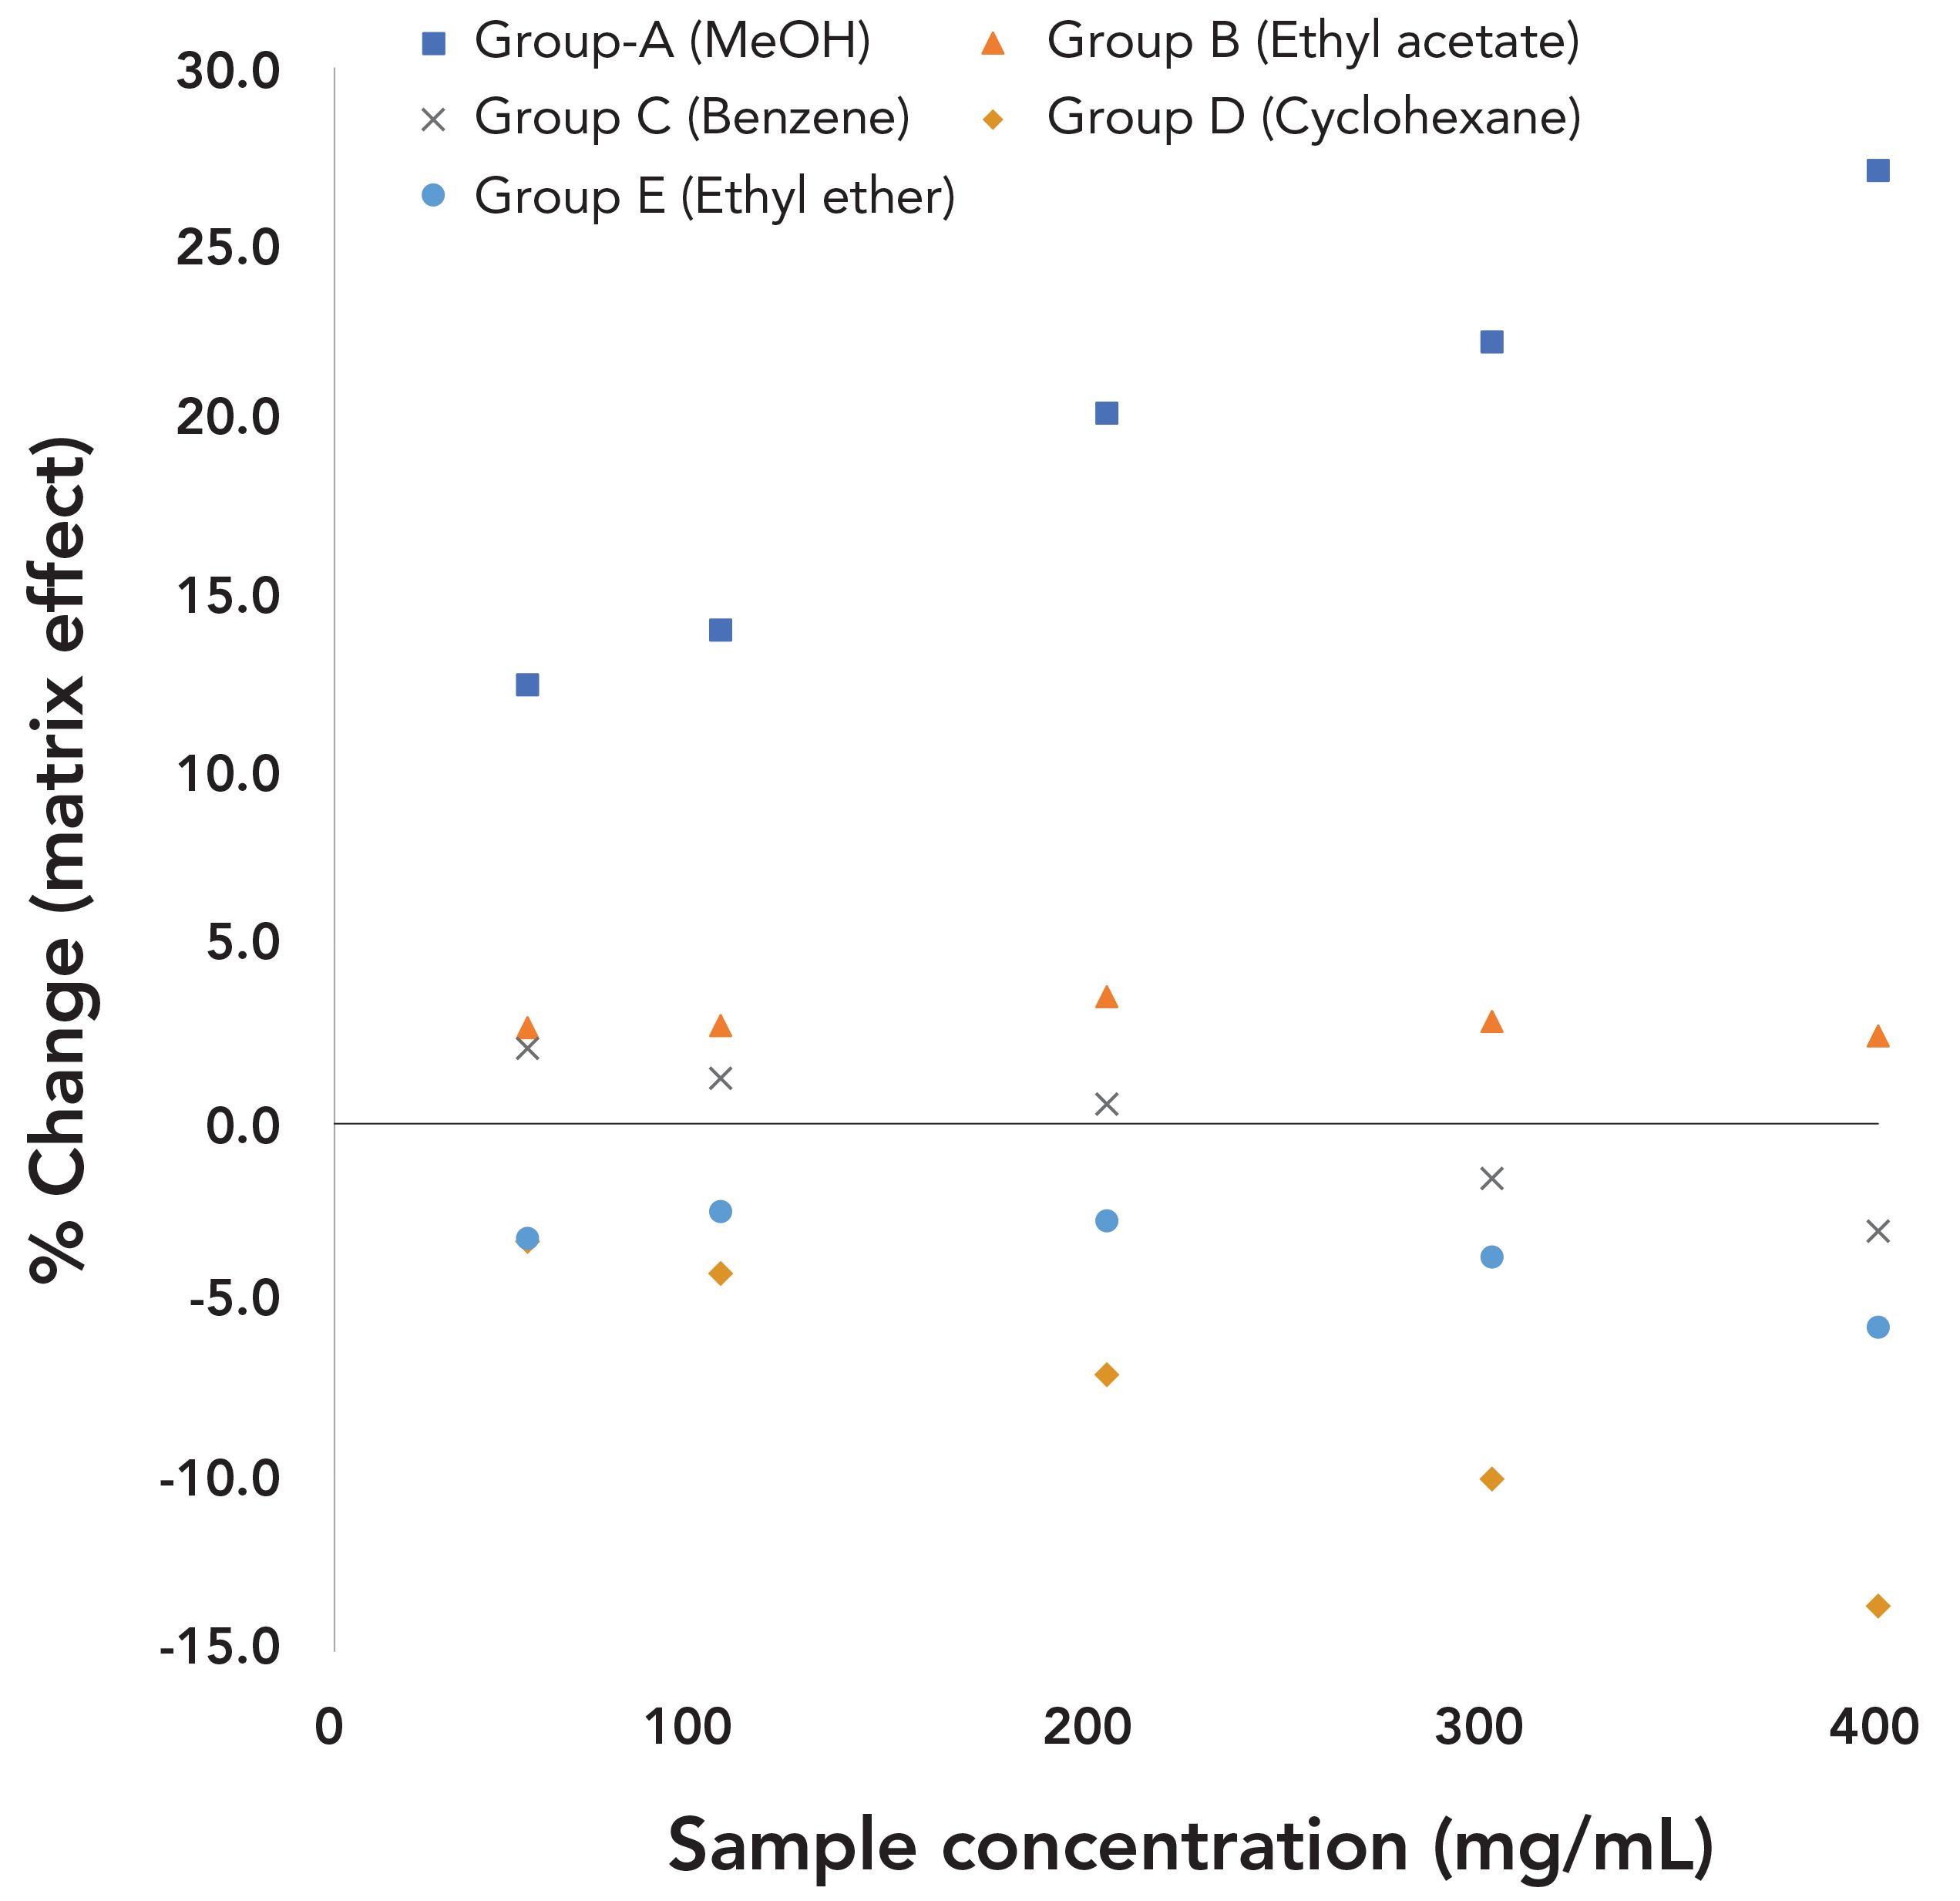
Just as with diluent effects, the organic sample worked as the polarity-modifying additives; it modified the overall polarities of sample mixtures. After adding samples, group A and B solvents with polarity values from 0.228 to 0.762 gained positive matrix effects, indicating that their volatilities increased. Meanwhile, group D and E solvents, which were nonpolar or close to nonpolar, yielded negative matrix effects, indicating that their volatilities decreased. All these results confirmed that the overall polarity of sample mixtures was reduced by samples. Thus, polarity continued to play an important role in molecular interactions between diluents, analyte solvents, and samples to produce matrix effects.
Group C solvents were at the transitional points of matrix effects changing from positive (groups A and B) to negative (groups D and E). Group C solvents had decreasing trends and negative effects at high sample amounts; they were similar to group D and E solvents. Therefore, it can be inferred that for all levels of sample amounts, group C solvents should have the same negative direction of matrix effects caused by the reduced polarity of sample mixtures as group D and E solvents.
When solvents (like water and ethanol) mix or dissolve, the solvation process reduces their partial molar volumes (11). Similarly, as samples are dissolved in the diluent, the sample solvation process also reduces the actual diluent volume available to interact with analyte solvents, resulting in higher concentrations in the liquid phase, and subsequently higher peak responses and positive matrix effects. Therefore, the overall matrix effects are affected by both polarities and sample solvation processes.
As a conclusion, matrix effects, the results of molecular interactions between diluents, analyte solvents, and samples, are mainly dependent on their polarities and closely related to sample solvation processes. Given the complexity of molecular interactions in sample mixtures, further work will be needed to reveal the details of matrix effects. Matrix effects will cause biases for method accuracy when using external standard calibration. The use of proper internal standards, correction factors, or standard addition approaches can compensate for these matrix effects.
Troubleshooting Example: Using Diluent Effects for Benzene Interference Investigations
Benzene is classified as a toxic solvent and its allowed maximum residual amount in samples is 2 ppm (1–3). For headspace analysis, if using 100 mg of sample and 2.0 mL of the diluent, the benzene concentration of corresponding 100% specification level was only 0.1 μg/mL, which produces a very small peak. Benzene analysis is very sensitive to interferences. There were a few special cases of benzene interference in our laboratories; their contamination sources had been undiscovered until they were linked to diluent effects.
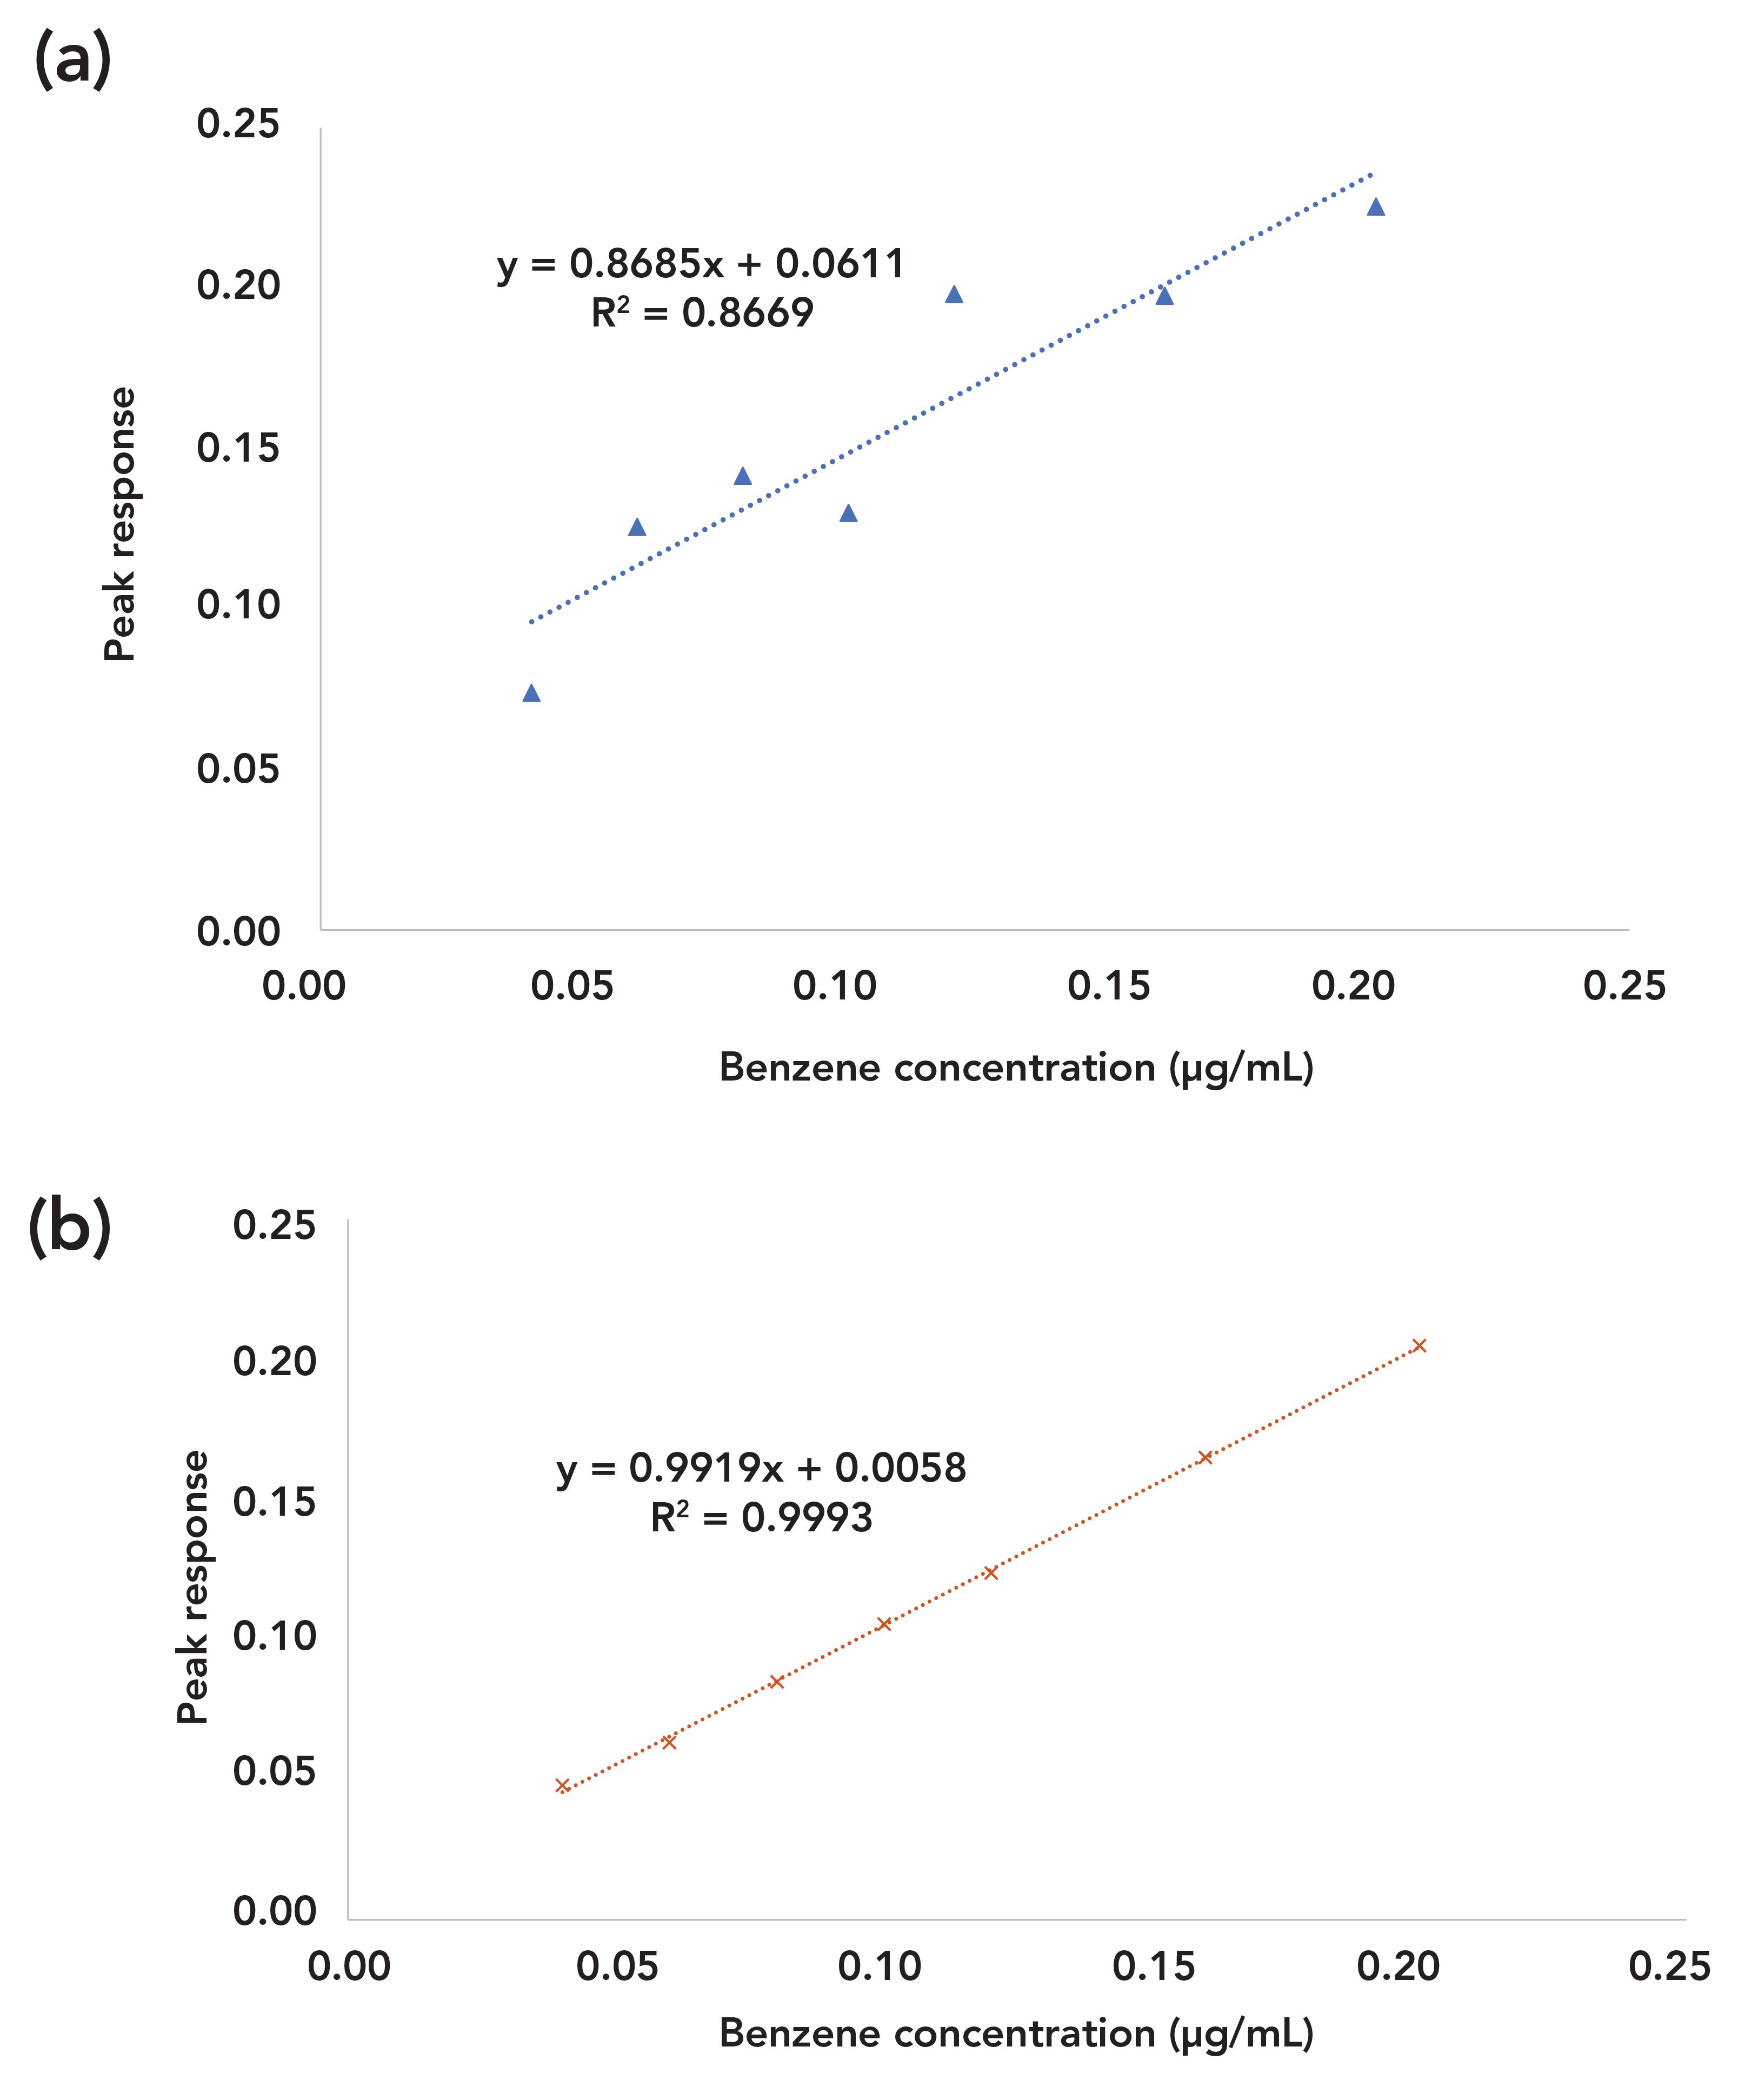
One example was a linearity study of benzene, ethanol, and toluene in a method validation. The correlation coefficients (R2) for ethanol, toluene, and benzene were 1.00, 1.00, and 0.87, respectively. The acceptable criteria for linearity were R2 ≥ 0.98. Benzene linearity failed the acceptable criteria, as shown in Figure 4a. It was shown that some solutions had unexpected higher peak responses, indicating that benzene contamination occurred.
FIGURE 4: (a) Linear regression results for linearity studies of benzene with significant interferences. (b) Linear regression results for linearity studies of benzene after eliminating self-contamination.
Investigations ruled out many possible causes, such as contamination from glassware, dilution errors, or solvent coelution. The method used the mixture with DMS and water as diluents. DMS and water are polar, and benzene is nonpolar. As discussed above for diluent effects, benzene is likely to evaporate from solutions prepared with DMS and water. If this were the cause, evaporation losses of benzene would yield smaller peak responses rather than the higher ones observed in this study.
All solution preparations were performed in a fume hood for safety purposes. Checking the working surroundings, it was noticed that used pipettes were also stored inside the same fume hood. The benzene in the residual solutions contained in used pipettes could evaporate and potentially migrate into diluents. Subsequent solutions prepared with these diluents could yield higher peak responses than originally expected.
To verify this hypothesis, two sets of linearity solutions were prepared. The first set was prepared in the same manner as before and still produced failing results. The second set was prepared by removing all used pipettes out of the fume hood and produced much improved results, with R2 = 1.00, as shown in Figure 4b. Thus, the above hypothesis for benzene self-contamination was confirmed. In addition, the common practice in laboratories of using beakers to add diluents into flasks that already contain solutions of residual solvents could also cause a similar issue.
The issue that happened to benzene could possibly occur to ethanol and toluene as well. Notwithstanding, they did not produce failing results. That was because they either had closer polarities and better compatibility with the diluents and the issue did not occur, or they had higher concentrations, and the possible biases from this issue were not big enough to affect their results significantly.
Understanding and using the theory of diluent effects was the key for success in troubleshooting this problem. This study can provide an example for laboratory investigations for similar issues and a guide for good laboratory practices to avoid interferences, especially for benzene analysis.
Conclusion
In pharmaceutical analysis, when residual solvents are analyzed by static headspace gas chromatography, both sample diluents and sample matrices can produce significant impacts on peak responses of residual solvents. In our study, the tendencies and magnitudes of diluent effects were shown to be mainly dependent on the polarities of residual solvents and diluents. The tendencies and magnitudes of matrix effects were mainly dependent on the polarities of residual solvents, diluents, and samples and further on sample solvation processes. Applying the rules of diluent effects and matrix effects can improve method sensitivity and accuracy and avoid interferences as well.
References
(1) International Conference on Harmonization, ICH Q3C, Impurities: Guideline for Residual Solvents (ICH, Geneva, Switzerland, 2016). 235–460 (2016).
(2) General Chapter <467> “Residual Solvents”, in United States Pharmacopoeia 41–National Formulary 36 (United States Pharmacopeial Convention, Rockville, 2018).
(3) General Text 2.4.24, “Identification and Control of Residual Solvents,” European Pharmacopoeia (European Directorate for the Quality of Medicines, Strasbourg, France, 2017), pp. 146–150.
(4) B. Kolb and L.S. Ettre, Static Headspace Gas Chromatography: Theory and Practice, 2nd Ed. (John Wiley & Sons, Hoboken, New Jersey, 2006), pp. 19–40, 187–190.
(5) N. H. Snow and G. P. Bullock, J. Chromatogr. A. 1217, 2726–2735 (2010). DOI:10.1016/j.chroma.2010.01.005
(6) M. Sithersingh, Ph.D. dissertation, Seton Hall University, South Orange (2018).
(7) T. Li, Y. Guo, H. Hu, X, Zhang, Y. Jin, and X. Zhan, J. Sep. Sci. 39(2), 235–460 (2016).
(8) K. Urakami, A. Higashi, K. Umemoto, and M. Godo, J. Chromatogr. A. 1057, 203–210 (2004). DOI:10.1016/j. chroma.2004.09.055
(9) Z. Chen, W. X. Huang, S. Yu, J. Yang, and H. Liu, J. Chromatogr. Sep. Tech. 6, 289–294 (2015). DOI:10.4172/2157-7064.1000289
(10) C. Reichardt and T. Welton, Solvents and Solvents Effects in Organic Chemistry, 4th Ed. (Wiley-VCH Verlag GmbH & Co. KGaA, Weinheim, Germany, 2011), pp. 550–552.
(11) J.B. Ott, J.T. Sipowaka, M.S. Gruszkiewicz, A.T. Wooley, J. Chem. Thermodynamics 25, 307– 318 (1993).
Yu (Yon) Wang, Jianchen (Jessie) Wang, and Prasad Panzade are with the Department of R&D AD at Apotex Inc, in Toronto, Ontario, Canada. Direct correspondence to: ywang10@apotex.com

Regulatory Deadlines and Supply Chain Challenges Take Center Stage in Nitrosamine Discussion
April 10th 2025During an LCGC International peer exchange, Aloka Srinivasan, Mayank Bhanti, and Amber Burch discussed the regulatory deadlines and supply chain challenges that come with nitrosamine analysis.


