Ion Chromatography–Mass Spectrometry for Profiling Low Molecular Mass Organic Acids in Beverages and Biomass
Special Issues
Organic acids are present in many media and play various crucial roles. Low molecular mass organic acids (LMMOAs) have been researched extensively in many areas, such as food chemistry, as these acids affect taste, shelf-life, and food safety (1–3); agriculture, ecosystems, and environmental science, as these acids act as key components in mechanisms that some plants use to cope with environmental stress (4) and fertilizer release (5); biotechnology, to better understand and optimize fermentation processes (6,7); and biomedical research (8–11). Recently, LMMOAs were found to have inhibitory effects on the bioconversion efficiencies of lignocelluloses to ethanol (12).
Organic acids are present in many media and play various crucial roles. Low molecular mass organic acids (LMMOAs) have been researched extensively in many areas, such as food chemistry, as these acids affect taste, shelf-life, and food safety (1–3); agriculture, ecosystems, and environmental science, as these acids act as key components in mechanisms that some plants use to cope with environmental stress (4) and fertilizer release (5); biotechnology, to better understand and optimize fermentation processes (6,7); and biomedical research (8–11). Recently, LMMOAs were found to have inhibitory effects on the bioconversion efficiencies of lignocelluloses to ethanol (12).
Numerous studies have been performed to develop analytical methods for LMMOAs, including various chromatographic techniques such as ion chromatography (IC), gas chromatography (GC), liquid chromatography (LC), and capillary electrophoresis (CE). Detection methods include ultraviolet (UV), refractive index (RI), conductivity–suppressed conductivity detection (CD), and mass spectrometric detection (MS or MS-MS). Many reported methods focus primarily on a limited number of LMMOAs and are incapable of providing a complete LMMOA profile.
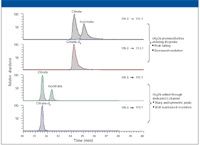
Figure 1: Adding acetonitrile through dedicated C-channel to maintain chromatographic efficiency.
This article describes an IC–MS method for profiling analyses of LMMOAs in beverages and biomass. Ion chromatography was applied to separate LMMOAs due to its superior selectivity. Chromatographic resolution was carefully tuned to ensure desirable separation for critical pairs, such as isomeric analytes. MS detection was utilized to provide sensitive and selective quantification.
Experimental
Materials and Reagents
LMMOA standards were purchased from Sigma-Aldrich (St. Louis, Missouri). Deionized water (18.2 MΩ-cm) was generated in house from a Millipore Milli-Q water station (Billerica, Massachusetts). Acetonitrile (HPLC grade) was purchased from Burdick & Jackson (Morristown, New Jersey). Isotope-labeled internal standards (valeric-d9 acid, glutaric-d6 acid, and citric-d4 acid) were purchased from C/D/N Isotopes (Pointe-Claire, Quebec, Canada). Beverage samples were purchased from local grocery outlets and refrigerated until analysis. Microalgae biomass samples were collected in the growth phase and delivered to the analytical laboratory and refrigerated before analysis.
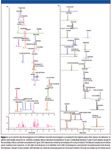
Figure 2
Ion Chromatography
ICS-2000 IC system (all instruments and materials were obtained from Dionex, Sunnyvale, California, except as noted) was operated in external water mode with deionized water regenerant delivered at a flow rate of 1.0 mL/min by an AXP-MS auxiliary pump. Back-pressure tubing was applied to generate a back pressure of ~1000 psi.
The IC columns were IonPac AS11-HC 2 mm analytical columns with AG11-HC guard columns and a CR-ATC continuously regenerated anion trap column (all from Dionex). The eluent source was an EGC II KOH system (Dionex). A hydroxide mobile phase gradient was used: -10 min, 1.0 mM; 0 min, 1.0 mM; 8 min, 1.0 mM; 18 min, 15 mM; 28 min, 30 mM; 40 min; 1.0 mM. The flow rate was 0.38 mL/min, the injection volume was 25 μL, and the oven temperature was 30 °C. Three types of detection were used: Suppressed conductivity detection with an ASRS 300 suppressor (2 mm) (Dionex); MSQ Plus (MS) selected ion monitoring (SIM) (Thermo Fisher Scientific, San Jose, California); and TSQ Quantum Access (MS-MS) (Thermo Fisher Scientific) selected reaction monitoring (SRM).

Table I: MS scan events
SIM Conditions
Acetonitrile was delivered at 0.20 mL/min by a second AXP-MS auxiliary pump and mixed with eluent by a static mixing tee before entering the electrospray ionization (ESI) probe of the mass spectrometer to assist desolvation. Back-pressure tubing was applied to generate a back pressure of ~1000 psi. The nebulizer gas was nitrogen at 80 psi, the probe temperature was 550 °C, the needle voltage was 3000 V, and the scan mode was negative SIM. See Table I for scan details.
SRM Conditions
As with the SIM detection, acetonitrile was used to assist desolvation. However, a static mixing tee was not used — acetonitrile was introduced through the sheath liquid channel and mixed with IC effluent at the tip of the ESI needle. The needle voltage was 4000 V, the sheath gas level was 50 (arbitrary units), the auxiliary gas level was 5 (arbitrary units), the sweep gas level was 2 (arbitrary units), the capillary temperature was 270 °C, and the scan mode was negative SRM. See Table I for scan details.
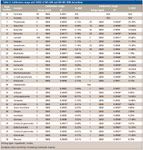
Table II: Calibration range and %RSD of MS SIM and MS-MS SRM detections
Sample Preparation
Primary stock solutions were prepared by dissolving appropriate amounts of individual neat chemicals in deionized water. Calibration standards were prepared by series dilution to 10 levels: 1.00, 5.00, 10.0, 20.0, 50.0, 100, 200, 500, 1000 and 2000 ppb (ng/mL) with a consistent 200-ppb concentration of each isotope-labeled internal standard in each level.
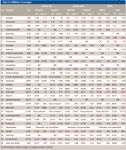
Table III: LMMOAs in beverages
Beverage samples were homogenized by vigorously shaking, and degassed using vacuum filtration through a 0.45-μm GHP membrane. Three 60-μL aliquots of each filtered sample were spiked with internal standards at 200 ppb and diluted with deionized water to a final volume of 6.0 mL.
Biomass samples were centrifuged at 6000 rpm for 15 min. A 600-μL clear aliquot of each sample (n = 3) was spiked with internal standards at 200 ppb and then diluted with deionized water to a final volume of 6.0 mL.
Results and Discussion
Coupling MS Detection to IC
When using an MS detector for IC applications, an organic solvent is usually teed in to the IC effluent before entering MS probe to assist desolvation and to improve ionization efficiency. The MSQ Plus system was coupled to IC by this means. However, when the premixed flow (0.38 + 0.20 = 0.58 mL/min) entered the TSQ ESI probe, a system back-pressure increase (>120 psi) was observed. The additional pressure applied to the IC suppressor adversely affected chromatographic efficiency (that is, it changed retention times, decreased resolution, and distorted peak shapes). As an alternative, the sheath liquid–calibrant channel (C-channel) was used to introduce organic solvent to the IC effluent. The capillary transferring tubing was minimized in length and attached to a customized grounding unit. The system back-pressure increase dropped to 40 psi, which is approximately the optimum operating back pressure for the ASRS 300 suppressor. Figure 1 shows the SRM chromatograms obtained through both approaches. By using the C-channel to add acetonitrile, the observed chromatographic efficiency of the mass spectrometer was very much improved.
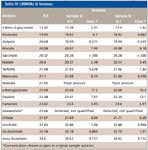
Table IV: LMMOAs in biomass
Method Performance
Figure 2a shows the CD and SIM chromatograms of the standards. Figure 2b shows the SRM chromatograms of the standards at 100 ppb. All 32 LMMOAs were separated and detected. Critical pairs, which cannot be differentiated by MS and MS-MS, such as valeric and isovaleric acids, and succinic and methylmalonic acids, were separated chromatographically.
Linearity and calibration were evaluated by analyzing calibration standards from 1 ppb to 2000 ppb. Calibration range, coefficient of determination (R2 ), and detection limits are listed in Table II. Different fitting types were used for the calibration curve to generate better R2 values. For MS SIM detection, linear, quadratic, and cubic fitting were used to generate a calibration curve with R2 > 0.99. For MS-MS SRM detection, only linear and quadratic fitting were used. Detection limits were determined as the lowest calibration standard that consistently gave a signal-to-noise ratio (S/N) greater than 3 (S/N > 3) and were used as the lower end of calibration range. Low ppb (< 10 ppb) detection limits were achieved for each analyte, with exceptions listed in Table II. Method instrument reproducibility was shown as %RSD calculated from seven replicate injections of a standard at 20 ppb (MS SIM) or 100 ppb (MS-MS SRM). Excellent reproducibility was observed for each analyte by MS SIM detection with %RSD ranging from 2.15% to 8.57%. The %RSD for MS-MS SRM detection ranged from 1.19% to 25.8%.
Comparison of MS and MS-MS Detection Methods
Calibration and Range
The single-quadrupole instrument provided a wider calibration range, up to 5000 ppb, while triple-quadrupole MS showed an upper limit of 2000 ppb. Comparable coefficients of determination (R2 ) were observed using both detectors.
Detection Limits
Both instruments showed good detection limits at low parts-per-billion levels. It is notable that the SIM detection of the MSQ Plus system showed excellent detection for LMMOAs with very low molecular weight, such as formic acid and acetic acid. On the other hand, the SRM detection of these analytes was not sensitive even at high concentrations (above 1000 ppb). MSQ SIM detection also showed better detection limits for LMMOAs with molecular weight < 100 amu (propionic acid, glycolic acid, butyric acid, pyruvic acid, and valeric acid). This difference can be attributed to the enhanced low mass ion optics the MSQ Plus system was equipped with to improve ion transmission efficiency. It is also worth noting that the calibration range of lactic acid started from 100 ppb using MS SIM detection. This is because a significant peak was observed in lactic acid's SIM channel at lower concentration, which was not correlated to the specified amount. This abnormal observation might indicate interference for lactic acid at low concentration. As a more specific detection, SRM showed no interference for lactic acid's specific ion transmission 89.2 → 43.6; therefore, the linear range was extended at the lower end to 5 ppb.
Analyte Stability
Several LMMOAs showed instability in standard solutions. The previously reported conversion of oxalacetic acid to pyruvic acid (13,14) was observed in our experiment. Thus, oxalacetic acid was not included in calibration standards due to its potential interference with pyruvic acid. Other LMMOAs also demonstrated instability, such as fumaric acid, succinic acid, butyric acid, and pyruvic acid, showing a change in relative peak area ratio over time. Stability evaluation will be required for full method validation. For the real sample quantification performed in this study, a fresh set of calibration standards was prepared along with each set of real samples. All solutions were analyzed promptly after preparation.
Application for Beverage and Biomass Analysis
This method was successfully applied to profiling LMMOAs in beverages and biomass. The results are shown in Table III (beverages) and Table IV (biomass). Citric acid was observed as the prominent LMMOA in green tea, with a concentration greater than 200 ppm, and a total of 27 LMMOAs were detected in one or both green tea beverages. Gluconic acid, galacturonic acid, malic acid, tartaric acid, citric acid, and isocitric acid were prominent (> 200 ppm) in grape juice, and 28 LMMOAs were detected. The prominent acids found in grape juice were also observed in wine samples, except citric acid, which had a lower concentration. Lactic acid, acetic acid, and succinic acid were also observed in amounts greater than 200 ppm in wine, and 28 LMMOAs in total were detected. Their concentrations are reported in Table III.
The presence of 17 LMMOAs was confirmed in biomass. Succinic acid was the most prominent LMMOA, with a concentration greater than 200 ppm. Mucic acid, α-ketoglutaric acid, oxalic acid, and citric acid were also present in large amounts (>5 ppm).
Conclusion
Profiling analysis of LMMOAs was described using IC–MS (MS SIM or MS-MS SRM). This sensitive and selective method ensured the detection of LMMOAs from low parts per billion to 2000 ppb (MS-MS SRM detection) or 5000 ppb (MS SIM detection). Linearity was achieved throughout these ranges with coefficients of determination (R2 ) greater than 0.99. Comparable detection limits were observed using both detection techniques, with MS SIM detection providing better sensitivity for low-mass LMMOAs, while MS-MS SRM offered more specific detection. LMMOA profiles of green tea, grape juice, white and red wine, and biomass were reported. The observed prominent LMMOAs agreed with previously reported results (15).
Acknowledgment
The authors would like to thank Rodney Corpus for providing biomass samples for the method evaluation.
Leo Wang, an MS applications chemist, and Dr. William Schnute, the senior manager, are with the Mass Spectrometric Technical Center, Dionex Corporation, Sunnyvale, California.
References
(1) J. Qiu and X. Jin, J. Chromatogr., A 950, 81 (2002).
(2) S. Cortacero-Ramírez, A. Segura-Carretero, M. Hernáinz-Bermúdez de Castro, and A. Fernández-Gutiérrez, J. Chromatogr., A 1064, 115 (2005).
(3) A.P. Oliveira, J.A. Pereira, P.B. Andrade, P. Valentão, R.M. Seabra, and B.M. Silva, Food Chem. 111, 393 (2008).
(4) J. López-Bucio, M.F. Nieto-Jacobo, V. Ramírez-Rodríguez, and L. Herrera-Estrella Plant Sci. 160, 1 (2000).
(5) K. Kpomblekou-A and M.A. Tabatabai, Agric., Ecosys. & Environ. 100, 275 (2003).
(6) K.L. Ross, T.T. Tu, S. Smith, and J.J. Dalluge, Anal. Chem. 79, 4840 (2007).
(7) X. Geng, S. Zhang, Q. Wang, and Z. Zhao, J. Chromatogr., A 1192, 187 (2008).
(8) Q. Zhang, G. Wang, Y. Du, L. Zhu, and J. A, J. Chromatogr., B 854, 20 (2007).
(9) K. Yuan, H. Kong, Y. Guan, J. Yang, and G. Xu, J. Chromatogr., B 850, 236 (2007).
(10) O.Y. Al-Dirbashi, T. Santa, K. Al-Qahtani, M. Al-Amoudi, and M.S. Rashed, Rapid Commun. Mass Spectrom. 21, 1984 (2007).
(11) A. Garcia, C. Barbas, R. Aguilar, and M. Castro, Clin. Chem. 44, 1905 (1998).
(12) S-F. Chen, R.A. Mowery, V.A. Castleberry, G. Pv. Walsum, and C.K. Chambliss, J. Chromatogr., A 1104, 54–61 (2006).
(13) N.T. Chu and F.M. Clydesdale, J. Milk and Food Tech. 39, 477–480 (1976).
(14) C. Torda and H.G. Wolff, J. Pharmacol. Exp. Ther. 98, 358–365 (1950).
(15) I. Mato, S. Suaez-Luque, and J.F. Huidobro, Food Research Int. 38, 1175 (2005).

Analytical Challenges in Measuring Migration from Food Contact Materials
November 2nd 2015Food contact materials contain low molecular weight additives and processing aids which can migrate into foods leading to trace levels of contamination. Food safety is ensured through regulations, comprising compositional controls and migration limits, which present a significant analytical challenge to the food industry to ensure compliance and demonstrate due diligence. Of the various analytical approaches, LC-MS/MS has proved to be an essential tool in monitoring migration of target compounds into foods, and more sophisticated approaches such as LC-high resolution MS (Orbitrap) are being increasingly used for untargeted analysis to monitor non-intentionally added substances. This podcast will provide an overview to this area, illustrated with various applications showing current approaches being employed.
New Study Reviews Chromatography Methods for Flavonoid Analysis
April 21st 2025Flavonoids are widely used metabolites that carry out various functions in different industries, such as food and cosmetics. Detecting, separating, and quantifying them in fruit species can be a complicated process.
Sorbonne Researchers Develop Miniaturized GC Detector for VOC Analysis
April 16th 2025A team of scientists from the Paris university developed and optimized MAVERIC, a miniaturized and autonomous gas chromatography (GC) system coupled to a nano-gravimetric detector (NGD) based on a NEMS (nano-electromechanical-system) resonator.

.png&w=3840&q=75)

.png&w=3840&q=75)


.png&w=3840&q=75)


.png&w=3840&q=75)


