Green Chromatography (Part 2): The Role of GC and SFC
LCGC Europe
The second part of this series on green chromatography describes characteristics of GC and SFC
Gas Chromatography
For more than half a century, gas chromatography (GC) and especially capillary gas chromatography (capillary GC) has been the technique of choice for the analysis of volatiles and semi-volatiles. Progress made in column technology and injection systems during the past decades extended the application range to molecular weights up to 1500 Da. Significant evolutions in GC instrumentation — including electronic pressure control, fast GC ovens, miniaturized devices for splitting, back-flushing, column switching and comprehensive GC — combined with fast detectors (including sensitive and low/high resolution benchtop mass spectrometers) turned capillary GC into a very mature high-resolution technique in a wide variety of disciplines and industries.
Taking into account the current advantages of capillary GC and its inherently green character compared with LC, LC is often selected for 'typical GC' applications.
The analysis of polycyclic aromatic hydrocarbons (PAHs) by LC–fluorescence detection is a typical example. Capillary GC–MS using deuterated PAHs as internal standards is far superior for PAH analysis in environmental samples. Other examples where GC should be preferred over LC are the analysis of triglycerides in chocolate products to elucidate the presence of cacao butter equivalents, analysis of sterols in plant material and analysis of triazines in environmental samples, for example.
Key Points
Considerations such as the analyst's expertise or skill or the availability of a particular instrument often prevail over the green character of GC compared with LC. We have to note, however, that the opposite is also true (i.e., GC is used for typical LC applications). For example, for the analysis of amino acids, analytical productivity is much higher with LC compared with GC. Nowadays, amino acid analysis can be performed by LC–MS without derivatization, which contributes to principle 8 of green analytical chemistry. The same holds true for metabolomic studies: GC–MS analysis is currently quite popular but requires derivatization by oximation and silylation whereas LC–MS analysis can be performed without derivatization.
GC is often not selected for 'thermostability' reasons. There is, however, no clear definition of what a 'volatile' and 'thermostable' solute is. Partly due to this perception, GC is not widely applied in several industries, for example, in the pharmaceutical industry, where the ratio of LC analyses versus GC analyses in quality control (QC) is probably 10/1. Lack of knowledge in GC method development makes transfer of methods from LC to GC difficult and LC is preferred, even if resolution is lower, detection not universal and less sensitive, or identification of impurities is more challenging because electron impact (EI) ionization in LC–MS is not feasible.
Solutes that are considered thermolabile, and used as examples to illustrate degradation in elevated temperature LC, can often be analysed by capillary GC. This is illustrated with the analysis of a standard mixture composed of methiocarb, thalidomide, nifedipine, ethinylestradiol, torcetrapib and maraviroc (Figure 1).
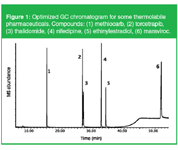
Figure 1: Optimized GC chromatogram for some thermolabile pharmaceuticals. Compounds: (1) methiocarb, (2) torcetrapib, (3) thalidomide, (4) nifedipine, (5) ethinylestradiol, (6) maraviroc.
The mixture was analysed on an apolar column (30 m × 0.25 mm i.d. × HP-5MSUI) (Agilent Technologies, Folsom, USA) using cool-on-column injection and MS detection in scan mode. Helium was used as carrier gas at 1.5 mL/min constant flow and the temperature programme was from 50 °C (1 min) to 150 °C at 50 °C/min, then to 250 °C at 3 °C/min and to 330 °C at 10 °C/min (10 min hold). All solutes are eluting with good peak shapes and without any degradation.The chromatogram was recorded with state-of-the-art optimized GC conditions. It is of the utmost importance to avoid degradation by using cool-on-column injection, proper column selection, constant flow and a relatively slow temperature gradient. The use of splitless injection with a glass wool packed liner and a very fast temperature programme was dramatic in terms of solute stability.
Carrier Gas Selection in GC
Helium is the most widely used carrier gas in GC because it is inert, non-flammable and available in high purity. However, for several years there has been concern over helium supplies. Helium is non-renewable and it is estimated that the earth will be virtually helium-free by the end of the 21st century. Nitrogen is sometimes used in GC as a cheap alternative, but this choice should not be made. Due to the slow mass transfer, the use of nitrogen reduces analysis speed. For the same efficiency (expressed by plate number) or resolution, nitrogen is about three times slower than helium. Increasing linear carrier gas velocity results in a fast and significant loss of column efficiency (and consequently of resolution).
The best alternative is hydrogen. All methods using helium as the carrier gas can be translated into methods using hydrogen without sacrificing resolution, sensitivity and analysis speed. To the contrary, for the same resolution (and plate number), hydrogen is approximately 30% faster than helium (analysis time × 0.7). Moreover, the availability of hydrogen gas generators can overcome concerns about safety of hydrogen gas bottles. In general, the gas generators produce high-quality hydrogen gas using only water as 'fuel'.
Hydrogen can also be used in combination with MS detection. We have experienced, however, a slightly lower sensitivity (approximately 30%) when using hydrogen in GC–MS compared with helium, but mass spectra are very similar.
Fast Capillary GC
Reduction of analysis time in GC and, consequently, increasing sample throughput is contributing to green analytical chemistry. Analysis time in GC can be reduced while maintaining separation and resolution (obtained on a standard 0.25–0.32 mm i.d. column) by using columns with smaller i.d. Plate number and column efficiency in GC depends on the capillary column i.d. (N = L/dc), in the same way as column efficiency in LC depends on the particle size (N = L/2dp). Narrow bore capillary columns have more plates per metre and the same resolution can therefore be obtained using a shorter column length. Moreover, the optimum linear velocity of the carrier gas is increased, which also contributes to a further reduction of analysis time.
The gain in analysis speed can be predicted using method translation software (MTS).1 The use of the MTS calculator is illustrated by the analysis of polychlorinated biphenyls (PCBs).2 Using a standard method on a 30 m × 0.25 mm i.d. × 0.25 µm HP-5MS column, a good separation is obtained for a mixture of PCB congeners, as illustrated in Figure 2(a). For this analysis, hydrogen was used as carrier gas at 1.35 mL/min (40 cm/s) and using a temperature programme from 70 °C (2 min) at 25 °C/min to 150 °C, at 3 °C/min to 200 °C and at 8 °C/min to 320 °C (5 min). Analysis time was about 30 min. The method was translated to a 10 m × 0.10 mm i.d. × 0.10 µm HP-5MS column (Agilent Technologies, Folsom, USA). Hydrogen setting was at 0.54 mL/min (60 cm/s) with a temperature programme from 70 °C (0.44 min) at 113 °C/min to 150 °C, at 14 °C/min to 200 °C and at 36 °C/min to 320 °C (1 min). The chromatogram is shown in Figure 2(b). The resolution, which is vital for the identification and quantification of the most important Ballschmitter congeners, is maintained while analysis time is reduced by about a factor of 3 to 10 min.
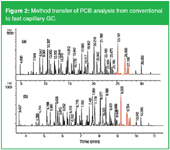
Figure 2: Method transfer of PCB analysis from conventional to fast capillary GC.
Reducing Energy Consumption
As stated before, GC is by definition 'greener' than LC because no solvents are used as the mobile phase. However, in GC, the footprint of the instrument and the energy consumption of a classical GC oven can be substantial.
In 2001, low thermal mass (LTM) technology was introduced by R. Mustacich. The principles and applications have been reviewed in reference 3. With this technology, the capillary column is resistively heated. Power consumption is drastically reduced and extremely fast temperature programme rates (> 1000 °C/min) can be obtained. This technology can be used for ultra-fast GC, however, one should be aware that beyond a certain programme rate (10 °C per void time)4 resolution decreases. An application that is suitable for LTM technology is mineral oil analysis. In this application, also called hydrocarbon oil index (HOI), environmental samples (water, soil, sediment) are screened for the presence of C10 to C40 hydrocarbons. Only limited solute resolution is needed and a simulated distillation profile is obtained. The analysis of a calibration sample, containing a diesel oil (C10–C25) and a motor oil (C20–C40) is shown in Figure 3.
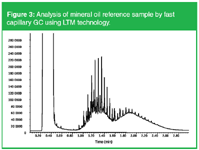
Figure 3: Analysis of mineral oil reference sample by fast capillary GC using LTM technology.
Using classical methods, the analysis time is approximately 30 min. Here, fast oven programming from 40 °C (0.5 min) at 200 °C/min to 240 °C and at 100 °C/min to 340 °C (0.5 min) was used. Analysis time was 3 min. Moreover, LTM technology allows a rapid cool-down from 340 °C to 40°C in about 1.5 in, resulting in total turnaround time of 5 min.
On-site Analysis
Over the years, a trend towards on-site measurement has been observed. Several portable or transportable GC and GC–MS systems are now commercially available that allow on-site analysis. All those systems can be considered as contributing to green analytical methods, because the expensive, energy-consuming transport of samples to laboratories is reduced. On-site sampling also has the advantage that remediation or re-sampling can take place immediately after the first analytical results are obtained.
Recently, a transportable system combining a LTM–GC with a standard MSD system was introduced.5 Using this system, on-site analysis is possible using the same technology and performance as available within a laboratory and sample injection can be performed by liquid split/splitless injection, gas sampling valve, static headspace or solid-phase microextraction (SPME).
Supercritical Fluid Chromatography
Supercritical fluid chromatography (SFC) has been around for over 25 years, but despite its many claimed 'theoretical' advantages over normal phase (NP) HPLC, is only intensively used for some niche applications, for example, chiral separations in the pharmaceutical industry. In recent years, its popularity has increased. This has been ascribed by system advances but, in our opinion, one of the main reasons is its green character. SFC is environmentally friendly and minimizes the use of toxic organic solvents and additives, with their concomitant risks of laboratory worker exposure and disposal problems. Readers can object that CO2-based techniques can never be considered "green" because the gas causes global warming, but CO2 used in SFC is reclaimed from the atmosphere. Moreover, for preparative processes, the CO2 is recycled. In this framework, it is worthwhile to note that International Conferences on Supercritical Fluid Chromatography are organized by the Green Chemistry Group.6
Present interest in supercritical fluid technology mainly originates from the needs in pharmaceutical drug discovery and development. Analytical SFC is not only a fast green separation technique but can easily be up-scaled to semi- and preparative dimensions. Recovering solutes is much easier using CO2-based mobile phases compared with liquid-based semi- and preparative systems.
Notwithstanding its many features, people still consider SFC more a hype than a happening. There are many reasons that can explain why SFC could not keep the promises advanced (and illustrated!) 25 years ago.
The main reason is undoubtly the past instability in the SFC instrumentation market. Big manufacturers that originally began producing SFC instrumentation were disappointed by the unit sales (hundreds per year rather that the expected thousands) and were concentrating more on developments in HPLC, resulting in ultra high pressure and elevated temperature LC, and electrodriven separation methods. However, the small niche suppliers did not have the means to produce robust and easy to validate SFC instrumentation, which is a must to penetrate into QA/QC and regulated applications. Fortunately, the big companies re-entered the SFC market (Agilent Technologies — Aurora, Waters — THAR and JASCO) and it is expected that installation qualification (IQ), operational qualification/performance verification (OQ/PV) and system suitability testing in SFC will soon be at the same level as for state-of-the-art GC and HPLC. We recently presented the validation study for the determination of thiourea in a pharmaceutical intermediate at the 0.01% (w/w) level using packed column SFC on a JASCO system.7 Another example of state-of-the-art SFC is illustrated with the determination of the enantiomeric excess of S-thalidomide. Figure 4 shows the enantiomeric separation of the racemic mixture and of the pure S-enantiomer on a 25 cm × 4.6 mm i.d. × 5 µm Chiralcel OD-H column (Chiral Technologies, Illkirch, France) installed on an Agilent 1260 Infinity Analytical SFC system (Agilent Technologies, Waldbronn, Germany). Operating conditions were: CO2 flow rate = 2 mL/min, modifier = 17% MeOH containing 0.1% TFA and 0.1% DEA, temperature = 30 °C, outlet pressure =150 bar. Note the excellent UV-stability at 220 nm. The enantiomeric excess was 99.72% and the R-enantiomer could easily be measured down to the 0.05% level.
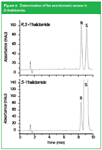
Figure 4: Determination of the enantiomeric excess in S-thalidomide.
Without any doubt, chiral separations in drug discovery are the most important niche application of SFC. Systems have been described with parallel columns, sample pooling and mass spectrometric detection to enhance productivity.8 A system presently used in our laboratories consists of a SFC-pump operated at constant CO2-flow (SandraSelerity Technologies, Kortrijk, Belgium), a standard HPLC pump to deliver the modifier in a programmed way, short columns packed with 3 µm particles and a high resolution TOF-MS. Sample pooling is applied to allow analysis of chiral solutes simultaneously. Figure 5 shows the analysis of a sample containing six solutes from drug discovery on two serial coupled 5 cm × 4.6 mm i.d. × 3 µm dp with LUX-1 Cellulose (Phenomenex, Torrance, USA) and Amy-Coat (Akzo Nobel/Kromasil, Bohus, Sweden), respectively.
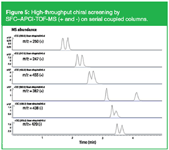
Figure 5: High-throughput chiral screening by SFCâAPCI-TOF-MS (+ and -) on serial coupled columns.
Operating conditions were: CO2 flow rate = 2 mL/min, modifier = MeOH containing 0.1% TFA and 0.1% DEA programmed from 0.2 to 0.8 mL/min (12 to 35%) in 3 min, temperature = 40 °C, and a fixed restrictor at 100 bar at initial conditions. The sample was twice injected with operation of the MS in the positive and negative mode. Total analysis time is 2 × 5 min which means 1.6 min per sample.
A very important feature of SFC is its unique selectivity. In fact in chiral SFC analysis, speed of analysis, by higher diffusivity and lower viscosity, is advanced as the most important characteristic of a supercritical medium compared with HPLC, but in our experience CO2 enhances the selectivity so that the separation can be sped up. CO2 definitely contributes to chiral recognition and in diastereomeric interactions. SFC is by definition a normal-phase mechanism but in practice we experience a multimode mechanism when CO2 is the main mobile phase ingredient. Figure 6 shows the separation of the 16 EPA polycyclic aromatic hydrocarbons (PAHs) on a reversed-phase column (Cosmosil p-NAP, Nacalai, Kyoto, Japan) of 15 cm × 4.6 mm i.d. × 5 µm particles.
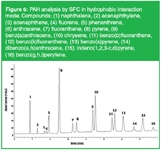
Figure 6: PAH analysis by SFC in hydrophobic interaction mode. Compounds: (1) naphthalene, (2) acenaphthylene, (3) acenaphthene, (4) fluorene, (5) phenanthrene, (6) anthracene, (7) fluoranthene, (8) pyrene, (9) benz(a)anthracene, (10) chrysene, (11) benzo(b)fluoranthene, (12) benzo(k)fluoranthene, (13) benzo(a)pyrene, (14) dibenzo(a,h)anthracene, (15). indeno(1,2,3-c,d)pyrene, (16) benzo(g,h,i)perylene.
Operating conditions were: CO2 flow rate = 2 mL/min constant, modifier = EtOH programmed from 0.0 (1 min) to 0.8 mL/min in 7 min, temperature = 40 °C, a fixed restrictor at 100 bar at initial conditions, and UV-detection at 254 nm. Through p–π interactions all solutes are separated in a very green way compared with the classical water–acetonitrile gradient applied in HPLC for PAH analysis. The figure also opens the discussion on "Is what we are presently doing supercritical, subcritical or enhanced fluidity chromatography?" Most of the noteworthy SFC applications published (> 90% of the chiral SFC separations) are not under 'supercritical conditions'! In Figure 6, starting from around 2 min, subcritical conditions are used and this seems to not have a big influence on the performance of the system.
In the recent literature, using CO2 as a mobile phase ingredient, hardly any differentiation is made between supercritical, subcritical and enhanced fluidity chromatography and regardless of the concentration of modifier, pressure and temperature used, the term SFC is applied. We recently proposed to use SFC for simplified fluid chromatography9 to embrace the different modes. Although the instrumentation used is identical and phase transitions between the different states are hardly detectable, the consequences cannot be neglected. In the fluid state, diffusivity and viscosity are less favourable than in the supercritical state and optimal velocities are closer to HPLC conditions. As an example, the enantioselective analysis of trans-stilbene oxide was performed on a LUX-1 Cellulose column (50 mm × 4.6 mm i.d. × 3 µm) (Phenomonex, Torrance, USA) with CO2 modified with 25% MeOH containing 0.1% TFA + 0.1% DEA. The flow was modified from 1 mL/min to 5 mL/min, the outlet pressure between 100 and 200 bar and the temperature from 30 °C to 60 °C. This embraces the conditions commonly applied in chiral SFC analysis. The best separation in terms of enantio-resolution was obtained at the longest analysis time (30 °C and a flow rate of 1 mL/min) while the outlet pressure had nearly no influence on the resolution while the analysis time was only reduced by 12% from 100–200 bar outlet pressure.
This partly explains why SFC could not keep its promises in terms of faster analysis compared with HPLC. Moreover, developments such as ultra high pressure LC (UHPLC), elevated temperature LC and sub-2 µm particles in recent years overshadowed the speed argument of SFC.
As in HPLC, the stationary phase selectivity is of utmost importance and dedicated SFC stationary phases have been developed. Additionally, all HPLC columns can be used in SFC, giving the user a vast selection of columns to chose from possibly too many to make an informed decision. Stationary phases applied in SFC have been characterized using the solvation parameter model by C. West and E. Lesselier.10 Selection of a stationary phase is particular challenging in developing a generic method for drug discovery. We evaluated and synthesized different stationary phases over the last five years and came to the conclusion that state-of-the-art bare silica is presently the best choice. Our results on bare silica SFC were presented at HPLC 20099 and recently confirmed in the literature.11 Advantages of silica over other SFC phases are that the material is very well characterized, batch-to-batch reproducibility is excellent and, moreover, columns are readily available in all lengths, i.d.s and particle sizes. Fine-tuning of the selectivity can further be done by varying the modifier and additive concentrations, the temperature, the outlet pressure and eventually the flow. The impact of the different parameters on the selectivity is not yet fully understood and quite complicated. Notwithstanding this, generic 'green' conditions for the analysis of polar small molecules on bare silica, at the same time compatible with different detection systems including mass spectrometric detection, could be developed and they are listed in Table 1.
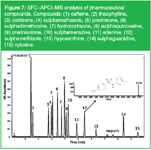
Figure 7: SFCâAPCIâMS analysis of pharmaceutical compounds. Compounds: (1) caffeine, (2) theophylline, (3) cortisone, (4) sulphamethaxole, (5) prednisone, (6) sulphadimethoxine, (7) hydrocortisone, (8) sulphaquinoxaline, (9) prednisolone, (10) sulphamerazine, (11) adenine, (12) sulphamethizole, (13) hypoxanthine, (14) sulphaguanidine, (15) cytosine.
Some points of the table need some clarification. Constant CO2-flow delivery simplifies the instrumentation and guarantees a stable baseline in UV-detection. The pump can easily be installed on standard HPLC instrumentation, from which the modifier is mixed in the gradient mode, without any modification. That the total flow is increased during the analysis, has only a minor influence on the chromatographic performance of the system because the van Deemter curves are relatively flat in this velocity domain. The selected modifiers and additives are not only green but are perfectly suited for the different detection systems and properly deactivate the stationary phase for basic and acidic solutes. Note that water in the range of 1 to 5% is added to the modifier. This not only suppresses silanol-activity but also provides very fast re-equilibration. The water concentration can be adapted to a given application as it has an influence on the selectivity. A fixed outlet restriction of 100 or 150 bar, made from stainless steel tubing of 0.12 mm i.d. and placed after the UV-detector is advantageous for mass spectrometry (MS), evaporative light-scattering detector (ELSD) and charged aerosol detector (CAD). No special interfacing after the classically used back pressure regulator (BPR) in packed column SFC, is required and the complete column effluent is introduced in the universal detectors. For MS detection, atmospheric pressure chemical ionization (APCI) is preferred and APCI can tolerate the high flow rates. We have noted that by making the decompression in the MS source, a perfect spray is formed resulting in very clean MS spectra and high sensitivity.
Some examples of green simplified fluid chromatography using columns packed with 1.8 µm silica particles and the generic conditions are presented in Table 1.
Figure 7 shows the analysis by SFC–APCI-TOF-MS in the positive mode of some solutes of pharmaceutical interest. The column was 5 cm × 4.6 mm i.d. × 1.8 µm Zorbax Rx-SIL (Agilent Technologies, Waldbronn, Germany) and the operating conditions were: CO2 flow rate = 2 mL/min, modifier = EtOH/water (95/5) containing 5 mM ammonium formate and 0.05% formic acid programmed from 0.25 to 1 mL/min in 10 min, temperature = 40 °C, and a fixed restrictor at 100 bar at initial conditions.
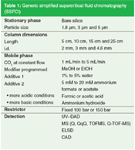
Table 1: Generic simplified supercritical fluid chromatography (SSFC!)
The quantity injected on the column was around 2 ng per compound. Much higher detectability was noted in MS compared with UV. This is an interesting feature of the instrumental set-up as MS is the detector of choice in drug discovery. The insert of the figure shows the spectrum recorded for sulphamethizole with a molecular mass of 270.3.
Figure 8 is an example typically used in the past to illustrate the performance of capillary and packed column SFC namely the analysis of Triton-×-100. High resolution is obtained between the different ethylene oxide oligomers of octyl phenol in less than 5 min. The same column as in Figure 7 was used but with methanol/water (98/2) containing 20 mM ammonium formate as modifier and programmed from 0.4 mL/min to 1 mL/min in 6 min.
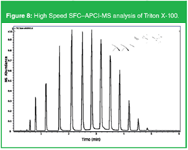
Figure 8: High Speed SFCâAPCI-MS analysis of Triton Ã-100.
We realise that from a theoretical point of view, the application of a constant CO2-flow and a programmed modifier flow in combination with a fixed restrictor can be criticized. However, in an era in which fundamental knowledge and know-how in separation science are declining worldwide, the strength of SFC (i.e., large numbers of variables to tune for a specific application) appears to be the weakness. Neophytes in the field are advised to keep it simple and, in our opinion, the instrumental set-up presented will allow them to see the benefits of CO2-based green simplified fluid chromatography.
Conclusion
Capillary GC is by far the greenest chromatographic technique that should be applied whenever the nature of the solutes allows it to be used. The thermostability of solutes is much higher than presently believed. Chromatographic techniques that use CO2 as mobile phase ingredient contribute to the greening of liquid-based separations. Simple instrumental set-ups can be constructed to perform supercritical, subcritical and enhanced fluidity chromatography.
Pat Sandra is director of the Research Institute for Chromatography (RIC), Kortrijk, Belgium, professor in Separation Science at the Ghent University, Belgium and director of the Pfizer Analytical Research Centre-UGent, Belgium.Alberto Pereira is a researcher specializing in fluid-based separation techniques (LC and SFC) at RIC, Kortrijk, Belgium.Melissa Dunkle is a researcher in natural products using gas chromatography and supercritical fluid chromatography at RIC, Kortrijk, Belgium.Claudio Brunelli is a researcher at Pfizer Analytical Development, Sandwich, UK and is responsible for method development by QbD and for the implementation of SFC in drug development. Frank David is R&D Manager at RIC, Kortrijk, Belgium and extraordinary professor at the Ghent University, Belgium.
References
1 http://www.chem.agilent.com/en-US/Support/Downloads/Utilities/Pages/GcMethodTranslation.aspx
2 P. Sandra and F. David, J. Chromatogr. Sci., 40(5), 248–253 (2002).
3 J. Luong et al., J. Chromatogr. Sci., 44(5), 253–261 (2006).
4 L.M. Blumberg and M.S. Klee, J. Microcolumn Sep., 12(9), 508–514 (2000).
5 http://www.agilent.com/about/newsroom/presrel/2010/01mar-ca10015.html
6 http://www.greenchemistrygroup.org/
7 http://www.chromatographytoday.com/article_read/512
8 Y. Zhao et al., J. Chromatogr. A, 1003(1/2), 157–166 (2003).
9 P. Sandra, Plenary lecture at HPLC 2009, Dresden, Germany.
10 C. West and E. Lesselier, Advances in Chromatography, 48, 195–253 (2010). Eds. E. Grushka and N. Grinberg, Publ. CRC Press, Boca Raton, USA.
11 L.T. Taylor and M. Ashraf-Khorassani, LC•GC Europe, 23(7), 352–357 (2010).
Sorbonne Researchers Develop Miniaturized GC Detector for VOC Analysis
April 16th 2025A team of scientists from the Paris university developed and optimized MAVERIC, a miniaturized and autonomous gas chromatography (GC) system coupled to a nano-gravimetric detector (NGD) based on a NEMS (nano-electromechanical-system) resonator.
Miniaturized GC–MS Method for BVOC Analysis of Spanish Trees
April 16th 2025University of Valladolid scientists used a miniaturized method for analyzing biogenic volatile organic compounds (BVOCs) emitted by tree species, using headspace solid-phase microextraction coupled with gas chromatography and quadrupole time-of-flight mass spectrometry (HS-SPME-GC–QTOF-MS) has been developed.

