Speeding Up Gradients
LCGC Europe
How to make gradient separations faster without changing the separation
There is currently considerable interest in speeding up liquid chromatography (LC) separations through the use of smaller particles, changes in column dimensions and higher flow rates. Some of these gains are made possible through the use of sub-3 μm packing particles and the availability of ultrahigh-pressure liquid chromatography (UHPLC) instruments capable of pressures greater than 400 bar (> 6000 psi). For isocratic methods, the separation time can be reduced with nearly any LC instrument simply by increasing the flow rate. However, a change in flow rate without some additional change can produce surprising changes in the chromatogram in gradient methods. This month's "LC Troubleshooting" takes a look at how to speed up gradient separations while avoiding some common errors that result in selectivity changes.
The Simplest Way?
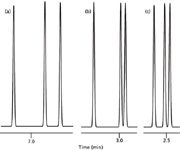
Based upon our experience with isocratic separation, it might seem that the simplest way to speed up a gradient run is to do the same thing that we do with an isocratic one — just increase the flow rate. Take, for example, the partial chromatogram shown in Figure 1(a). Here, the peaks come out in the 7 minute region of a 10 min gradient run at 1 mL/min. This run has well-spaced peaks and is a good candidate for increased throughput. So we increase the flow rate from 1 mL/min for the run of Figure 1(a) to 3 mL/min and get the results shown in Figure 1(b). This looks pretty good. Yes, we've lost some resolution between the last two peaks, but perhaps we can live with it. However, as we continue to work with the method, we realize that the peak order of the last two peaks has reversed between Figure 1(a) and 1(b). What has happened? We're used to some change in column efficiency with flow changes in isocratic separations, but we don't expect peak spacing to change, especially not peak reversals. Is this just one more mystery of gradient elution that causes you to swear off using the technique?

Figure 1: Simulated chromatograms of what can go wrong when changing the flow rate of a gradient separation. (a) 10 min gradient at 1 mL/min, (b) 10 min gradient at 3 mL/min, (c) 3.33 min gradient at 3 mL/min.
What's Really Happening
The results of Figure 1(b) are not at all surprising if you consider the behaviour of solutes in gradient separations. In isocratic runs, we calculate the selectivity, or relative peak spacing α as

where k1 and k2 are the retention factors for the two peaks of interest, calculated as

Here, tR is the retention time and t0 is the column dead time (retention time of the solvent front). Note that if we change the flow rate, both tR and t0 change in proportion to the flow change, so k remains constant with flow rate changes. If k is constant, then α will be constant for an isocratic separation — gradient separations don't follow the same rules.
For gradients, the equivalent of the isocratic retention factor, k, is the gradient retention factor k*:

where tG is the gradient time, F is the flow rate, Δ%B is the gradient range, Vm is the column volume and S is a constant (a value of 5 is a good value for making estimates with compounds < 1000 Da). From Equation 3, it is easy to see that a change in the flow rate will result in a proportional change in k*. When k* is changed (or k in isocratic separation), it is common to see changes in relative peak spacing α. So we should not be surprised to see that there is a change in selectivity when only a change in flow rate is made under gradient conditions. This is a problem that can be overcome easily by making some compensating change in the gradient conditions to keep k* constant. For example, when the flow is increased, we could decrease the gradient time. Or when the gradient range Δ%B is reduced, we could reduce the gradient time. Or if the column length and diameter are changed, we can make another change to compensate. The key is to make compensating adjustments so that k* remains constant.
If gradient conditions are changed such that k* is kept constant, the same separation (in terms of relative peak spacing) should be observed. The most common gradient change is to change the flow rate or gradient time, and these changes are easily adjusted for by changing the other factor. Another way to think of this is that the gradient volume (tG × F) must be constant. The effect of this is illustrated in Figure 1(c), where the flow rate was changed from 1.0 [Figure 1(a)] to 3.0 mL/min, and the gradient time was simultaneously reduced by 1.0/3.0 to 3.33 min. The two gradient volumes are the same: (1.0 mL/min × 10 min) = (3.0 mL/min × 3.33 min) = 10 mL. Now the same sample peak order and relative retention are observed in both runs.
A UHPLC Example
The example of Figure 1 is based upon simulated chromatograms obtained from DryLab software (Molnar Institute, Berlin, Germany). Does this predicted behaviour really happen with real samples? The examples of Figure 2 show that it does indeed. In each chromatogram progressing from Figure 2(a) to 2(f), the flow rate was increased by 1.4-fold, with an appropriate adjustment of the gradient conditions. A quick glance at Figure 2 shows that the retention time of the last peak drops from ≈ 6 min in Figure 2(a) to ≈ 2 min in Figure 2(f) as the flow rate is changed three-fold from 0.35 mL/min to 1.05 mL/min. Let's take a look at the process in a little more detail.

Figure 2: Chromatograms for flow-adjusted gradient runs summarized in Table 2. (Data Courtesy of Dionex)
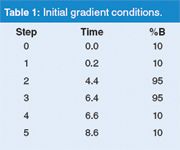
The original gradient was run on a 100 mm × 2.1 mm Acclaim C18 column packed with 120 Å pore, 2.2 μm particles (Dionex Corp., Sunnyvale, California, USA). The A-solvent was water and the B-solvent was acetonitrile, with an initial flow rate of 0.35 mL/min. The gradient conditions are summarized in Table 1. There is an initial 0.2 min hold, followed by a 4.2 min gradient of 10–95% B, a 2.0 min hold and return to the initial conditions for re-equilibration. Whenever the flow rate is changed to speed a gradient, all the "working" gradient steps need to be scaled accordingly, so that the gradient volume is kept constant. By "working", we mean the portion of the gradient responsible for sample elution (the first two segments in the present example). The re-equilibration steps do not need to be scaled, but it is convenient to do so, and when increasing the flow rate, as in this case, this further reduces the run time.

Table 1: Initial gradient conditions.
To obtain the different gradients of Figure 2, the gradient conditions were adjusted as shown in Table 2. For example, when the flow was changed from 0.35 to 0.49 mL/min, a 1.4-fold change, the isocratic segment at the beginning of the run was reduced 0.200/1.4 = 0.143 min. Each of the steps was adjusted in this way. As a check on this, compare the gradient segment of the run shown in Figure 2(f) with that of Figure 2(a). The gradient volume for Figure 2(f) is (1.467 – 0.067 min) × 1.05 mL/min = 1.47 mL, which is equal to the volume for Figure 2(a) of (4.400 – 0.200 min) × 0.35 mL/min = 1.47 mL. So it looks like the scaling worked correctly. Do the results confirm that we've scaled properly?

Table 2: Adjustment of gradient conditions*
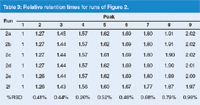
Table 3 shows the retention times of each peak in each run, normalized to the retention of the first peak. If the selectivity was exactly the same between runs, the relative retention should be the same. At the bottom of Table 3 is a calculation of the percentage relative standard deviation (%RSD) for the runs shown in Figure 2. You can see that the %RSD is less than 1% in all cases, an excellent match. A close examination of the data, however, shows that the variation does not seem to be completely random. In fact, the highest-flow runs, Figures 2(e) and 2(f), are the only runs that would be considered at all different from the others. We already checked the scaling and the calculations look OK. What else could be happening to influence the retention times of these runs? One possible factor could be the column temperature. As the flow rate is increased, especially with the smaller-particle columns, frictional heating of the mobile phase takes place. An increase in the column temperature would be expected to lower retention times, and this is consistent with the results, although no effort was made to confirm a temperature change experimentally. Even with this taken into account, the relative retention agreement between runs is impressive.

Table 3: Relative retention times for runs of Figure 2.
A final observation based upon the runs of Figure 2 and the related data of Table 2 is the system pressure. Because the viscosity of water is greater than that of acetonitrile, the pressure under the starting conditions (10% acetonitrile) will be higher than at the final conditions (95% acetonitrile) — this is reflected in the observed pressure range listed in the right-hand column of Table 2 for each flow rate. The pressure should increase in direct proportion to the flow rate and this is observed for the acetonitrile-rich mobile phase (333/109 bar = 1.05/0.35 mL/min = 3-fold). A similar, but slightly smaller increase is observed for the water-rich mobile phase (689/254 bar = 2.7-fold); the reason for this was not investigated.
The maximum flow rate of 1.05 mL/min with the 2.1 mm i.d. column gives the same linear velocity as ≈ 5 mL/min with a 4.6 mm i.d. column, which means that the two flow rates are equivalent. The combination of high relative flow rate and sub-3 μm particles generates pressures beyond the capacity of traditional LC equipment, with pressure limits of 400 bar (6000 psi). Only for the runs with flow rates of < 0.5 mL/min (equivalent to ≈ 2.5 mL/min with 4.6 mm i.d. columns) could conventional LC equipment have been used. Therefore, these experiments were run on a UHPLC capable of pressures in excess of 400 bar. With this added pressure capability, it was simple to increase the flow rate while keeping the gradient volume constant so that the method run time could be reduced from 8.6 to 2.9 min while maintaining the same selectivity. A benefit of the 2.2 μm particles used for this separation is that their performance does not change much with flow rate, so the same resolution was obtained at the higher flow rate as was seen under the initial conditions.
Conclusions
Scaling of gradient runs for changes in flow rate, column size and other gradient conditions can be performed successfully if the conditions are adjusted so that the gradient retention factor k* is kept constant. The relationship shown in Equation 3 is a useful tool to guide the adjustment of gradient conditions. In the example separation of Figure 2, the gradient volume of each gradient segment was kept constant by making the adjustments summarized in Table 2. When proper adjustments were made, an equivalent separation was possible over a three-fold change in flow rate.
Stefan Brand is a technical sales representative with Dionex in Olten, Switzerland.
"LC Troubleshooting" editor John W. Dolan is vice president of LC Resources, Walnut Creek, California, USA; and a member of LCGC Europe's editorial advisory board. Direct correspondence about this column to "LC Troubleshooting", LCGC Europe, Poplar House, Park West, Sealand Road, Chester CH1 4RN, UK, or e-mail Alasdair Matheson at amatheson@advanstar.com
New Study Reviews Chromatography Methods for Flavonoid Analysis
April 21st 2025Flavonoids are widely used metabolites that carry out various functions in different industries, such as food and cosmetics. Detecting, separating, and quantifying them in fruit species can be a complicated process.
Extracting Estrogenic Hormones Using Rotating Disk and Modified Clays
April 14th 2025University of Caldas and University of Chile researchers extracted estrogenic hormones from wastewater samples using rotating disk sorption extraction. After extraction, the concentrated analytes were measured using liquid chromatography coupled with photodiode array detection (HPLC-PDA).

.png&w=3840&q=75)

.png&w=3840&q=75)


.png&w=3840&q=75)


.png&w=3840&q=75)


