GCxGC-FID for Qualitative and Quantitative Analysis of Perfumes
LCGC Europe
Exploring the use of GCxGC-FID as a technique for qualitative and quantitative analysis of perfumes
Comprehensive two-dimensional gas chromatography (GC×GC) is a powerful and sensitive analytical technique, which has been extensively used for both the qualitative and quantitative analysis of complex samples. However, its potential as a quantitative technique has not been full explored, but the use of multivariate chemometric techniques instead of conventional peak integration strategies is emerging as an important alternative for this task. The use of GC×GC–FID for the quantification of either individual chemical components or complex formulation ingredients on perfumes and similar materials using this approach is described. A procedure based on the application of a novel chemometric algorithm — multivariate curve resolution (MCR) — was applied to quantify one of the ingredients in a perfume-like formulation, rosemary oil, using GC×GC–FID data. The combination of GC×GC–FID and MCR allowed accurate and precise quantification of rosemary oil on this formulation, with root mean squared error of prediction of 0.46% for concentrations in the range between 4–12% v/v.
Comprehensive two-dimensional gas chromatography (GC×GC) was introduced by J.B. Phillips and co-workers in 1991 and has become increasingly popular in the 21st century. GC×GC is a powerful alternative to conventional GC due to its ability to simultaneously enhance the separation capacity and significantly increase the sensitivity and detectability using an instrument which, in essence, is a modified standard gas chromatograph.
An early report from Dallüge and co-workers,1 where about 30000 single peaks could be detected on a single GC×GC–TOF-MS chromatogram from cigarette smoke, had a considerable impact on the recognition of the technique and drew the attention both from end-users and researchers involved in separation science. However, the more striking aspect of graphical representations of GC×GC Chromatograms is the presence of spatially ordered groups of peaks resulting from structurally-related compunds, which are easily discerend upon visual inspection of these chromatograms. The presence of chromatographic structure depends both on the orthogonality of the stationary phases on the column set used and, of course, on the existence of groups of these related compounds in the sample.2 Most of the applications of GC×GC described to date are focused on its application for qualitative analysis, ranging from systematic and comprehensive identification of eluates using GC×GC–TOF-MS,3 or –qMS systems,4 to more complex applications on pattern recognition, fingerprinting and classification of complex samples.5
However, there are comparatively few quantitative applications of GC×GC systems reported. Paradoxically, one of the possible reasons may be the remarkable ability of GC×GC to provide qualitative data related both to sample composition and identity, even using non-MS detection. In particular where peak structure is clearly visible, some users are certainly enticed to focus their efforts on these qualitative applications. Of course, there are other and more solid reasons for the restricted use of GC×GC for quantitative analysis at present.
The general principle for quantification of discrete eluates on GC×GC is essentially the same as in conventional chromatography: ideally, the mass of analyte or its concentration on the sample is proportional to the "volume" of the corresponding three-dimensional peak on the 1tR × 2tR plane (in fact, the sum of the individual peak areas for each 2D narrow peak resulting from the modulation of the chromatographic band emerging from the 1D column),6 provided some requirements are met. The mass transfer from the 1st to 2nd dimension columns through the modulation device should be complete, or at least quantitative (which is true for most of the modulator designs presently in use). Also, since base widths of properly modulated 2D peaks are on the hundreds of milliseconds range, both detector and its corresponding signal conditioning electronics should allow data acquisition fast enough to provide a number of digitized points: enough to achieve reliable integration (at least 10 points for each peak, corresponding to typical acquisition rates of 100 Hz or more).7 The integration of individual 2D peaks can be performed using standard chromatographic software, and the individual 2D peak areas can be manually compiled and added. This was usual in early reports, such as the work of Truong et al.8 where a newly proposed GC×GC system was validated, among others, through analytical curves for sterols and 5-α-cholestane.
This approach is simple, does not require specialized software and is capable of providing good results, and is still occasionally used — despite being time- and work-consuming. The automation of the necessary operations using self-made applets has been reported.9 However, there are currently commercial software packages specific for GC×GC capable of detecting and integrating peaks suitable for quantitation of target analytes. As suggested by its name, GC Image (GC Image LLC, Lincoln, Nebraska) performs peak detection and integration treating the chromatograms (Signal × 1tR × 2tR sets) as images and applying graphic processing routines to the data.10–12 Other commercial products, such as Thermo Fisher's HyperChrom13 and LECO´s ChromaTOF14 use approaches to 2D peak detection and integration similar to that of conventional chromatographic software, but incorporating specific features for GC×GC data, such as generation of chromatograms as contour plots and advanced deconvolution of MS signals.
Even considering the convenience and reliability of these new programs, there are some problems related to their use for quantification of target analytes. They are not intended as tools for general use, and typically are designed to open and process only chromatograms generated using the proprietary data formats pertinent to its supplier. Also, even though some of these programs permit automated allocation of peaks and generation of reports, the huge size of the data matrixes and the large number of resolved peaks still cause the processing of the data to be complex and lengthy.6
An alternative to peak integration-based quantification on GC×GC is the use of chemometric multivariate approaches. As a general rule, data from comprehensive two-dimensional chromatographic systems are extremely large and complex, and their interpretation without chemometric tools can be particularly problematic, or even impossible in some cases.15 Chemometric tools have been widely applied to GC×GC data with varied purposes, among others for the extraction of quantitative data. General rank annihilation method (GRAM) — a deconvolution technique suitable for bilinear data structures — was used by Fraga et al.16 to quantify alkylbenzenes on jet fuel using GC×GC–FID. GRAM is only suitable for bilinear data (where the Signal × 1tR × 2tR raw profile from a target analyte can be represented as the product of two independent vectors, corresponding to the first and second column chromatographic profiles for the analyte — Signal × 1tR and Signal × 2tR, respectively), which is not always the case for GC×GC. When temperature programming is used, or for GC×GC–MS data, the structures are tri-linear. In these cases, more sophisticated techniques such as Parallel Factor Analysis, PARAFAC and PARAFAC2,17,18 should be used.
Another advanced chemometric calibration tool shown to be suitable for quantitative applications of GC×GC is Multiway Partial Least Squares, N-PLS.19 N-PLS is an extension of the partial least squares (PLS) technique, a well studied multivariate approach, and a general method to find regression models correlating independent and dependent variables — for example, concentration of target species on samples and chromatograms — such as (detector signal × time) line vectors, in conventional GC. N-PLS is an extension of PLS suitable to obtain quantitative models from higher-order data, such as the (Signal × 1tR × 2tR) GC×GC chromatograms.
We will briefly present and discuss here some applications combining chemometric tools and GC×GC-FID for analysis of perfumes. Along with petrochemical materials, fragrance-related samples are among the leading fields of application of GC×GC. For several reasons, the analysis of the chemical composition of aromas and related samples may be a challenging task20 because, besides the need to detect very low concentrations of relevant analytes in these samples (typical perceptible concentrations for some odorants can be less than ng/L), most aromas are extremely complex blends of substances. Therefore, the improvement in resolution provided by the second separation dimension on GC×GC may be essential.21 Furthermore, although not in such an extensive way as in petrochemical samples, there are abundant groups of structurally related substances and the consequent presence of structure on the chromatograms simplify their identification. Perhaps the most relevant application of GC×GC to quantitative analysis of perfumes and fragrances is the assessment of the presence and level of allergen constituents. The Directive 2003/15/EC of the European Parliament22 listed 26 substances known to produce allergic reactions to humans and whose level on cosmetic and toilet products should be controlled (maximum of 10 ppm m/v and 100 ppm m/n on "leave-on" and "rinse-off" products, respectively): amyl cinnamaldehyde, amylcinnamic alcohol, anisol, benzyl alcohol, benzyl benzoate, benzyl cinnamate, benzyl salicylate, butylphenylmethylpropional, cinnamaldehyde, cinnamic alcohol, citral, citronellol, coumarin, eugenol, farnesol, geraniol, hexylcinnamaldehyde, hydroxyisohexyl-3-cyclohexene-carboxaldehyde, isoeugenol, isomethylionone, hydroxycitronellal, limonene, linalool, methyl-2-nonynoate, methyl-2-octynoate and phenylacetaldehyde. Shellie et al.21 and Debonneville and Chaintreau23 demonstrated that 24 of these allergens can be quickly and conveniently quantified by both GC×GC–FID and GC×GC–qMS respectively, but using a conventional peak integration approach.
Recently, our group proposed and evaluated another modification of PLS, interval N-way partial least squares, iNPLS24 to detect and quantify some of the EC-regulated allergens — geraniol, citronellol and benzyl alcohol — on perfume samples. The reasoning behind iNPLS is that in some instances — especially for quantification of target analytes — it may not be desirable to use the entire chromatogram as input data to chemometric processing, because only a small section of the chromatogram may be relevant to the problem. The remainder of the chromatogram contains no significant information regarding the concentration of the desired species, and processing these portions of the data along with the appropriate sections can lead to quantitative errors. On iNPLS, the GC×GC-FID chromatograms obtained for calibration samples spiked with known amounts of the analytes are split in several rectangular pieces, and NPLS quantitative models are built for each set of sub-chromatograms. The part of the chromatogram that resulted on the best model is chosen for the quantification. Concentrations from 25–100 ppm of the allergens could be detected and quantified with precision and accuracy (root mean errors of cross validation of 10.5% or less).
Another possible application of GC×GC for quantitative analysis may be the direct determination of the content of each ingredient used their preparation — even when these ingredients are complex mixtures by themselves. For example, perfumes are formulated mixing adequate amounts of fragrance components such as essential oils, plant extracts, fixing agents, preservating additives, diluents, etc. Some of these ingredients, such as essential oils, are complex mixtures by themselves and the direct determination of their content in final products can be relevant for reasons ranging from quality control of finished products to the study of shelf life of finished and stored materials. In the next sections, we present a method to directly determine the content of rosemary (Rosmarinus officinalis) essential oil in a lab-made formulation obtained by spiking this oil in mixtures of artificial pineapple essence, propylene glycol (used as fixing ingredient on real perfumes) and cereal alcohol; this mixture was selected to simulate a complex, real-life perfume.
The quantification was performed through the technique known as multivariate curve resolution (MCR), developed by R. Tauler25 in 1995. In general terms, the raw chromatograms are decomposed and virtual chromatograms corresponding to the profile for the "pure" ingredient being quantified (in this case, rosemary oil) and numeric vectors containing quantitative data relative to this ingredient are obtained. In more formal terms, in MCR the data sets (in this case, GC×GC-FID chromatograms for calibration and test samples) are decomposed according to the following expression:
D = CST + E
where D is the experimental data, matrix C contains values associated with the concentration of each retrieved ingredient, ST is the matrix with the pure profiles recovered by the algorithm for each ingredient and E is the error matrix. MCR solves iteratively this expression using an alternating least squares (MCR-ALS) algorithm, which calculates concentration C and pure profiles ST matrices optimally fitting the experimental data D. This optimization is performed for a proposed number of ingredients and using initial estimates of either C or ST. One important feature of MCR is that some constraints, such as non-negativity, unimodality, selectivity and closure, can be applied to the model during the optimization, to provide results with chemical meaning.
Experimental
GC×GC-FID
The GC×GC-FID prototype employed uses a G6890 Series II GC-FID system (Hewlett-Packard, Wilmington, Delaware, USA) fitted with a split–splitless injector and using H2 (0.6 mL/min) as the carrier gas. This prototype has a laboratory-made four-jet cryogenic modulator, based on devices previously described in the literature.26,27 The cryogenic fluid was N2 (gas) cooled by LN2; N2 flow was toggled by two three-way Asco (Florham Park, New Jersey, USA) solenoid valves. The command of these valves was performed by a DAQPad-6015 16 bits AD/DA board controlled by self-made software developed using the LabView v.8.2 programming environment (National Instruments, Austin, Texas, USA) and connected to an AMD Athlon 4600 GHz Dual Core personal computer. The column set used consisted of a 30 m × 0.25 mm, 0.25 μm HP-5 (Agilent, Avondale, Pennsylvania, USA) capillary column connected by a press fit connector to a 1 m × 0.1 mm, 0.1 μm SupelcoWax (Supelco, Bellefont, Pennsylvania, USA) column. For all runs, the modulation period was set to 6.0 s. The oven temperature programme was: 60 °C at 3 °C/min up to 226 °C; the injection and detection temperatures were 250 °C. The chromatograms were acquired through Agilent´s Chemstation software and exported as ASCII vector files.
Samples
Rosemary essential oil, synthetic pineapple essence and cereal alcohol were purchased at a specialized store in Campinas, Brazil. The solutions used for the calibration model were made by diluting the essential oil in cereal alcohol, with concentrations of 2.5%, 5.0%, 7.5%, 10.0 and 15.0% v/v. The validation set consisted of mixtures of rosemary oil, pineapple essence and cereal alcohol (Table 1). This particular mixture of fragrance is not used in any commercial perfume known to the authors, and the ingredients were selected to provide an adequately complex "perfume"-like sample.

Table 1: Composition of the validation samples (remainder is propylene glycol and cereal alcohol).
Results and Discussion
To obtain initial estimates of the profiles of the ingredients in the mixture, the chromatograms of the pure rosemary oil and pineapple essence were used. The chromatograms for the pure components and for the calibration and validation sets were unfolded and aligned using a peakmatch algorithm.28 Figures 2 and 3 show chromatograms for the calibration sample #2 (5% rosemary oil on propylene glycol/cereal alcohol) and validation sample #5 (5% rosemary oil and 10.0% pineapple essence on propylene glycol/cereal alcohol); Figure 1 shows a chromatogram for pure rosemary oil, for comparison.
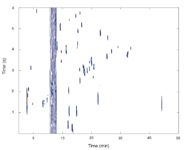
Figure 1: GCÃGCâFID chromatogram for rosemary oil.
In all of the chromatograms, there is a broad peak starting on 1tR ≈ 10.5 min appearing as a streak through all 2D space. This peak was identified as the result of the co-elution of glycerol, propylene glycol and dipropylene glycol, which are common solubilization aids and fixing agents for perfume industry.29 Due to their large relative concentration and highly polar nature, they elute on the second dimension column as extremely large and tailed peaks. These species were not added to the samples during their preparation, but were present in the fragrance ingredients used (rosemary oil and pineapple essence); the materials used here were made for use as raw materials for toiletry industry and as they were supplied, already contained the necessary additives and preservatives. The presence of such interferents is, therefore, expected on most perfume and cologne products (at least, on the low-cost, "popular" brands). During the data processing, it was observed that the regions that contain these peaks (10.2 min < 1tR < 14.4 min), as well as the beginning of the chromatograms (1tR < 3.5 min) had no significant quantitative information, and they were suppressed from the data sets for obtaining the quantitative models. We have been observing that the elimination of sections of the chromatograms containing major components of samples from the input data used on multivariate processing improves both the accuracy and precision of the results, whenever the species corresponding to the obliterated peaks are not the targets of the quantitative analysis.
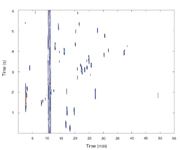
Figure 2: GCÃGCâFID chromatogram for validation sample #2 (5% rosemary oil in propyleneglycol/cereal alcohol).
After pre-processing the data (removing parts not containing relevant information and peak alignment) the sets were subject to MCR-ALS processing using two components, as well as restricting the selectivity for concentrations and non-negativity for concentrations and chromatograms. The model obtained for the calibration set — containing only rosemary oil and cereal alcohol — was applied to the validation samples, and the plot of predicted versus real concentration that was obtained is shown in Figure 4.
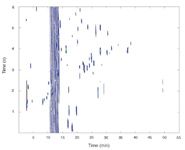
Figure 3: GCÃGCâFID chromatogram for calibration sample #5 (5% rosemary oil and 10 % pineapple essence in propyleneglycol/cereal alcohol).
The root mean squared error of prediction (RMSEP) for the model — which is an approximate estimate both of accuracy and precision of results — was 0.46%; the correlation between the expected and interpolated concentrations was 0.991. These results show that, applying proper chemometric tools, it is possible to use GC×GC-FID data not only for quantification of single, target species but also the direct determination of complex ingredients in industrial and commercial formulations, such as the "fragrance" content (i.e., raw essential oil) in perfumes and similar samples — without resorting to the adoption of markers, single compounds which can be quantified and indirectly associated to the concentration of these components. This application can be extremely relevant to the perfume and cosmetic industry, both in the product development stages and for routine quality control. It could also be an extremely useful approach for other fields of application — from petrochemical industry (e.g., finding how much of an specific petroleum cut is present in a fuel or lubricant) to environmental monitoring.
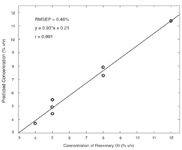
Figure 4: Predicted concentrations of rosemary oil versus real concentrations obtained using the MCR-ALS model applied to GCÃGCâFID data.
Acknowledgment
We would like to thank the State of São Paulo (Fapesp) and Brazilian Federal (CNPq) Research Support Agencies for funding, and Brazilian Federal Agency for the Support and Evaluation of Graduate Education (Capes) for scholarships.
Fabio Augusto is associate professor of analytical chemistry at the University of Campinas (Unicamp), Brazil. His research interests include development and applications of comprehensive two-dimensional gas chromatography, as well as solid phase extraction (SPE) and microextraction (SPME).
Ronei J. Poppi is also associate professor of analytical chemistry at Unicamp and specialises in research on chemometrics, for processing both spectroscopic and chromatographic data.
Marcio Pozzobon Pedroso obtained his Sci. Dr title in Unicamp, working with GC×GC and is now a post-doctoral fellow in the same department.
Luiz Antonio de Fonseca Godoy and Leandro Wang Hantao are graduate students at Unicamp. They focus on chemometrics for GC×GC (LAFG) and GC×GC applications for lipidomics (LWH).
References
1. J. Dallüge et al., J. Chromatogr. A, 974(1–2), 169–184 (2002).
2. J.C. Giddings, J. Chromatogr. A, 703(1–2), 3–15 (1995).
3. X. Li et al., Anal. Chim. Acta, 633(2), 257–262 (2009).
4. R.A. Shellie and P.J. Marriott, Analyst, 128(7), 879–883 (2003).
5. C. Cordero, C. Bicchi and P. Rubiolo, J. Agric. Food Chem., 56(17), 7655–7666 (2008).
6. O. Amador-Muñoz and P.J. Marriott, J. Chromatogr. A, 1184 (1–2), 323–340 (2008).
7. J. Beens et al., J. High Resolut. Chromatogr., 21(1), 47–54 (1998).
8. T.T. Truong, P.J. Marriott and N.A. Porter, J. AOAC Int., 84(2), 323–335 (2001).
9. R.A. Shellie, L.L. Xie and P.J. Marriott, J. Chromatogr. A, 968(1–2), 161–170 (2002).
10. S.E. Reichenbach et al., J. Chromatogr. A, 985(1–2), 47–56 (2003).
11. S.E. Reichenbach et al., Chemom. Intell. Lab. Syst., 71(2), 107–120 (2004).
12. S.E. Reichenbach et al., J. Chromatogr. A, 1071(1–2), 263–269 (2005).
13. HyperChrom Data System, Thermo Fisher Scientific Corp. (Waltham, Massachusetts, USA).
14. ChromaTOF Software for Separation Science, Leco Corp. (St Joseph, Michigan, USA).
15. K.M. Pierce et al., J. Chromatogr. A, 1184(1–2), 341–352 (2008).
16. C.G. Fraga, B.J. Prazen and R.E. Synovec, Anal. Chem., 72, 4154–4162 (2000).
17. A.E. Sinha et al., J. Chromatogr. A, 1056(1–2), 145–154 (2004).
18. L.A. Godoy Jr et al., Anal. Lett., 41(9), 1603–1614 (2008).
19. M.P. Pedroso et al., J. Chromatogr. A, 1201(2), 176–182 (2008).
20. F. Augusto, A.L. Lopes and C.A. Zini, TrAC Trends Anal. Chem., 22(3), 160–169 (2003).
21. R. Shellie, P.J. Marriott and A. Chaintreau, Flavour Fragr. J., 19(2), 91–98 (2004).
22. European Parliament and The Council of the European Union, L66/26, Official Journal of the European Union 11/3/2003 (available at http://eur-lex.europa.eu/LexUriServ/LexUriServ.do?uri=OJ:L:2003:066:0026:0035:en:PDF)
23. C. Debonneville and A.J. Chaintreau, J. Chromatogr. A, 10270(1–2), 109–115 (2004).
24. L.A.F. Godoy Jr et al., Quantitative Analysis by Comprehensive Bidimensional Gas Chromatography using Interval MultiWay Partial Least Squares Calibration, 11th International Symposium on Hyphenated Techniques in Chromatography and Hyphenated Chromatographic Analyzers (HTC-11), Brugge, Belgium, (2010).
25. R. Tauler, A. Smilde and B. Kowalski, J. Chemom., 9(1), 31–58 (1995).
26. J. Harynuk and T. Górecki, J. Chromatogr. A, 1019(1–2), 53–63 (2003).
27. M. Pursch et al., J. Chromatogr. A, 1019(1–2), 43–51 (2003).
28. K.J. Johnson et al., J. Chromatogr. A, 996(1–2), 141–155 (2003).
29. N.J. van Abbé, Perfume and the Manufacture of Consumer Products, Poucher's Perfumes, Cosmetics And Soaps, 10th ed., H. Butler (ed.), Springer, 717–748 (2000).
New Study Reviews Chromatography Methods for Flavonoid Analysis
April 21st 2025Flavonoids are widely used metabolites that carry out various functions in different industries, such as food and cosmetics. Detecting, separating, and quantifying them in fruit species can be a complicated process.
University of Rouen-Normandy Scientists Explore Eco-Friendly Sampling Approach for GC-HRMS
April 17th 2025Root exudates—substances secreted by living plant roots—are challenging to sample, as they are typically extracted using artificial devices and can vary widely in both quantity and composition across plant species.
Sorbonne Researchers Develop Miniaturized GC Detector for VOC Analysis
April 16th 2025A team of scientists from the Paris university developed and optimized MAVERIC, a miniaturized and autonomous gas chromatography (GC) system coupled to a nano-gravimetric detector (NGD) based on a NEMS (nano-electromechanical-system) resonator.

.png&w=3840&q=75)

.png&w=3840&q=75)


.png&w=3840&q=75)


.png&w=3840&q=75)
