Does High Polarity Mean High Retention on Stationary Phases in Gas Chromatography?
Stationary phase chemistry, polarity, and selectivity have been of ongoing interest since the inception of gas chromatography (GC) in the 1950s. In the early days when most analyses were performed on packed columns, there were hundreds of stationary phase materials available. Today, with modern capillary columns, most GC analyses are performed with a few stationary phases, with a wide array of choices for specialty applications. Stationary phases are often classified using the broad term polarity, with polar stationary phases recommended for separating polar analytes and nonpolar stationary phases recommended for nonpolar analytes. In this installment, we examine the idea of stationary phase polarity. We examine the assumptions inherent in the most popular stationary phase polarity evaluating systems—McReynolds constants and the polarity scale. We see that high polarity does not always mean greater retention or higher selectivity.
Nonpolar, moderately polar, and polar are probably the most used modifiers when describing stationary phases in gas chromatography (GC). We have all heard about stationary phases, such as polydimethylsiloxane (PDMS), being called nonpolar, cyano-modified PDMS being called moderately polar, and polyethylene glycol (PEG) being called polar. We also all remember the definitions of polar molecules and polar bonds from undergraduate chemistry, so we think about electronegativity differences and the presence of heteroatoms in the structure as a sign of a more polar compound. Translated to GC, we then use the old maxim “like dissolves like” to think about which stationary phase to choose to retain a given analyte or set of analytes. The stationary phase that seems to have a structure most similar to the analytes or the stationary phase that is on hand is often the eventual choice.
Whenever I am told that a compound is polar, I ask, “Compared to what?” As we are in winter here in the eastern United States, I am reminded of a common and often entertaining social situation—talking about the weather. Depending on who you talk with, a nice January day in New York City, with an average temperature of 39 °F or 4 °C, may be either hot or cold, depending on who is discussing it. My friend from Florida might think it is cold, whereas my other friend from Vermont might think it is warm. So which is it? Polarity must be thought of in a similar fashion in that the word by itself is meaningless without a standard for comparison.
In GC, there are two common measures for providing this comparison, both of which we discussed in an earlier column (1). These are Rohrschneider-McReynolds constants, developed in the 1960s, and a polarity scale developed by Mondello in 2011 (2–4). As discussed in the previous column, the Mondello polarity scale is based on a sum of McReynolds constants, so both measures have the same basis. Both methods can easily lead to the common assumption that higher numbers for the constants indicate greater retention and greater selectivity for compounds that have a similar structure to the test probes.
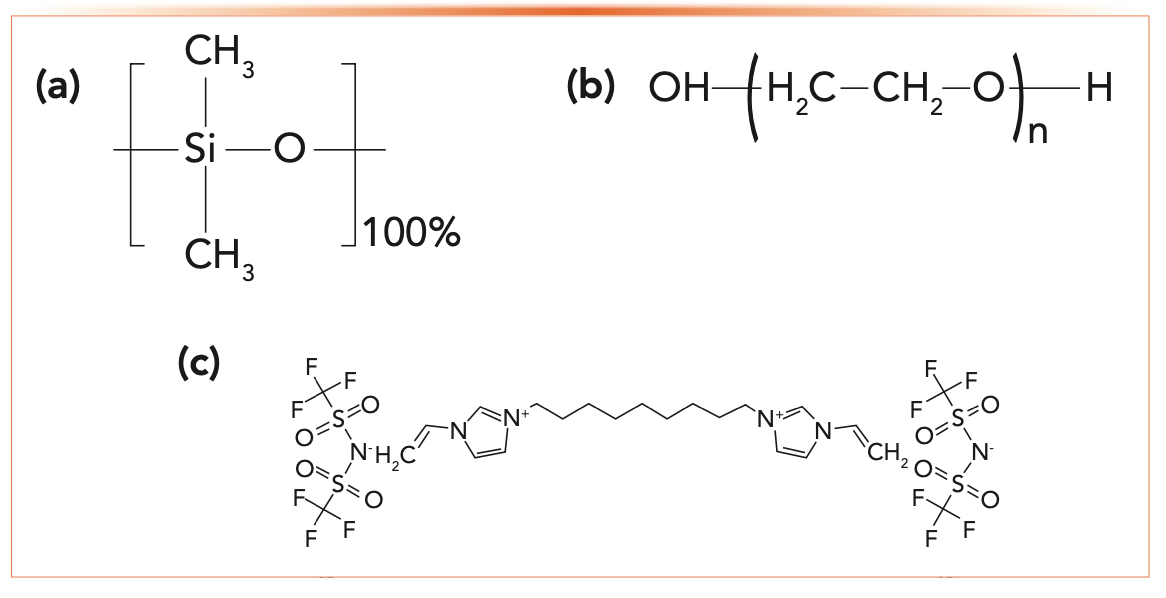
To examine this assumption, consider three stationary phases (PDMS, PEG, and an ionic liquid, SLB-IL-100) whose structures are shown in Figure 1. A quick examination of the structures shown in Figure 1 shows a different chemistry for each stationary phase. We can expect that PDMS retains analytes by dispersive interactions, indicating strong retention for analytes containing high hydrocarbon content. PEG, with a high hydroxy content, indicates strong retention of analytes capable of hydrogen bonding. Finally, SLB-IL-100, a molten salt, has complex retention properties, but because it is a salt, we can expect that it will not strongly retain hydrocarbons. Although a long hydrocarbon chain is seen in the structure, it seems likely that this chain, being flexible, bends to a conformation that exposes more of the polar and ionic character of the structure.
FIGURE 1: Structures of nonpolar, polar and very polar stationary phases. (a) poly-dimethylsiloxane, PDMS (nonpolar), (b) polyethylene glycol, PEG (polar), (c) SLB-IL-100 (very polar).

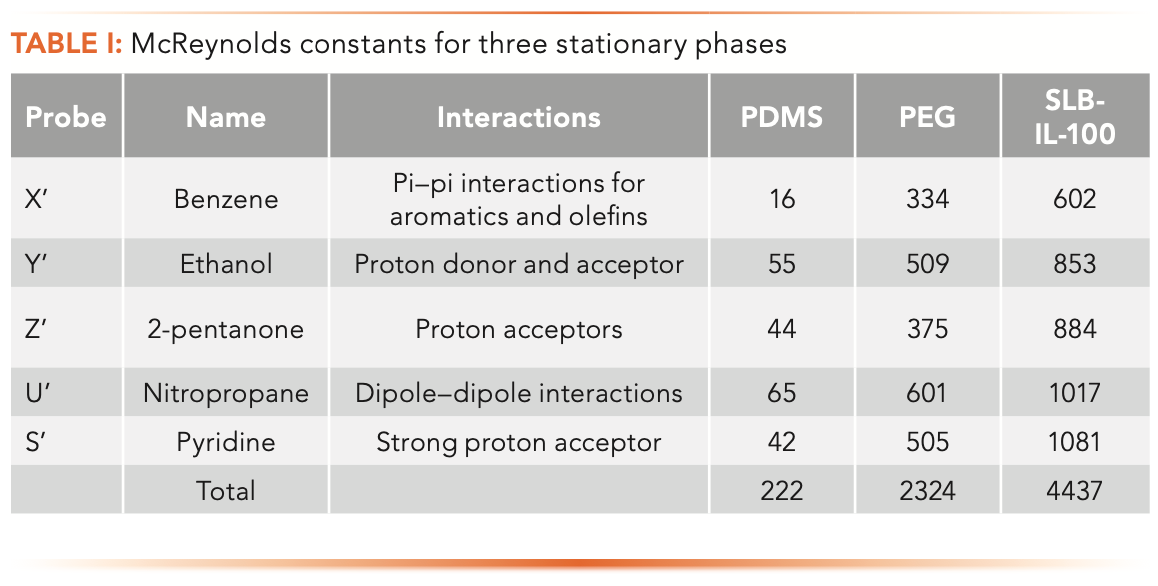
Table I shows McReynolds constants and the sum of the constants for the three stationary phases seen in Figure 1. The constants and the total are much higher for the PEG and ionic liquid stationary phases than for PDMS. Details on how the McReynolds constants are determined using Kovats retention indexes and how the sum of the McReynolds constants are used to determine polarity numbers are provided in a previous column (1).

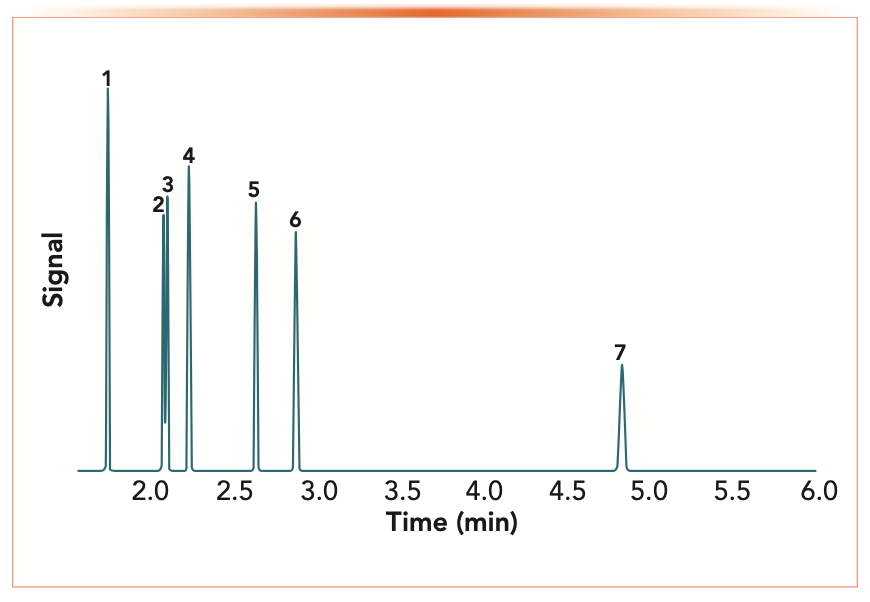
Kovats retention indexes and McReynolds constants are determined isothermally, so the temperature also has a major impact on the result and must be known. Figure 2 shows a chromatogram of four of the test probes used for determining McReynolds constants plus the necessary alkanes on a PDMS stationary phase, simulated using ProEZ GC online software (5). To calculate the McReynolds constant for an analyte, such as benzene (peak 2), in the chromatogram, the adjusted retention times of hexane (peak 1), benzene, and heptane (peak 5) must be known. The actual Kovats retention index for benzene in this chromatogram is 655, indicating that it is eluted about halfway between hexane (600) and heptane (700). The McReynolds constant for benzene would then be determined by subtracting the Kovats retention index for benzene on squalene from the Kovats retention index on PDMS.
FIGURE 2: Pro EZGC chromatogram modeler for McReynolds probes and alkanes on PDMS. Column: PDMS, 30.00 m, 0.25 mm i.d., 0.25 μm, carrier gas: helium, constant flow @ 2.03 mL/min, Average velocity: 41.37 cm/sec, outlet pressure: 14.70 psi, oven temperature: 40 °C. Sample: 1) hexane (C6), 2) benzene, 3) 1-butanol, 4) 2-pentanone, 5) heptane (C7), 6) pyridine, and 7) octane (C8).

Benzene is an aromatic hydrocarbon that undergoes both dispersive and pi–pi interactions. McReynolds constants are determined by the difference between the Kovats retention indexes measured on the stationary phase of interest and on a classical nonpolar stationary phase, squalene, which is the liver oil from sharks. One challenge when working with McReynolds constants today is the availability of columns made using squalene, which were popular in packed columns but not used in capillary columns. Our nonpolar stationary phase in this discussion, PDMS, is considered the most nonpolar stationary phase in GC today.
Looking more closely at the constants for benzene shown in Table I, we see that the constants are much higher for PEG and SLB- IL-100, implying that the more polar stationary phases should retain benzene much more strongly. However, this is not the case.
Table II shows the retention factors, McReynolds constants, Kovats retention indexes, and polarity numbers for benzene on the three stationary phases. The retention factors were determined at 60 °C. With the thin film columns used, we see that the retention factors are low, indicating that retention is not strong. We quickly make a couple of interesting observations. First, benzene is more strongly retained, as seen by the higher retention factor on PDMS, the least polar column than on SLB-IL-100. This observation may not be too surprising as PDMS primarily exhibits dispersion forces which are prevalent in benzene while SLB-IL-100 does not.

If benzene is less retained on SLB-IL-100, then why are the McReynolds constants so much higher? Looking at the Kovats retention index data in Table II, we see that the hydrocarbons that are used as standards in the calculation must shift to much lower retention factors themselves as the stationary phase becomes more polar, whereas the retention factor of benzene remains roughly the same or decreases. On PDMS, benzene is eluted between hexane and heptane. On PEG, it is eluted between nonane and decane. On SLB-IL-100, it is eluted after undecane. In short, the n-alkanes have shifted to a much shorter retention, but retention of the analyte remains approximately the same. If this is the case, is it appropriate to then state that the stationary phase is more polar, more retentive of the analyte, or has higher selectivity for similar analytes?
Does Polar Mean Retentive?
Does a high polarity, indicated either by large McReynolds constants or by a high polarity number, always indicate that a stationary phase will be retentive, giving long retention times? From the benzene example, a high polarity number or a high McReynolds constant does not always mean long retention times or high retention. Although the constants are a convenient and often illustrative example, we must consider how they are generated and whether the constants change because of a shift in retention of the analyte or of the n-alkane standards.
Does Polar Mean Selective?
Does a high polarity number or a high McReynolds constant mean that a column will also be highly selective? Because the polarity number scale is derived from a combination of several McReynolds constants, it is not useful in determining selectivity. It is just an overall measure of polarity, and because it considers several intermolecular interactions, it cannot be used to determine the effectiveness of the stationary phase to separate based on any one of them. A high McReynolds constant can be used as an indicator of selectivity for compounds that exhibit similar properties as the test probe, but this should be used with caution. If the high McReynolds constant results from a shift in alkane retention, rather than analyte retention, then the stationary phase might not exhibit the expected selectivity.
What About the Use of n-Alkanes?
The use of n-alkanes as standards in the Kovats retention index calculation and by extension for the McReynolds constants and the polarity scale presents an interesting problem. Alkane retention provides a measure of dispersive interactions which are major components of retention in both gas chromatography and reversed-phase (RP) high performance liquid chromatography (HPLC). Because n-alkanes themselves exhibit high dispersive interactions, using them as standards effectively subtracts dispersive interactions out of the discussion of retention.
Dispersive interactions, also called London dispersion forces, are by far the most seen intermolecular interaction in GC. We remember from undergraduate general chemistry that they occur in nonpolar molecules or in the nonpolar portion of larger or polar molecules. They occur because electron clouds are rarely evenly distributed around the molecule, generating momentary dipoles. This is especially evident in aliphatic hydrocarbons, which contain only nonpolar carbon–hydrogen bonds, arranged in a tetrahedral orientation. As the hydrocarbon chains get longer, dispersive interactions between molecules of the hydrocarbon increase, generating an increased boiling point. Similarly, increased dispersive interactions between analyte molecules and the stationary phase lead to longer retention times in GC.
Looking at n-alkanes with our three stationary phases, we easily see that n-alkanes will be most strongly retained on PDMS, followed by PEG and then by SLB-IL-100, because of the strongest dispersion forces being with PDMS, followed by PEG and very little dispersion force with SLB-IL-100. In the case of SLB- IL-100, the stationary phase repels alkanes so strongly that undecane, with a normal boiling point of 384 °C, has a retention factor of approximately 0.3, with 70% of the undecane molecules in the vapor phase at 60 °C, indicating very little retention.
What is the Solution?
The first solution to this problem is to consider the actual structure of the analytes and the expected intermolecular interactions qualitatively and carefully with the stationary phase, rather than simply looking at the McReynolds constant related to that interaction. Stronger retention can still be expected from stationary phases that exhibit similar intermolecular interactions, such as dispersion, pi–pi, or hydrogen bonding of the analytes. If a more rigorous analysis is needed, thermodynamic retention indexes, which are based on classical thermodynamics of separations and form the basis for chromatography modeling software, can be used, but these can also be tedious (5,6). To date, there is still no systematic way to fully predict separation power of a given stationary phase other than experimentation and classical method development.
Conclusions
Polarity and polar are common and easily misunderstood terms used to describe stationary phases in GC. When polar is used to describe a stationary phase or a solvent, the question, “Compared to what?” must be asked. PEG would be considered more polar compared to PDMS but less polar when compared to SLB-IL-100. The common measures of stationary phase polarity—McReynolds constants and the polarity scale—are not always accurate predictors of retentiveness or selectivity because of the use of n-alkanes as retention time standards. A truly systematic and easy-to-use means for predicting retentiveness and selectivity based on stationary phase chemistry remains elusive.
References
(1) Snow, N.H. Stationary Phase Selectivity: The Chemistry Behind the Separation. LCGC North Am. 2018, 36 (11), 806–811.
(2) Rohrschneider, L. Eine Methode zur Charakterisierung von Gas- chromatographischen Trennflüssigkeiten. J. Chromatogr. 1966, 22, 6–22.
(3) McReynolds, W.O. J. Chromatogr. Sci. 1970, 8, 685–691.
(4) Mondello L.; Ragonese C.; Sciarrone D.; et al. Evaluation of a medium-polarity ionic liquid stationary phase in the analysis of flavor and fragrance compounds Anal. Chem. 2011, 83, 7947– 7954.
(5) Restek Corporation, Pro EZGC Software. (Accessed December 2022). https://ez.restek.com/proezgc.
(6) Dose E. Simulation of Gas Chromatographic Retention and Peak Width Using Thermodynamic Retention Indexes. Anal. Chem. 1987, 59, 2414–2419.
ABOUT THE CO-AUTHOR
Hetal Rana graduated with a MS from the Department of Chemistry and Biochemistry at Seton Hall University in 2021. She holds a BS degree in Chemistry from Veer Narmad South Gujarat University in India. Direct correspondence to: hetalrana711@gmail.com

ABOUT THE AUTHOR
Nicholas H. Snow is the Founding Endowed Professor in the Department of Chemistry and Biochemistry at Seton Hall University, and an Adjunct Professor of Medical Science. During his 30 years as a chromatographer, he has published more than 70 refereed articles and book chapters and has given more than 200 presentations and short courses. He is interested in the fundamentals and applications of separation science, especially gas chromatography, sampling, and sample preparation for chemical analysis. His research group is very active, with ongoing projects using GC, GC–MS, two-dimensional GC, and extraction methods including headspace, liquid–liquid extraction, and solid-phase microextraction. Direct correspondence to: LCGCedit@mmhgroup.com


Detecting Hyper-Fast Chromatographic Peaks Using Ion Mobility Spectrometry
May 6th 2025Ion mobility spectrometers can detect trace compounds quickly, though they can face various issues with detecting certain peaks. University of Hannover scientists created a new system for resolving hyper-fast gas chromatography (GC) peaks.
Altering Capillary Gas Chromatography Systems Using Silicon Pneumatic Microvalves
May 5th 2025Many multi-column gas chromatography systems use two-position multi-port switching valves, which can suffer from delays in valve switching. Shimadzu researchers aimed to create a new sampling and switching module for these systems.
New Study Reviews Chromatography Methods for Flavonoid Analysis
April 21st 2025Flavonoids are widely used metabolites that carry out various functions in different industries, such as food and cosmetics. Detecting, separating, and quantifying them in fruit species can be a complicated process.

.png&w=3840&q=75)

.png&w=3840&q=75)


.png&w=3840&q=75)


.png&w=3840&q=75)


