Harmonization of Experimental Methods Used to Measure the True Hold-Up Volume of Liquid Chromatography Columns
There are as many measurement values of the true column hold-up volume, V0, as techniques applied to evaluate this most important property in liquid chromatography (LC). The relative errors made on V0 measurements using conventional “non-retained” markers—such as acetone, uracil, or thiourea in reversed-phase liquid chromatography (RPLC), or benzene or acenaphthene in hydrophilic interaction chromatography (HILIC)—can be as large as ±30%. This situation is extremely confusing for LC users who wish to classify and predict the retention behavior of LC columns. In this work, along with advances in mass spectrometry (MS) instrumentation, the hold-up volume of any LC column—including, but not limited to, RPLC, HILIC, ion exchange chromatography (IEX), and mixed-mode columns—is accurately measured by injecting labeled deuterated acetonitrile (CD3CN) molecules and detecting them selectively by MS-single ion reaction (m/z = 45) using non-labeled and pure acetonitrile (CH3CN) as the eluent. This proposed harmonization of all conventional V0 measurement methods is illustrated and successfully applied to RPLC, HILIC, anion exchange (AEX), and RP-AEX mixed-mode chromatography, irrespective of the mobile phase composition selected.
Knowledge of the column hold-up volume in liquid chromatography (LC) is often required by users to accurately measure retention factors, to compare the retentivity of various manufactured columns and classify them, to control and assess the quality of the retention and selectivity properties of such columns, and to predict the retention times of analytes in both isocratic and gradient elution conditions. However, since the very birth of LC, accurate measurement of the column hold-up volume in LC has always been a subject of debates and controversy (1–3). The main reason is that, unlike in gas chromatography (GC), the delimitation between the mobile-phase and stationary-phase volumes is always ambiguous in LC. This is especially true when the mobile phase used is a solvent mixture where one solvent may interact with the stationary phase differently from the other solvents. As a result, a thick interfacial region with a solvent composition different from that in the bulk mobile phase is formed between the impermeable solid surface and the bulk eluent (4,5). Thus, it has become impossible to unambiguously delimitate the mobile and stationary phases in LC.
Current and routine methods adopted for the measurement of the column holdup volume in LC abound. They have been reviewed extensively in the past (6–9); most are based on the measurement of the elution times of so-called “non-retained” markers—such as thiourea, uracil, or acetone for reversed-phase liquid chromatography (RPLC) columns; benzene for hydrophilic interaction chromatography (HILIC) columns, and small neutral markers in ion exchange chromatography (IEX). Some rely on the elution times of a series of homologous compounds (such as n-alkyl benzenes and phenones for RPLC columns) combined with an arbitrary linear free energy relationship (LFER) model of retention, while others are static methods, such as pycnometry, in which the column is weighed when filled with two distinct pure solvents having significantly different densities (for example, a methanol:dichloromethane pair). Some more tedious methods are based on minor disturbances of the solid–liquid equilibrium over the entire range of mobile phase composition for a binary eluent mixture. The minor disturbance method is somewhat cumbersome, because it relies on measurement of the wave speed of a non-labeled eluent perturbation for a series of equilibrium plateau concentrations ranging from pure water to pure organic solvent. A refractive index detector is usually needed, and, overall, this approach lacks simplicity. The adoption of non-retained markers is very convenient, but the measurement accuracy of the hold-up volume is often uncertain. In the end, each method carries its own advantages and downsides in terms of accuracy and precision, and there are as many observed hold-up volumes as methods used to measure this important column property. This situation can be very confusing for users because each method returns a V0 value that is different from that obtained from another method. The selection of the most accurate method is then always ambiguous. Thus, we need to harmonize these different V0 methods into a single method that accurately and precisely measures the unique hold-up volume of any chromatographic column, irrespective of its retention mode (RPLC, HILIC, SEC, ion exchange, mixed-mode, or other).
In this article, the problem faced by HPLC users when measuring the column hold-up volume is first clearly illustrated based on classical injections of assumed “non-retained” markers in RPLC and HILIC columns. A user-friendly, accurate, and precise method is then proposed to troubleshoot this problem based on the fundamentals of adsorption in solid-liquid adsorption and on recent advances in mass spectrometry (MS) detection. The method is directly applied for the determination of the hold-up column volume of RPLC, HILIC, IEX, and RP–anion exchange (AEX) mixed-mode columns. Finally, the relative errors made when the conventional use of “non-retained” markers are determined.
Materials and Methods
Eight different HPLC columns (including RPLC, HILIC, RP-AEX mixed mode, and AEX columns) were used in this work for the measurement of their hold-up volumes:
- Two RPLC-C18 columns: a 2.1 x 100 mm column packed with 1.7 μm XBridge-C18 particles (Waters) and a 4.6 x 150 mm packed with 5 μm Sunfire-C18 particles (Waters).
- Three HILIC columns: a 2.1 x 150 mm column packed with 3.0 Atlantis HILIC silica particles (Waters), a 2.1 x 150 mm column packed with Acquity Premier 1.7 μm BEH amide particles (Waters), and a 4.6 x 150 mm column packed with 5.0 μm BEH amide particles (Waters).
- Two RP-AEX mixed mode columns: a 4.6 x 150 mm column packed with 5 μm charged surface hybrid (CSH) C18 particles (Waters) and a 4.6 x 150 mm column packed with 5 μm Atlantis Premier BEH-C18 AX particles (Waters).
- One AEX column: a 4.6 x 150 mm column packed with 5 μm Spherisorb SAX particles (Waters).
The measurements of the column hold-up volumes were performed on an Acquity H-class UPLC system (Waters). This LC system is equipped with a quaternary solvent delivery pump, a gradient proportioning valve, a 15 μL injection loop, a sample manager, a one-column oven compartment, and either an optical detector (500 nL optical cell, TUV monochromatic) or a Xevo TQ-S micro tandem quadrupole mass spectrometer (Waters). After replacing the LC column with a zero-dead-volume union connector, the total extra-column volume (from the LC injection valve to the electrospray ionization source) was measured by injecting 1 μL of CD3CN and using pure acetonitrile as the eluent. Seven different flow rates increasing from 0.1 to 0.2, 0.4, 0.8, 1.0, 1.5, and 2.0 mL/min were applied. The y-intercept of the plot of the elution volume of CD3CN as a function of the flow rate gives a total extracolumn volume of 27.2 μL and an offset delay time of 0.7 s between the moment the injection valve actuates (slight delay) and the moment the zero-start of MS signal is recorded. For the selective detection of deuterated acetonitrile, the electrospray ionization voltage was set at 3 kV, the cone voltage at 10 V, the desolvation temperature was fixed at 500 oC, the flow rate of the desolvation gas was fixed at 1200 L/h, and the cone gas flow rate was set at 50 L/h. The whole system was automated by either Empower version 3.0 software (Waters) for optical detection or MassLynx v4.2 (Waters) for single ion reaction (CD3CN, m/z = 45) mass detection.
Water, acetonitrile, and acetone solvents were optima MS grade purchased from Fisher Scientific. Thiourea, uracil, benzene, deuterated acetonitrile (CD3CN), phosphoric acid, mono- and disodium phosphate salts, and ammonium acetate salt were purchased from Sigma-Aldrich with 99%+ purity.
All the mobile phases were prepared by weight. For the five 4.6-mm i.d. columns, the flow rate was 1.0 mL/min, and the column temperature was set at 30 oC. For the three 2.1-mm i.d. columns, the flow rate was 0.2 mL/min, and the column temperature was room temperature (24±1 oC). The markers thiourea, uracil, and acetone were dissolved in pure water. The markers benzene and acenaphthene were dissolved in pure acetonitrile or an acetonitrile:water mixture (75:25, v/v), respectively. The injection volume was fixed at 1 μL (2.1 mm i.d. columns) and 5 μL (4.6 mm i.d. columns).
All the details concerning the methods applied in the molecular dynamics simulations are provided in reference 5. Briefly, the mesopore model consists of a three-layer silica slab (0.93 nm thick) bearing silanol groups at a surface coverage of 7.5 μmol/m2. The silica surface is randomly grafted with octadecyl C18 (3.11 μmol/m2) and trimethyl silane (0.93 μmol/m2) groups. The validated force fields used to calculate the Brownian motions of all the atoms (Si, C, O, H, and N) involved in the equilibrium process are listed in reference (5). The reported density profiles were calculated from the atom number densities of the central C atom of acetonitrile and the center-of-mass of the analytes acetone and uracil.
Results
An Old Recurring Problem
RPLC
Figures 1–3 illustrate the old recurring problem faced by chromatographers when they select a hypothetically “non-retained” column dead time (t0) marker (either uracil in Figure 1, thiourea in Figure 2, or acetone in Figure 3) for the V0 measurement of the same RPLC column (a 2.1 x 150 mm 1.7 μm BEH-C18 column). These three figures show the retention and shape of the observed peak profiles of these three markers as a function of the mobile- phase composition. Acetonitrile is used as the organic solvent in the aqueous mobile phase. The volume fraction of the organic solvent in water is increased from 0 to 5, 10, 20, 30, 40, 50, 60, 70, 80, 90, 95, and 100%, as indicated in the legend of the graphs. For the sake of reference, the expected elution time (eventually measured with the accurate t0 method proposed in this work) of a truly non-retained marker is indicated by the vertical dashed line.
FIGURE 1 (LEFT): Evolution of the retention and peak shape of the assumed “non-retained” compound uracil in RPLC as a function of the volume fraction of acetonitrile increasing from 0 to 5, 10, 20, 30, 40, 50, 60, 70, 80, 90, 95, and 100% as indicated in the graph. The sample uracil is dissolved in pure water. Injection volume: 1 μL; flow rate: 0.2 mL/min; T = 24 °C; 2.1 x 100 mm 1.7 μm BEH-C18 column. The vertical dashed line locates the elution time of the ideal t0 marker.
FIGURE 2 (MIDDLE): Same as in Figure 1, except for the assumed “non-retained” compound thiourea.
FIGURE 3 (RIGHT): Same as in Figure 1, except for the assumed “non-retained” compound acetone.
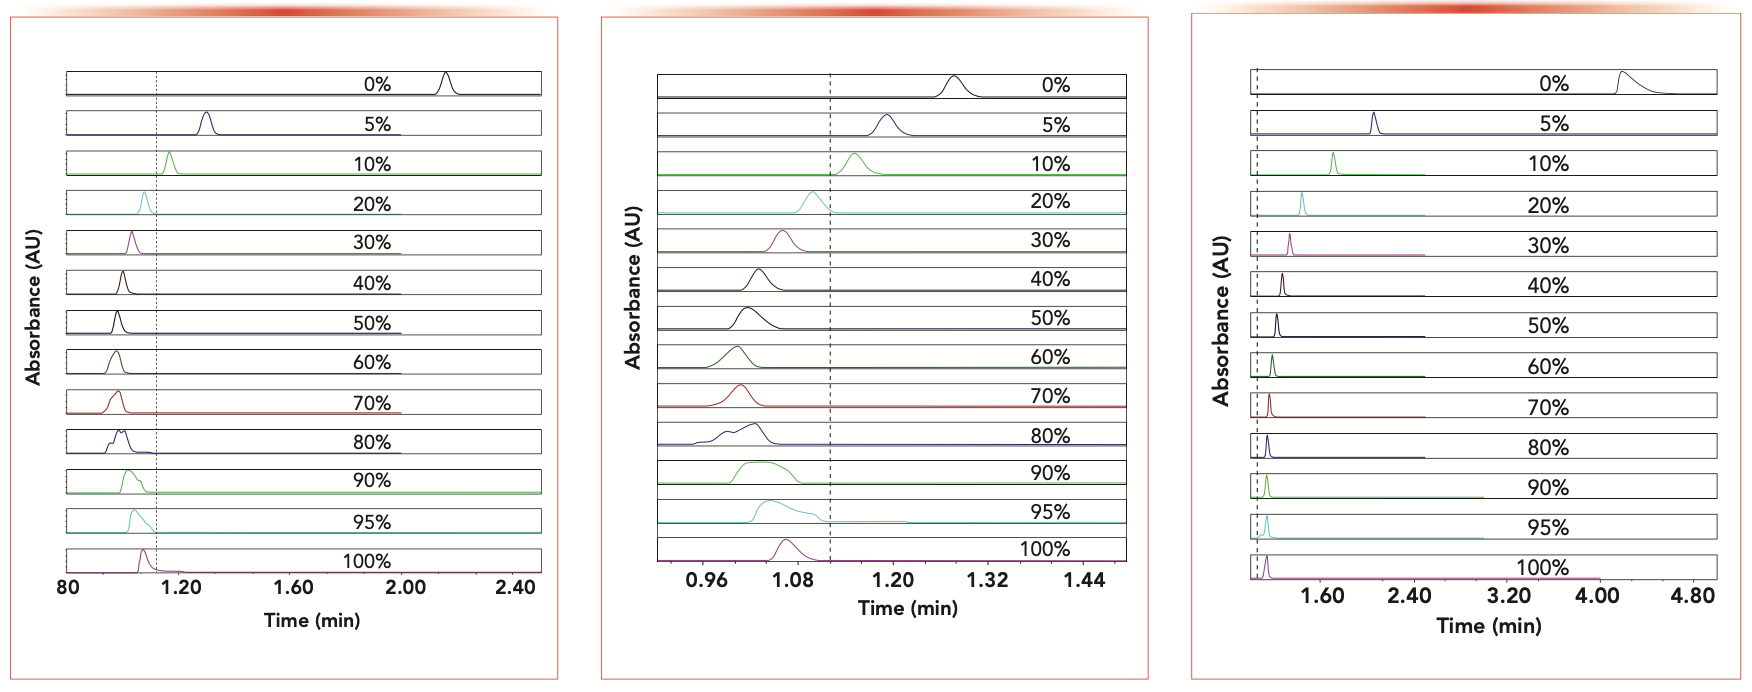
Remarkably, the retention times of these three conventional markers are strongly dependent on the mobile-phase composition. A U-shaped retention profile is clearly observed for both uracil and thiourea, suggesting the prevalence of RPLC-like interactions in water-rich mobile phases and of HILIC-like interactions in water-poor mobile phases (uracil and thiourea contains two HN-C=O and -NH2 polar groups, respectively). Additionally, because these markers are typically either slightly retained onto the silica-C18 stationary phase or slightly excluded from the organic-rich pore volume, their peak shape is inevitably affected by the eluent (0 to 100% organic)-to- diluent (100% water) composition mismatch when the volume fraction of the organic solvent in the mobile phase exceeds ~50%. As far as the marker acetone is concerned, its retention time decreases evenly with the increase in organic solvent, suggesting that mostly hydrophobic interactions are involved in the retention mechanism of this marker, irrespective of the mobile-phase composition. Similar observations (not shown) and conclusions have been reported in this work when the organic solvent acetonitrile is replaced with methanol.
In the end, the main problem arising from the observations in Figures 1–3 (three non-retained markers, 13 mobile phase compositions) is that chromatographers are left with no clue about how to decide for the true value of the hold-up volume of this particular RPLC column. Should chromatographers consider as true the smallest retention time of uracil or thiourea, which is 0.96 min for 80% acetonitrile in the aqueous eluent? Or should they arbitrarily select the smallest retention time (1.16 min) of acetone in 100% organic solvent? To date, there is no scientific rationale enabling chromatographers to prefer one such t0 marker over another for the accurate measurement of the hold-up volume of a RPLC column.
HILIC
Similar to Figures 1–3, Figure 4 shows the peak profiles of the hypothetically non-retained marker benzene to measure the hold-up volumes of the 2.1 x 150 mm 1.7 μm BEH-amide HILIC column. The volume fraction of acetonitrile in water increases from 5 to 10, 20, 30, 40, 50, 60, 70, 80, 90, 95, and 100%, as indicated in both graphs (pure water was not considered as an eluent because the retention time of the apolar compound benzene was too large, and its peak shape was severely distorted by excessively strong hydrophobic interactions). It is also remarkable that a U-shaped retention profile is clearly observed for benzene, its retention initially decreasing with the increasing volume fraction of acetonitrile from 5% to ~70% because RPLC-like hydrophobic interactions weaken as the organic content increases. As the acetonitrile content is further increased, the thickness and volume of the water-rich layer adsorbed onto the surface of the HILIC silica surface shrink. Therefore, benzene being quasi-insoluble (1.8 mg/mL) in water, it is less and less excluded from the internal pore volume, resulting in the slight increase of its retention times observed (10). The same observations (not shown) have been made in this work for a 2.1 x 150 mm 3.0 μm Atlantis HILIC column. Just as with RPLC markers, chromatographers can observe that the benzene t0 marker generates as many V0 values as the number of mobile-phase compositions applied experimentally. Should they consider the largest retention time of benzene in pure acetonitrile or its smallest retention time for the 70% volume fraction of acetonitrile in the eluent? Such a decision is impossible to make.
FIGURE 4: Evolution of the retention and peak shape of the assumed “non-retained” compound benzene in HILIC as a function of the volume fraction of acetonitrile in water increasing from 5 to 10, 20, 30, 40, 50, 60, 70, 80, 90, 95, and to 100%. The sample benzene is dissolved in pure acetonitrile. Injection volume: 1 μL; flow rate: 0.2 mL/min; T = 24 °C; 2.1 x 150 mm ACQUITY Premier 1.7 μm BEH amide column.
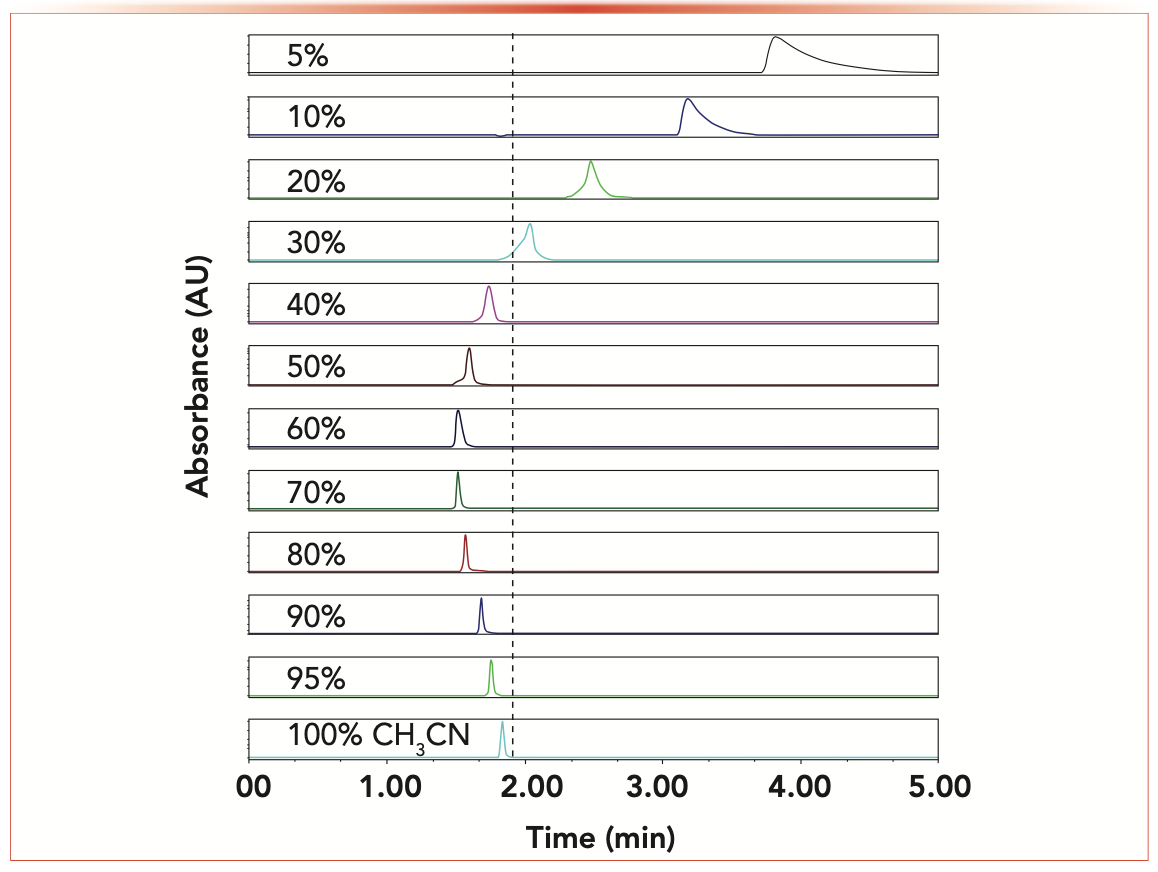
A clear answer is needed to solve this very general problem, which concerns not only RPLC and HILIC columns but also SEC, IEX, and RP-IEX mixed-mode LC columns. Below, the reasons why these markers are relatively poor t0 markers are explained in terms of chromatography fundamentals; molecular dynamics simulations are performed to visualize the expected equilibrium density distributions of these marker molecules in the pore volume from the pore surface to bulk eluent.
Fundamental Insight
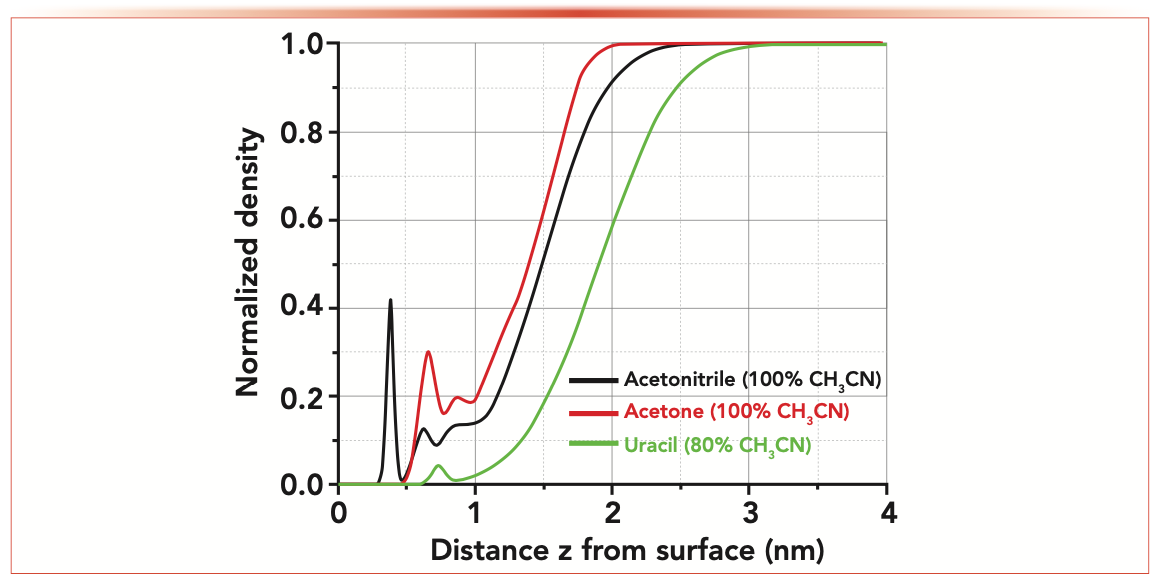
From a fundamental viewpoint, the solution to the problem pertaining to the accurate measurement of the column hold-up volume of a LC column is straightforward, and has been suggested since the early days of the LC technique (1,2,11–13). It consists of injecting and selectively detecting some solvent molecules while using the very same and pure solvent as the mobile phase. Therefore, if it exists, the ideal t0 marker should have either the very same density profile from the surface of the LC stationary phase to the bulk mobile phase as that of the solvent molecule, or a different density profile but with the same overall amount in the entire pore volume when concentrations are normalized to the bulk concentration. Figure 5 (online) illustrates this point and compares the calculated (by molecular dynamics simulation) density profiles of pure acetonitrile (the ideal V0 marker with itself as the eluent), infinitely diluted acetone in pure acetonitrile, and infinitely diluted uracil in a mixture of acetonitrile:water (80:20, v/v) across a silica-C18 mesopore. All three systems are in thermodynamic equilibrium at 27 oC with a conventional endcapped silica-C18 stationary phases (5). Clearly, none of the density profiles are closely similar to each other, and the three areas measured under these curves (that is, the overall amount of analyte present in the mesopore for the same bulk concentration) are also different. This reveals that the capacity factors and corresponding retention times of these three markers should be different, in complete agreement with the observations reported in Figures 1 (uracil marker) and 3 (acetone marker). Better, it is noteworthy that this area increases from uracil (0.81) to acetonitrile (reference area 1.00) and to acetone (1.05). In other words, the molecular dynamics calculations fully confirm that the acetone marker is still slightly retained onto endcapped silica-C18 stationary phases (even in pure acetonitrile used as the mobile phase), and the uracil marker is slightly excluded from the solid-to-liquid interfacial region of such adsorption systems. In conclusion, molecular dynamics simulations fully support the conclusion that neither acetone (in 100% acetonitrile) nor uracil (in an acetonitrile:water mixture, 80:20, v/v) can be considered as good “non-retained” markers in RPLC. The former marker leads to a slight overestimation of the column hold-up volume whereas the latter provides an underestimated value of this column property. Next, the solution to these inaccurate t0 determinations and a harmonization of all these only approximate t0 methods are proposed and tested experimentally for various LC columns characterized by different retention modes including RPLC, HILIC, RP-AEX, and AEX.
FIGURE 5: Plots of the calculated density profiles of pure acetonitrile marker in acetonitrile (the ideal V0 marker), infinitely diluted acetone marker in pure acetonitrile, and infinitely diluted uracil marker in a mixture of acetonitrile/water (80:20, v/v) as a function of the distance z from an endcapped silica-C18 surface. The density profiles are normalized to the bulk density. All the details regarding the molecular dynamics calculations are given in reference (5). The calculations eventually confirm that both acetone (slight retained) and uracil (excluded) are poor t0 markers in RPLC.
Harmonization of t0 Methods
The harmonization of all the abovementioned t0 methods is based on the injection of any solvent molecules and using the same solvent as the mobile phase. However, the injected solvent molecules, being indistinguishable from those of the mobile phase, should be labeled and selectively detected by relevant detectors such as refractive index or MS detectors. Because triple-quadrupole MS is now commonly used in tandem with LC in most laboratories around the world, the simplest approach consists of injecting pure deuterated acetonitrile (CD3CN), using pure acetonitrile (CH3CN) as the mobile phase, and of selectively detecting CD3CN from CH3CN molecules by standard triple-quadrupole MS detection at m/z = 45. It is then assumed that the isotopic effects (stronger adsorption strength and possibly higher degree of exclusion of CD3CN relative to CH3CN) are negligible. At least, they are kept to a strict minimum because the benzene-d6/1,3,5-benzene-d3 and 1,3,5-benzene-d3/benzene selectivity factors have been measured around 1.02 in RPLC (14–16). Therefore, it is assumed that the density profile of CD3CN matches nearly exactly that of CH3CN when in contact with silica-C18 adsorbents. This user-friendly method is applied next to the experimental determination of the true hold-up volume of 4.6 mm x 150 mm RPLC, HILIC, AEX, and RP-AEX mixed-mode columns.
RPLC
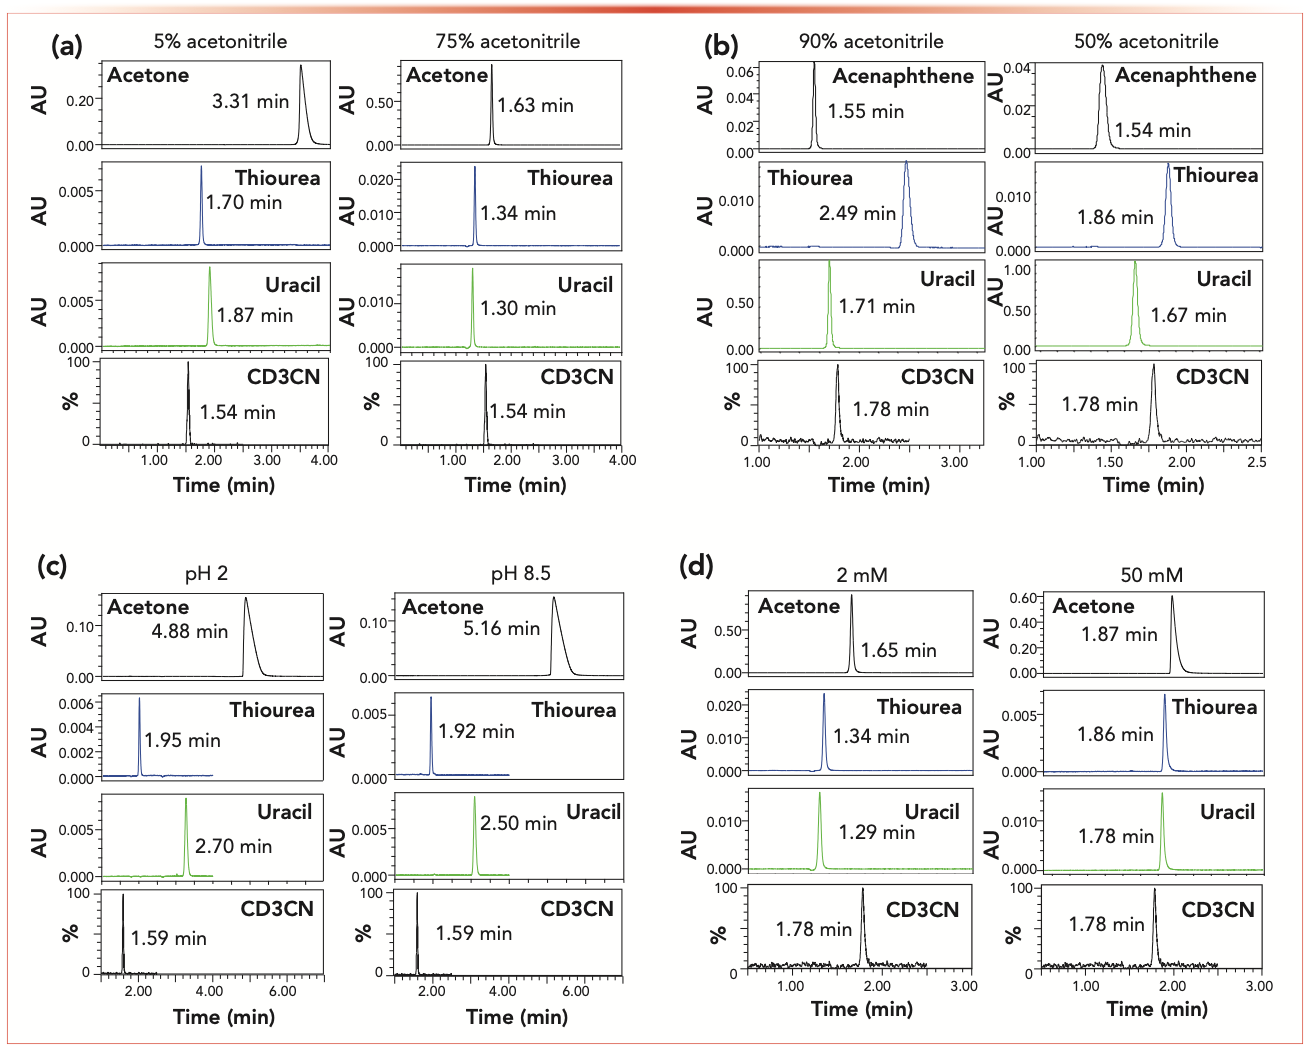
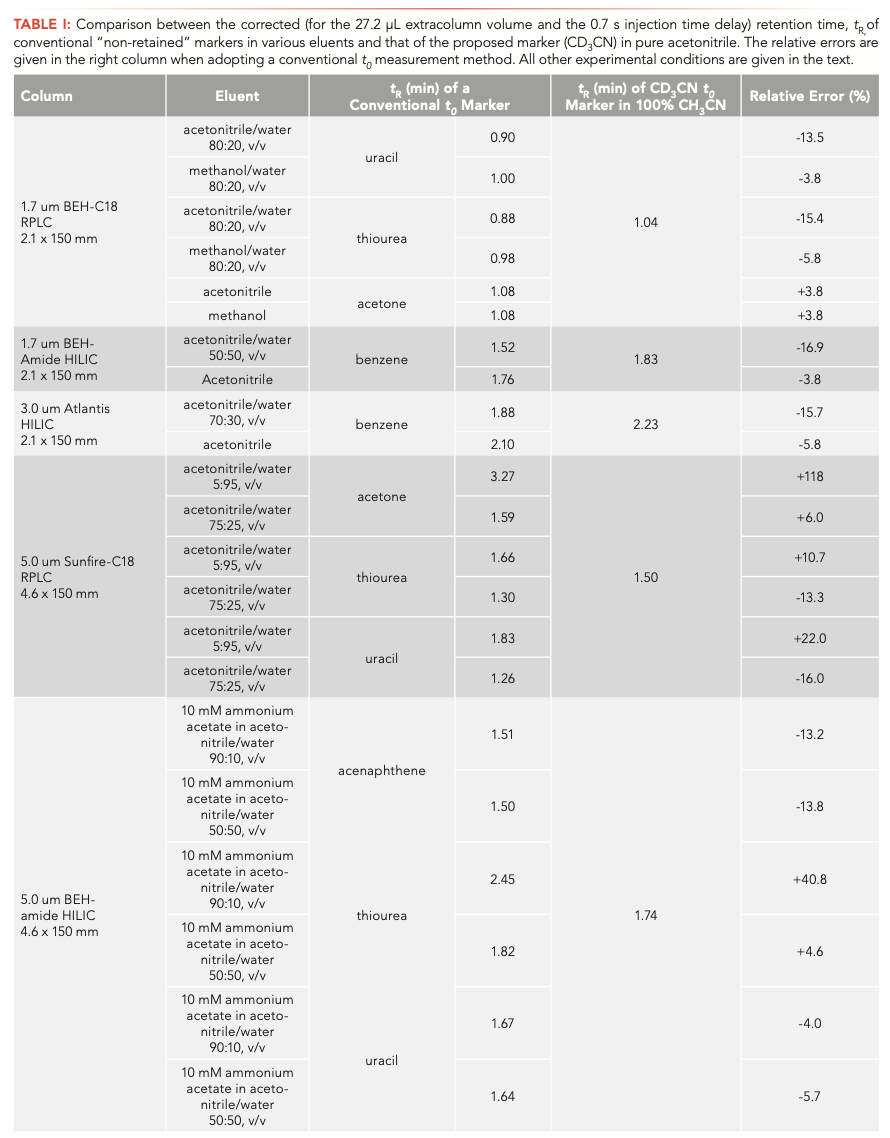
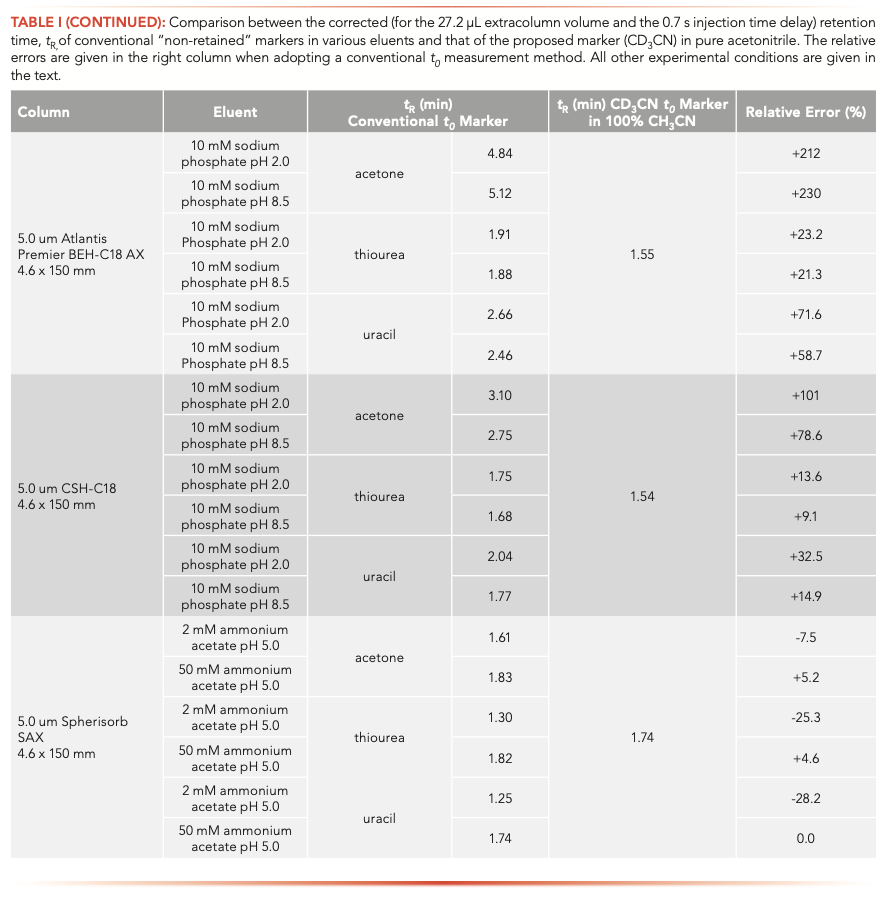
The true t0 value of the Sunfire-C18 column was measured from the injection and detection of CD3CN in pure acetonitrile. Figure 6a confirms that acetone is definitely retained onto the Sunfire-C18 column regardless of the solvent composition from water-rich (95% in volume) to acetonitrile-rich (75% in volume) eluents. Uracil and thiourea are retained and excluded when eluted with the same water-rich and acetonitrile-rich eluent, respectively. Table I summarizes the corresponding relative errors made (from –15% to >100%) when considering these conventional markers to estimate the column hold-up time t0 of the two RPLC columns used in this work.
FIGURE 6: (a) Comparison between the experimental elution times of CD3CN (in 100% CH3CN), acetone, thiourea, and of uracil t0 markers for two different mobile phases (water-rich and organic-rich eluent as indicated atop the chromatograms) measured on the 4.6 x 150 mm 5 μm Sunfire-C18 column in RPLC. (b) Comparison between the experimental elution times of CD3CN (in 100% CH3CN), acenaphthene, thiourea, and of uracil t0 markers for two different mobile phases (90:10 and 50:50, v/v, acetonitrile/water mixtures, 10 mM and ammonium acetate as indicated atop the chromatograms) measured on the 4.6 x 150 mm 5.0 μm BEH amide column in HILIC. (c) Comparison between the experimental elution times of CD3CN (in 100% CH3CN), acetone, thiourea, and of uracil t0 markers for two different mobile phases (10 mM sodium phosphate at pH 2.0 for a positively charged surface state and pH 8.5 for a neutral charge surface state as indicated atop the chromatograms) measured on the 4.6 x 150 mm 5 μm Atlantis Premier XBridge-C18 AX column in RP-AEX mixed-mode chromatography. (d) Comparison between the experimental elution times of CD3CN (in 100% CH3CN), acetone, thiourea, and of uracil t0 markers for two different mobile phases (2 mM and 50 mM ammonium acetate as indicated atop the chromatograms) measured on the 4.6 x 150 mm 5 μm Spherisorb SAX column in AEX.
HILIC
The true t0 value of the BEH-amide column was measured from the injection and detection of CD3CN in pure acetonitrile. Figure 6b shows that the elution times of acenaphthene eluted by two buffered (10 mM ammonium acetate) acetonitrile:water mixtures (50:50 and 90:10, v/v) are smaller than that of CD3CN in pure acetonitrile. The relative errors are about –17% and –6%, respectively (Table I). Similar to the benzene marker (Figure 4), acenaphthene can only provide an underestimated value of t0 for HILIC columns. Thiourea should be avoided as a HILIC column hold-up marker because of its significant retention in acetonitrile-rich mobile phase. Interestingly, despite its polar nature, uracil is even excluded from the pore volume because of its poor solubility in acetonitrile-rich eluents. All the relative errors made on the true t0 value of the three HILIC columns used in this work are summarized in Table I.
RP-AEX Mixed Mode
The true t0 value of the Atlantis Premier BEH-C18 AX column was determined by the injection of CD3CN in pure acetonitrile as shown in Figure 6c. RP-AEX columns are often used in pure water to promote retention of the most polar and charged (acids) analytes during the early stages of the gradient. Due to intense RPLC-like interactions in pure water, the acetone marker is strongly retained, and is not even a decent t0 marker in RP-AEX. The same conclusion, but to a lesser extent, is true for thiourea and uracil markers, which are both retained on these mixed-mode columns. The need for the harmonization of t0 methods is especially needed in mixed-mode chroma- tography, because several dominant interactions coexist and it is extremely challenging to find a priori a good and trustworthy t0 marker for such columns. The relative errors made by the users when conventional marker methods are adopted are listed in Table I.
AEX
IEX columns are essentially used in pure water with variable contents of added salts. After measuring the true t0 value of the Spherisorb SAX column, Figure 6d shows the chromatograms recorded after injections of the neutral markers acetone, uracil, and thiourea at low (2 mM) and high (50 mM) ammonium acetate concentration in the aqueous mobile phase. Interestingly, uracil appears as an excellent t0 marker, while both thiourea and acetone are slightly retained onto the Spherisorb and do not deliver accurate enough t0 values for the Spherisorb SAX column. The relative errors when injecting these three usual markers are listed in Table I.
Conclusion
This work first demonstrates that there is no obvious and ideal t0 marker that can always be injected in the mobile phase selected by the user and detected optically. This is true for all retention modes in liquid chromatography including those most commonly used, such as RPLC, HILIC, mixed-mode, and IEX. There are as many t0 values measured for a given column as methods used to measure t0. As advocated by the pioneers of fundamental LC, the most accurate method consists of injecting labeled solvent molecules in the same but non-labeled solvent and selectively detect the labeled molecules. Deuterated acetonitrile is an excellent solvent candidate that can be easily obtained from chemical suppliers and detected by conventional triple quadrupole MS at m/z = 45. This method enables users to be aware of the somewhat large relative errors made in the evaluation of the hold-up time t0 of LC columns when conventional and assumed “non-retained” t0 markers are considered.
Secondly, the impact of this universal t0 method on fields of LC application is undeniably important: Harmonization of conventional t0 methods and accurate determination of the unique hold-up time t0 of LC columns will make it possible to precisely classify and compare column retentivity and selectivity across analytical laboratories worldwide, regardless of the experimental conditions applied (column chemistry, mobile-phase composition, temperature, ionic strength, and pH).
Finally, it is important to keep in mind that the claimed accuracy of this CD3CN injection method relies on the assumption that the CD3CN/CH3CN isotopic effect is actually negligible. The extent to which this assumption can hold has yet to be determined by molecular dynamics; that work can be done once the force field of the deuterium atom in various adsorption systems (such as RPLC and HILIC) is known.
References
(1) Riedo F.; Kovats, E.; Adsorption from liquid mixtures and liquid chromatography. J. Chromatogr. A 1982, 239, 1–28. DOI: 10.1016/S0021- 9673(00)81964-0
(2) Knox J.; Kaliszan, R. Theory of solvent disturbance peaks and experimentaldetermination of thermodynamic dead-volume in column liquid chromatography. J. Chromatogr. A 1985, 349, 211–234. DOI: 10.1016/S0021- 9673(01)83779-1
(3) Alhedai, A.; Martire, D.; Scott, R.; Column “dead volume” in liquid chromatography. Analyst 1989, 14, 869–875. DOI: 10.1039/AN9891400869
(4) Lindsey, R.; Rafferty, J.; Eggimann, B.; Siepmann, J.; Schure, M.; Molecular simulation studies of reversed-phase liquid chromatography. J. Chromatogr. A 2013, 1287, 60–82. DOI: 10.1016/j.chroma.2013.02.040
(5) Trebel, N.; Holtzel, A.; Steinhoff, A.; Tallarek, U.; Insights from molecular simulations about dead time markers in reversed-phase liquid chromatography. J. Chromatogr. A 2021, 1640, 461958. DOI: 10.1016/j.chroma.2021.461958
(6) Smith, R.; Nieass, C.; Wainwright, M.; A review of methods for the determination of hold-up volume in modern liquid chromatography. J. Liq. Chromatogr. 1986, 9, 1387–1430. DOI: 10.1080/01483918608076694
(7) Rimmer, C.; Simmons, C.; Dorsey, J.; The measurement and meaning of void volumes in reversed-phase liquid chromatography. J. Chromatogr. A 2002, 965, 219–232. DOI: 10.1016/s0021-9673(02)00730-6.
(8) Gritti, F.; Kazakevich, Y.; Guiochon, G.; Measurement of hold-up volumes in reverse-phase liquid chromatography: Definition and comparison between static and dynamic methods. J. Chromatogr. A 2007, 1161, 157–169. DOI: 10.1016/j.chroma.2007.05.102
(9) Gritti, F.; Perspective on the future approaches to predict retention in liquid chromatography. Anal. Chem. 2021, 93, 5653–5664. DOI: 10.1021/acs.analchem.0c05078
(10) McCalley D.; Neue, U.; Estimation of the extent of the water-rich layer associated with the silica surface in hydrophilic interaction chromatography. J. Chromatogr. A 2008, 1192, 225–229. DOI: 10.1016/j.chroma.2008.03.049
(11) Kazakevich Y.; McNair, H.; Thermodynamic definition of HPLC dead volume. J. Chromatogr. Sci. 1993, 31, 317–322. DOI: 10.1093/chromsci/31.8.317
(12) Kazakevich, Y.; High-performance liquid chromatography retention mechanisms and their mathematical descriptions. J. Chromatogr. A 2006, 1126, 232–243. DOI: 10.1016/j.chroma.2006.05.022
(13) McCormick R.; Karger, B.; Distribution phenomena of mobile-phase components and determination of dead volume in reversed-phase liquid chromatography. Anal. Chem. 1980, 52, 2249–2257. DOI: 10.1021/ac50064a005
(14) F. Gritti, F.; Besner, S.; Cormier, S.; Gilar, M.; Applications of high-resolution recycling liquid chromatography: From small to large molecules; J. Chromatogr. A 2017, 524, 108–120. DOI: 10.1016/j.chroma.2017.09.054
(15) Gritti F.; Cormier, S.; Performance optimization of ultra high-resolution recycling liquid chromatography. J. Chromatogr. A 2018, 1532, 74–88. DOI: 10.1016/j.chroma.2017.11.047
(16) Tanaka, N.; Hosoya, K.; Kubo, T.; Hirose, T.; Fukusaki, E.; Yoshikawa, K.; Kimata; Otsuka, K.; Kanao, E.; Recycle reversed-phase liquid chromatography (LC) to achieve separations based on one H/D substitution on aromatic Hydrocarbons. LCGC N. Am. 2019, 37(6s), 18–23.
Fabrice Gritti and Kerri Smith are with Waters Corporation, in Milford, Massachusetts. Direct correspondence to: Fabrice_Gritti@waters.com
Click here to access an individual PDF of this article.
Polysorbate Quantification and Degradation Analysis via LC and Charged Aerosol Detection
April 9th 2025Scientists from ThermoFisher Scientific published a review article in the Journal of Chromatography A that provided an overview of HPLC analysis using charged aerosol detection can help with polysorbate quantification.
Removing Double-Stranded RNA Impurities Using Chromatography
April 8th 2025Researchers from Agency for Science, Technology and Research in Singapore recently published a review article exploring how chromatography can be used to remove double-stranded RNA impurities during mRNA therapeutics production.


