Determination of Phenylurea in Tap Water and Soft Drink Samples by HPLC–UV and Solid-Phase Extraction
LCGC Asia Pacific
A simple and sensitive high performance liquid chromatography (HPLC) method with ultra-violet (UV) detection has been developed for the analysis of phenylurea herbicides.
A simple and sensitive high performance liquid chromatography (HPLC) method with ultra-violet (UV) detection has been developed for the analysis of phenylurea herbicides — namely, monuron, diuron, linuron, metazachlor and metoxuron — that involves a preconcentration step using solid-phase extraction (SPE). The mobile phase used was acetonitrile–water at a flow-rate of 1 mL/min with direct UV absorbance detection at 210 nm. Separation of analytes was studied on a C18 column. The method was applied successfully to the analysis of the herbicides in three soft drink brands and tap water. Good linearity and repeatability were observed for all the pesticides studied.
Phenylurea herbicides are used widely in a broad range of herbicide formulations as well as for nonagricultural use. Consequently, their residues are frequently detected as major water contaminants in areas where these are used extensively (1). Diuron and linuron are substituted urea compounds that are soluble in water and can migrate in soil and enter the food chain (2). These herbicides are of significant toxicological risk to humans and wildlife. Diuron, which is used in cotton-growing areas and with fruit crops, is rated as the third most hazardous pesticide for groundwater resources. These herbicides are also applied on railway tracks to maintain quality and provide a safer working environment (3) but this may lead to groundwater contamination as their leaching potential is significant. Phenylureas enter the environment through pathways such as spray drift, runoff from treated fields and leaching into groundwater. Most of the excess material penetrates into the soil where it is subjected to the action of microorganisms (4) and degradation as studied by Canonica and colleagues (5). Phenylureas are unstable photochemically, as discussed by Khodja and colleagues (6) but these can persist in water for several days or weeks depending on the temperature and pH. Cases of incidental pesticide pollution of water reservoirs (2–4,7–13) have become more numerous in recent years.
Phenylurea residues can be found in water sources, processed products and on the crops where these are applied. In India, most of the soft drink bottling plants use surface water from canals and rivers, which have a high risk of pesticide contamination. The water treatment measures used are insufficient for complete removal of these pesticide residues, which have been found to be above permissible limits. The evidence for the above stated facts was provided in a 2003 Centre for Science and Environment (CSE, New Delhi, India) report that found several pesticide residues in many soft drink samples of leading international brands procured from all over India. The CSE findings were confirmed further by a Joint Parliamentary Committee (JPC) created to verify the facts. In 2006, CSE conducted another round of tests and found pesticides yet again in soft drink samples. Keeping this in mind, the present work has great importance, as it involves the determination of phenyl urea herbicides in soft drink samples and tap water.
Therefore, it is imperative that sensitive, selective and efficient methods for herbicide analysis be designed. The common analytical methods used are high performance liquid chromatography (HPLC)–UV (2–4,7–9), solid-phase microextraction (SPME)–HPLC (10), diode array (11), immunosorbent trace enrichment and HPLC (12,14), LC–mass spectrometry (MS) (15,16), gas chromatography (GC)–MS (13), capillary electrophoresis (17,18,19), photochemically induced fluorescence (20,21) and derivative spectrophotometry (22). A useful review is presented by Sherma (23) on the use of thin-layer chromatography (TLC) and its modified versions for the analysis of these herbicides. Solid-phase extraction (SPE) of phenylurea herbicides has been reported in literature by several workers (24–29). The SPE of soft drinks has been reported extensively (30–36). As the use of polar and degradable pesticides becomes widespread, it is urgent that more sensitive analytical methods be developed for their residual analysis in various matrices. HPLC has several advantages over GC because it can be used for simultaneous analysis of thermally unstable, nonvolatile, polar and neutral species without a derivative step. Because of the thermally unstable nature of phenylurea herbicides, the direct application of GC to these compounds is not possible and derivatization prior to the detection is needed. For this reason, HPLC with UV absorption or fluorescence detection (7–10) is preferred over GC. As a result, HPLC is gaining popularity and preference as a pesticide analysing technique.
The present work describes a simple and sensitive HPLC–UV method for the analysis of phenyl urea herbicides (namely, monuron, diuron, linuron, metazachlor and metoxuron) and it involves a single-step preconcentration by SPE.
Materials and Methods
The HPLC system used included a P680 HPLC pump (Thermo Scientific Dionex, Sunnyvale, California, USA), a 250 mm × 4.6 mm, 5-μm Acclaim C18 RP analytical column (Thermo Scientific Dionex) and a UVD 170U detector operated at a wavelength of 210 nm coupled to a Chromeleon computer program for the acquisition of data (Thermo Scientific Dionex).
Monuron, diuron, linuron, metoxuron and metazachlor (Figure 1) pesticide standards were obtained from Riedel-de-Haen (Seelze, Germany). HPLC-grade acetonitrile and methanol were obtained from J.T. Baker (Phillipsburg, New Jersey, USA). All the solvents were filtered through nylon 6.6 membrane filters (Rankem, New Delhi, India) using a filtration assembly (Perfit, India) and sonicated before use. Triple-distilled water was used for all purposes.
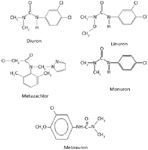
Figure 1: Structures of phenylurea herbicides.
Standard Preparation
Stock solutions were prepared in a mixture of 50:50 methanol–water. All the solutions were stored under refrigeration below 4 °C.
Sample Preparation
The SPE of the tap water and soft drink samples was performed using a Visiprep SPE vacuum manifold (Supelco, Bellefonte, Pennsylvania, USA) and C18 cartridges from J.T. Baker. The SPE cartridges were attached to the solvent-recovery assembly and connected to a vacuum pump. The conditioning was done with 1 mL each of acetonitrile, methanol and triple-distilled water.
Soft drink samples: The presence of phenylurea herbicides was studied in three different types of locally purchased soft drinks (Coke, Mirinda and Limca). These were filtered with nylon 6.6 membrane filters and degassed by sonicating for 30 min. The samples were spiked with the metoxuron, monuron, diuron, metazachlor and linuron at a concentration of 5 ng/mL. A 20 mL volume of these samples was passed through the C18 SPE cartridges under vacuum and the analytes were eluted with 1.5 mL of acetonitrile. The eluants were further used for the HPLC–UV analysis. The sample blanks were also prepared similarly.
Tap water sample: The tap water sample was taken from the laboratory. It was filtered and then degassed with an ultrasonic bath. The sample was spiked with metoxuron, monuron, diuron, metazachlor and linuron at a concentration of 5 ng/mL each. A 50 mL sample of the tap water containing the mixture of herbicides was preconcentrated using C18 SPE cartridges. A 1.5 mL volume of acetonitrile was used for the elution and the eluant was subjected to HPLC–UV analysis. The sample blanks were prepared by the same method.
Procedure
Aliquots of the mixture of five herbicides were taken, having concentrations of 5–500 ppb. These mixtures were analysed at an optimum wavelength of 210 nm. The mobile phase is an important factor in HPLC analysis, as it interacts with solute species of the sample. Hence, the composition of the mobile phase was selected carefully as 60:40 acetonitrile–water, and the flow-rate was set at 1 mL/min. All measurements were taken at ambient temperature. The calibration curves for all five herbicides were prepared and the curves were linear in the range studied.
Results and Discussion
HPLC–UV studies: The separation of these herbicides was studied using direct injection of samples and parameters such as the effect of flow-rate, selection of suitable wavelength and composition of mobile phase were optimized. The composition of the mobile phase was 60:40 acetonitrile–water. At higher flow-rates than 1.0 mL/min, the separations were not up to the baseline, and with lower flow-rates, peak tailing was observed, so the flow-rate was optimized to 1.0 mL/min. The wavelength for detection was selected from the UV absorption spectra of the five herbicides as 210 nm.

Table 1: Analytical figures of merit obtained under optimum conditions.
Preparation of calibration curves: The calibration curves were constructed for the detection of monuron, linuron, diuron, metoxuron and metazachlor in the range of 5–500 ppb under the optimized conditions using the HPLC with UV detection. The calibration curves were linear over this range. Various characteristics of HPLC–UV, including regression equation, working range and RSD, are summarized in Table 1. The LODs of the phenylurea herbicides were calculated using 3.3 × S/m (S = standard deviation, m = slope of calibration curve), and they were found to be in the range 0.82–1.29 ng/mL. Characteristic chromatograms with HPLC–UV detection at 210 nm are shown in Figures 2 and 3 for the separation of these herbicides.
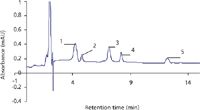
Figure 2: HPLCâUV chromatogram of mixture containing 5 ppb each of the phenylurea herbicides: 1 = metoxuron, 2 = monuron, 3 = diuron, 4 = metazachlor and 5 = linuron.
Recoveries, repeatability and LODs: The method detection limits were calculated for these herbicides per the ICH Harmonized Tripartite Guidelines (www.ich.org/LOB/media/MEDIA417.pdf). The method LOQs can be calculated by using 10 × S/m. The accuracy (% recovery) and precision (%RSD) of the HPLC–UV method were evaluated for each analyte by analysing a standard of known concentration (5 ng/mL) five times and quantifying it using the calibration curves. Method optimization and validation parameters are presented in Tables 1 and 2. Good linearity and repeatability were observed for all the compounds studied (with correlation coefficient > 0.99). The method gives satisfactory results when used to quantify these herbicides in soft drink and tap water samples (Table 2) with percentage recoveries ranging from 75% to 90.1%.
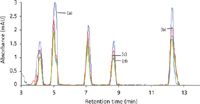
Figure 3: HPLCâUV chromatograms of (a) tap water, (b) Coke, (c) Limca and (d) Mirinda spiked with a mixture of phenylurea herbicides containing 5 ppb of each, obtained after preconcentration by SPE.
Applications
The phenylurea herbicides were studied in various soft drink and tap water samples and no interfering peaks appeared at the retention times of these herbicides in the spiked samples. The tap water, Coke, Mirinda and Limca (Figure 3) samples were spiked with metoxuron, monuron, diuron, metazachlor and linuron at a concentration of 5 ng/mL. The analytical validation for the simultaneous quantification of metoxuron, monuron, diuron, metazachlor and linuron has been performed with good recovery. The recoveries obtained are very good in all cases. Thus, this method can be used to detect the presence of these harmful herbicides in the soft drink and water samples.
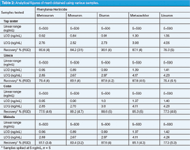
Table 2: Analytical figures of merit obtained using various samples.
Conclusions
The objective of the current study is to develop a simple, isocratic, reproducible, specific and highly sensitive method for quantitative and qualitative determination of phenylurea herbicides. In the present method the analysis time is 13 min (linuron tR 12.4 min), which is rapid in comparison to some of the other reported methods, such as Patsias and colleagues (37) (linuron tR = 18.88 min.), Gerecke and colleagues (38) (linuron tR = 17.58 min) and Mughari and colleagues (39) (linuron tR = 15 min). The proposed method can determine phenylurea herbicides at very low concentrations. The present paper describes the application of HPLC to the separation and quantitative determination of five phenylurea herbicides, and the feasibility of the method developed was tested by simultaneous determination of these herbicides in different brands of soft drinks and in tap water samples. Good linearity and repeatability were observed for all the compounds studied (with correlation coefficient > 0.99). It is hoped that the results of the present study contribute to increased scientific knowledge in the field of pesticide residue analysis in various food and environmental samples.
Manpreet Kaur, Ashok Kumar Malik and Baldev Singh are with the Department of Chemistry, Punjabi University, Punjab, India.
References
(1) S.R. Sorensen, C.N. Albers and J. Aamand, Appl. Environ. Microbiol., 74, 2332–2340 (2008).
(2) G.M.F Pinto and I.C.S.F. Jardim, J. Liq. Chrom. and Rel. Technol., 23, 1353–1363 (2000).
(3) H. Cederlund, E. Börjesson, K. Önneby and J. Stenström, Soil Biology and Biochemistry, 39, 473–484 (2007).
(4) E. Van-der-Heeft, E. Dijkman, R.A. Baumann and E.A. Hogendorn, J. Chromatogr. A, 879, 39–50 (2000).
(5) S. Canonica and H.U. Laubscher, Photochem. Photobiol. Sci., 7, 547–551 (2008).
(6) A.A. Khodja, B. Laverdine, C. Richard and T. Sehili, Int. J. Photoenergy, 4, 147–151 (2002).
(7) L.E. Sojo, D.S. Gamble and D.W. Gutzman, J. Agric. Food Chem., 45, 3634–3641 (1997).
(8) J. F. Lawerence, C. Menard, M.C. Hennion, V. Pichon, F. LeGoffic and N. Durand, J. Chromatogr. A, 732, 147–154 (1996).
(9) Organonitrogen pesticides Method: 5601, NIOSH manual of analytical methods, 1–21 (1998).
(10) H. Berrada, G. Font and J.C. Molto, J.Chromatogr. A, 1042, 9–14 (2004).
(11) R. Jeannot, H. Sabik and E. Genin, J. Chromatogr. A, 879, 55–71 (2000).
(12) S. Herrera, A. Martin Esteban, P. Fernandez, D. Stevenson and C. Camara Fresinius, J. Anal. Chem., 362, 547–551 (1998).
(13) Fast multi-residue pesticide analysis in soil and vegetable samples, application note, mass spectrometry, www.appliedbiosystems.com.
(14) A. Martin-Esteban, P. Fernandez, D. Stevenson and C. Camara, Analyst, 122, 1113–1117 (1997).
(15) I. Ferrer and D. Barcelo, Analusis Magazine, 26, 118–122 (1998).
(16) T. Yarita, K. Sugino, T. Ihara and A. Nomura, Analytical Communications, 35, 91–92 (1998).
(17) M.S. Barroso, L.N. Konda and G. Morovjan, J. High Resol. Chromatogr., 22, 171–176 (1999).
(18) S. Batista, E. Silva, S. Galhardo, P. Viana and M.J. Cerejeira, Int. J. Env. Anal. Chem., 82, 601–609 (2002).
(19) M. Chicharro, E. Bermejo, A. Sanchez, A. Zapardiel, A. Fernandez-Gutierrez and D. Arraez, Anal. Bioanal. Chem., 382, 519–526 (2005).
(20) A. Bautista, J.J. Aaron, M.C. Mahedero and A. Munoz de La Pena, Analusis, 27, 857–863 (1999).
(21) M.D. Gil-García, M. Martinez-Galera, P. Parrilla-Vázquez, A.R. Mughari and I.M. Ortiz-Rodríguez, Journal of Fluorescence, 18, 365–373 (2008).
(22) I. Baranowiska and C. Pieszko, Anal. Letters, 35, 413–486 (2002).
(23) J. Sherma, Acta. Chromatographia, 15, 5–30 (2005).
(24) M.M.C. de la Peña and A. Bautista-Sánchez, Talanta, 13, 279–285 (2003).
(25) I. Ferrer, V. Pichon, M.C. Hennion and D. Barceló, Journal of Chromatography A, 1, 91–98 (1997).
(26) F. Li, D. Martens and A. Kettrup, Se Pu, 19, 534–537 (2001).
(27) T. Cserhati, E. Forgács, Z. Deyl, I. Miksik and A. Eckhardt, Biomedical Chromatography, 18, 350–359 (2004).
(28) M.J.I. Mattina, Journal of Chromatography A, 549, 237–245 (1991).
(29) M. Hamada and R. Wintersteiger, Journal of Planar Chromatography-Modern TLC, 15, 11–18 (2002).
(30) J.F. García-Reyes, B. Gilbert-López and A. Molina-Díaz, Anal. Chem., 30, 8966–8974 (2002).
(31) M.A. Mumin, K.F. Akhter and M.Z. Abedin, Malaysian Journal of Chemistry, 8, 45–51 (2008).
(32) X.L. Cao, J. Corriveau and S. Popovic, J. Agric. Food Chem., 57, 1307–1311 (2009).
(33) Z. Pan, L. Wang, W. Mo, C. Wang, W. Hu and J. Zhang, Anal. Chim. Acta., 545, 218–223 (2005).
(34) R. Lucena, S. Cardenas, M. Gallego and M. Valcarcel, Anal. Chim. Acta., 530, 283–289 (2005).
(35) E. Papadopoulou-Mourkidou, J. Patsias, E. Papadakis and A. Koukourikou, Fresenius J. Anal. Chem., 371, 491–496 (2001).
(36) N. Yoshioka and K. Ichihashi, Talanta, 74, 1408–1413 (2008).
(37) J. Patsias and E. Papadopoulou-Mourkidou, JAOAC International, 82, 968–981 (1999).
(38) A. C. Gerecke, C. Tixier, T. Bartels, R.P. Schwarzenbach and S.R. Müller, J. Chromatography A., 930, 9–19 (2001).
(39) A.R. Mughari, P. Parrilla Vázquez and M. M. Galera, Anal. Chimica Acta., 593, 157–163 (2007).

Extracting Estrogenic Hormones Using Rotating Disk and Modified Clays
April 14th 2025University of Caldas and University of Chile researchers extracted estrogenic hormones from wastewater samples using rotating disk sorption extraction. After extraction, the concentrated analytes were measured using liquid chromatography coupled with photodiode array detection (HPLC-PDA).
Polysorbate Quantification and Degradation Analysis via LC and Charged Aerosol Detection
April 9th 2025Scientists from ThermoFisher Scientific published a review article in the Journal of Chromatography A that provided an overview of HPLC analysis using charged aerosol detection can help with polysorbate quantification.
Removing Double-Stranded RNA Impurities Using Chromatography
April 8th 2025Researchers from Agency for Science, Technology and Research in Singapore recently published a review article exploring how chromatography can be used to remove double-stranded RNA impurities during mRNA therapeutics production.


