Characterization of PLGA Using SEC–MALS-VIS
LCGC Asia Pacific
Wyatt Technology Note
Poly(lactic-co-glycolic acid) (PLGA) is a copolymer based on glycolic acid and lactic acid. The two monomer units are linked together by ester linkages and form linear polyester chains. The obtained product is biodegradable and biocompatible, and it is approved by the Food and Drug Administration (FDA) for production of various therapeutic devices as well as for drug delivery applications. The properties of PLGA can be tuned by the ratio of the two monomers and by its molar mass distribution.
The characterization of PLGA by means of conventional size exclusion chromatography (SEC) is problematic because of the lack of suitable calibration standards. In addition, the linear polyester structure can be modified by the addition of small amounts of polyfunctional monomer to obtain branched chains of differing degrees of branching. The degree of branching becomes an additional parameter that can be used to adjust PLGA properties — all of which renders conventional column calibration an inadequate analytical technique.
In this application note, two commercially available samples were analysed by SEC coupled to a multi-angle light scattering (MALS) detector (HELEOS), a refractive index detector (Optilab rEX) and a viscosity (VIS) detector (ViscoStar). The ViscoStar was used in order to discover additional information about the molecular structure of the analysed polymers. In addition to molar mass distributions, the SEC–MALS-VIS system yields the relationship between intrinsic viscosity and molar mass (Mark-Houwink plot) that can provide deep insight into the molecular structure of the polymers being analysed.


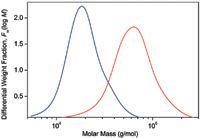
Figure 1: Differential molar mass distribution curves of two PLGA samples.
In Figure 1, the molar mass distributions are given as differential distribution plots. As seen from the plots, the two samples span markedly different molar mass ranges. The Mark-Houwink plots of the two samples are shown in Figure 2 together with the plot of linear polystyrene that is shown simply for the sake of comparison. The slope of the Mark-Houwink plot of the linear polystyrene is 0.71, a typical value for linear random coils in thermodynamically good solvents. The slope of the red sample roughly corresponds to a linear structure as well. However, there is a slight indication of deviation from linearity at the region of high molar masses that may indicate the presence of branched molecules. The Mark-Houwink plot of the blue sample is curved. Curvature of the Mark-Houwink plot generally reveals branching. In addition, the slope of the higher molar mass portion of the Mark-Houwink plot of 0.48 suggests significant branching.

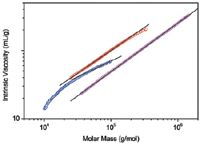
Figure 2: Mark-Houwink plots of two samples of PLGA (red and blue) and linear polystyrene (magenta). The lines are linear extrapolations of the data.
SEC-MALS-VIS is an excellent method for the characterization of PLGA polyesters as it has the ability to determine not only the molar mass distribution, but also to reveal subtle differences in PLGAs molecular structure.
Wyatt Technology Corporation
6300 Hollister Avenue, Santa Barbara, California 93117, USA
tel. (805) 681 9009 fax (805) 681 0123
Website: www.wyatt.com


; An Interview with Fabrice Gritti")
: An Interview With Fabrice Gritti")

. | Image Credit: © Joan Vadell - stock.adobe.com")
Detecting Hyper-Fast Chromatographic Peaks Using Ion Mobility Spectrometry
May 6th 2025Ion mobility spectrometers can detect trace compounds quickly, though they can face various issues with detecting certain peaks. University of Hannover scientists created a new system for resolving hyper-fast gas chromatography (GC) peaks.


University of Oklahoma and UC Davis Researchers Probe Lipidomic Profiles with RP-LC–HRMS/MS
May 6th 2025A joint study between the University of Oklahoma Health Sciences Center (Oklahoma City, Oklahoma) and the UC Davis West Coast Metabolomics Center (Davis, California) identified differentially regulated lipids in type 2 diabetes (T2D) and obesity through the application of reversed-phase liquid chromatography-accurate mass tandem mass spectrometry (RP-LC-accurate MS/MS).


Automated Sample Preparation (ISO 20122) for MOSH/MOAH in Seasoning Oils
May 6th 2025This work presents an Automated Sample Preparation procedure for MOSH/MOAH analysis of Seasoning Oils. We compare results from a manual epoxidation procedure compliant with DIN 16995 with results based on fully automated sample preparation (epoxidation and saponification) compliant with ISO 20122. In both cases, online clean-up via activated aluminum oxide (AlOx) are used to remove interfering n-alkanes from the MOSH fraction during the HPLC run. Automated data evaluation using a dedicated software (GERSTEL ChroMOH) is presented.

