Determination of Aflatoxins B1, G1, B2, and G2 in Tomato Extract by HPTLC
CAMAG Laboratory
Aflatoxins are natural mycotoxins produced by Aspergillus fungi. High temperatures and humidity favour the occurrence of moulds and therefore the production of aflatoxins. The contamination of crops, nuts, dried fruits or vegetables, dried medicinal plants, and milk is quite common. Because of their strong carcinogenicity, aflatoxins must be controlled in food and feeds.
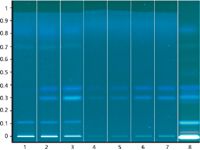
Figure 1: Image of the derivatized plate under UV 366 nm.
Scope
This method is suitable for the quantification of aflatoxins B1, G1, B2, and G2 in tomato extract according to the Test for Aflatoxins (1) which limits aflatoxin B1 to 5 ppb and the sum of B1, G1, B2, and G2 to 20 ppb. Chromatography is performed on HPTLC plates according to Method II.
Required or Recommended CAMAG Devices
Automatic TLC Sampler 4 or Linomat 5, Automatic Developing Chamber ADC 2 or Twin Trough Chamber 20 cm × 10 cm, Visualizer, TLC Scanner, and winCATS software.

Table 1: Track assignment.
Sample
Transfer 5 g of a representative powdered sample to a glass-stoppered flask. Add 20 mL of methanol and water (17:3). Shake vigorously by mechanical means for 30 min and filter. Discard the first 5 mL of the filtrate and collect the next 4 mL portion. Transfer the filtrate to a separatory funnel. Add 4 mL of sodium chloride solution (5 g of sodium chloride in 50 mL of water) and 2.5 mL of hexane, and shake for 1 min. Allow the layers to separate and transfer the lower aqueous layer to a second separatory funnel. Extract the aqueous layer in the separatory funnel twice, each time with 2.5 mL of methylene chloride, by shaking for 1 min. Allow the layers to separate each time. Separate the lower organic layer and collect the combined organic layers in a 50 mL conical flask. Evaporate the organic solvent on a water bath. Transfer the remaining extract to an appropriate sample tube and evaporate to dryness on a water bath. Cool the residue.
If interferences exist in the residue, proceed as directed for Cleanup with immunoaffinity column (IAC); otherwise, dissolve the residue obtained in 200 μL of acetonitrile, and shake by mechanical means if necessary.
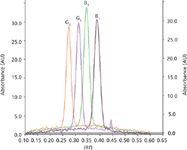
Figure 2: Densitogram of standards aflatoxin G2, G1, B2, and B1.
Cleanup with Immunoaffinity Column (IAC)
Dissolve the residue of the above sample solution in 5 mL of methanol and water (60:40) and then dilute with 5 mL of water. Apply this extract onto a conditioned IAC. Rinse the IAC twice with 10 mL of phosphate-buffered saline (PBS) solution*, and perform the elution slowly with 2 mL of methanol. Evaporate the eluate with nitrogen, and dissolve the residue in 200 μL of acetonitrile.
IAC Preparation
Prior to conditioning, the IAC should be adjusted to room temperature. For conditioning, apply 10 mL of PBS solution on each column and pass through at a rate of 2–3 mL/min by gravity. Leave 0.5 mL of PBS buffer on top of the column until the test solution is applied.
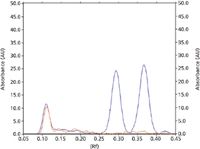
Figure 3: Densitogram of a tomato extract sample (red) and the same sample spiked with 5 ppb of aflatoxins B1 and G1 (blue).
For this application note, the sample of tomato extract was extracted using an IAC from R-Biopharm.
Standards
Accurately weighed standard solutions containing 0.05 μg/mL aflatoxin B1 and aflatoxin G1 and 0.01 μg/mL aflatoxin B2 and aflatoxin G2 in a mixture of chloroform and acetonitrile (9.8:0.2) were prepared.
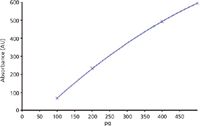
Figure 4: Calibration function for aflatoxin B1 measured at 366 nm. Regression via area y = -113.971+1.931x+-0.001x2; r = 0.99998; sdv = 0.84%.
Chromatography
Stationary phase: HPTLC Si 60 F254 20 cm × 10 cm (Merck).
Sample application: 10 μL of each test solution and 2, 5, 7.5, and 10 μL of standard are applied as 8 mm bands, a minimum of 2 mm apart, 8 mm from lower edge of plate.
Developing solvent: Chloroform–acetone–water (140:20:0.3) (v/v/v)
Development: 20 cm × 10 cm Twin Trough Chamber or ADC 2, saturated for 20 min (filter paper), 10 mL developing solvent per trough, humidity control at 33% relative humidity (using a saturated solution of MgCl2).
Developing distance: 70 mm from lower edge of plate.
Plate drying: 5 min in a stream of cold air.
Derivatization: Optional: dip (time 0, speed 5) in paraffin, n-hexane (2:3), dry in air.
Evaluation: Examination under UV 366 nm.
Densitometry
With CAMAG TLC Scanner and winCATS software in fluorescence mode at 366/>400 nm using a mercury lamp; evaluation via peak area, linear regression.
Results
Reference
(1) USP 35-2: Test for Aflatoxins of chapter <561> Articles of Botanical Origin.
*Phosphate-buffered saline (PBS) solution: Prepare 10 mM phosphate buffer solution containing 0.138 M sodium chloride and 0.0027 M potassium chloride in water, and adjust with 2 M sodium hydroxide to a pH of 7.4. A suitable powder mixture is available from Sigma as PBS P-3813.

CAMAG
Sonnenmattstrasse 1, 4132 Muttenz, Switzerland
Tel: +41 61 467 34 34 fax: +41 61 461 07 02
E-mail: lab@camag.com
Website: http://www.camag.com

Analytical Challenges in Measuring Migration from Food Contact Materials
November 2nd 2015Food contact materials contain low molecular weight additives and processing aids which can migrate into foods leading to trace levels of contamination. Food safety is ensured through regulations, comprising compositional controls and migration limits, which present a significant analytical challenge to the food industry to ensure compliance and demonstrate due diligence. Of the various analytical approaches, LC-MS/MS has proved to be an essential tool in monitoring migration of target compounds into foods, and more sophisticated approaches such as LC-high resolution MS (Orbitrap) are being increasingly used for untargeted analysis to monitor non-intentionally added substances. This podcast will provide an overview to this area, illustrated with various applications showing current approaches being employed.


