Simultaneous Quantitative and Qualitative Measurements in a Single Workflow to Increase Productivity in Primary Drug Metabolism Investigations
The Application Notebook
Bruker Daltonics
The ability to simultaneously collect quantitative and qualitative information from a DMPK analysis has the potential to significantly increase productivity in pharmaceutical drug discovery and development. We present a single workflow allowing P450 drug clearance values to be determined as well as metabolites identified, profiled, and their structures elucidated. To be able to do all of this on a high throughput UHPLC chromatographic timescale is essential for the high levels of productivity required for today's DMPK screening laboratories. Haloperidol provides a good example of what can be achieved.
Haloperidol
C21H23NO2FCl M+H+ = 376.1474
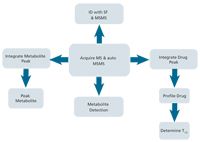
Figure 1: In a single workflow, data dependent MSâMS spectra identify and elucidate metabolite structures and drug clearance is measured.
Workflow and Protocol
Microsomal incubations were carried out by Unilabs Bioanalytical Solutions at 1 µM drug concentration and a protein concentration of 0.5 mg/mL. Aliquots were taken and quenched with acetonitrile containing propranolol as an internal standard at eight time points over a period of 60 min.
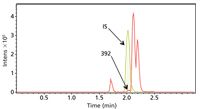
Figure 2: Metabolite detection software compares the data file for the drug (in this case t60) with the corresponding control sample. A base peak chromatogram of the difference is created allowing the metabolites to be easily observed and their mass determined to four decimal places.
Chromatography
Column: Fortis, 1.7 µm, H2O, 2.10 mm × 30 mm
Column temperature: 30 °C
MPA: 0.1% formic acid in 95% H2O/CH3CN
MPB: 100% CH3CN
Gradient: 0.0 0.3 2.0 2.5 2.6 3.0 min
MP %: 95 95 5 5 95 95 %
Flow rate: 300 µL/min
Injection volume: 5 µL
The high surface area and lipophilic ligand combined with a hydrophilic end cap give this stationary phase a broad selectivity and resolving power for the target drug and the metabolites. The use of small particles allows UHPLC to compress the peak into a tighter and taller peak, therefore enhancing detection of very low level analytes.
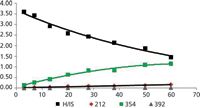
Figure 3: Time profiles for the disappearance of haloperidol and the appearance of three metabolites.
Metabolite Detection
Metabolite detect software compares the data file for the drug (in this case t60) with the corresponding control sample. A base peak chromatogram of the difference is created allowing metabolites m/z 354, 212, and even 392 to be easily observed.
Metabolite detection software is able to detect the m/z = 392 metabolite even though it co-elutes with the internal standard.
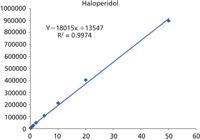
Figure 4: Linear calibration of 50 pg/mL to 50 ng/mL (3 decades) was achieved using the XIC for the measured m/z of each metabolite ± 0.005 Da. R2= 0.9974.
Drug and Metabolite Profiles
Integration is carried out on the XIC for the measured m/z of each metabolite ± 0.005 Da. Plotting the ratio of metabolite to internal standard (M/IS) versus time produces the metabolite profiles. Half-life and clearance values are determined from the natural log (ln) of the drug profile versus time plot.

Figure 5: The structure of metabolite m/z = 354 is easily identified using Smartformula3D to understand the fragmentation pattern
Linearity
MS–MS data was not available for m/z = 392 because of co-elution with the internal standard. The high quality data available, even for such a small peak, means SmartFormula is still able to predict the formula and deduce that it is a mono-oxidative metabolite.
m/z = 392.2422 Δm = 0.1 mDa (0.3 ppm)
C21H23 NO3 FCl Isotope fit = 23 ms

Figure 6: The structure of metabolite m/z = 392 is easily identified using Smartformula3D to understand the fragmentation pattern
Comparison with 3Q
Both the AB Sciex API 5000 and Bruker impact QTOF yield equivalent results for the clearance values. This can be clearly seen by comparing the ln [Drug]/[IS] versus time plots.
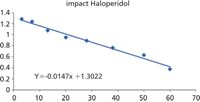
Figure 7: Clearance data from impact.
The linearity and gradients of these plots are nearly identical and result in values for t½ of 45 and 47 min, respectively.
The difference in y intercept is a result of a difference in relative response of the internal standard and has no influence on the clearance results.
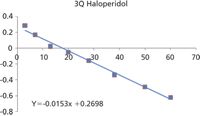
Figure 8: Clearance data from 3Q.
Conclusions
The Quan–Qual workflow is effective and robust using a rapid analytical method suitable for high throughput screening at 1 µM drug concentrations.
Metabolite detection software allows metabolites to be rapidly identified and profiled even when compounds co-elute.

Bruker Daltonics Inc.
40 Manning Road, Billerica, Massachusetts, USA
Tel: (978) 663 3660 fax: (978) 667 5993
Website: www.bruker.com

Determining the Effects of ‘Quantitative Marinating’ on Crayfish Meat with HS-GC-IMS
April 30th 2025A novel method called quantitative marinating (QM) was developed to reduce industrial waste during the processing of crayfish meat, with the taste, flavor, and aroma of crayfish meat processed by various techniques investigated. Headspace-gas chromatography-ion mobility spectrometry (HS-GC-IMS) was used to determine volatile compounds of meat examined.

.png&w=3840&q=75)

.png&w=3840&q=75)


.png&w=3840&q=75)


.png&w=3840&q=75)


