Characterization and Prediction of Emulsification Performance of Acacia Gums
LCGC North America
The authors use GPC coupled online to multiangle laser light scattering, refractive index, and ultra violet (UV) detectors for the characterization of Acacia gum (gum arabic).
Gum arabic (A. senegal) is a highly heterogeneous complex polysaccharide that consists of three main fractions. These fractions are arabinogalactan protein complex (AGP), arabinogalactan (AG), and glycoprotein (GP). Each fraction contains a range of different molecular weight components with different protein contents (1). The AGP fraction is composed of hydrophilic carbohydrate blocks linked to a protein chain and has been reported to have a wattle blossom-type structure due to being degraded readily by proteolytic enzyme (Figure 1) (2–4).
The carbohydrate blocks are made up of galactose, L-arabinose, D-glucuronic acid and 4-O-methyl glucuronic acid.
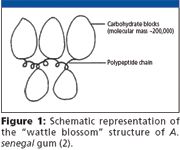
Figure 1
Gum arabic is used mainly in food, pharmaceutical, and cosmetic industries due to its unique physiochemical and functional properties (5,6). These functional properties are related directly to the molecular structure. Of particular importance is the amount of the high molecular weight AGP component that is present because it has now been established that this is the component controlling efficiency of emulsification and adhesion (7–9). Gum arabic's role as an emulsifer is achieved as a consequence of its amphiphilic character due to the presence of protein and polysaccharide moieties. It reduces the oil–water interfacial tension, thereby facilitating the disruption of emulsion droplets during homogenization. The peptide moieties (2–3% present in gum arabic) are hydrophobic and strongly adsorb onto the surface of oil droplets, and the polysaccharide chains are hydrophilic and extend out into the solution, which prevents droplet flocculation and coalescence through electrostatic and steric repulsion forces.
We have shown recently that the proportion of the AGP and molecular weight parameters can be determined readily by gel permeation chromatography with multiangle laser light scattering detection (GPC-MALLS) and consequently, good and poor emulsifier can be identified (10). Additionally, the technique has been applied to investigate the molecular weight distribution for a wide range of commercial samples of A. senegal provided by a range of suppliers in the three different forms (kibbled, spray dried, and instant soluble) (11).
The objectives of this article are to demonstrate the application of GPC coupled to three detection systems for the characterization of gum arabic, to provide information about the material now available commercially and the variations present, and, finally, to demonstrate the correlation of arabinogalactan protein component with the emulsification performance.
Methodology
The system consisted of an Agilent 1100 series G1314A UV detector (214 nm, Agilent Technologies, Palo Alto, California), a DAWN EOS MALLS detector (λ=690 nm, Wyatt Technology Corporation, Santa Barbara, California) and an Optilab rEX refractometer (Wyatt Technology Corporation). A Superose 6 10/300GL (Amersham Biosciences, Buckinghamshire, UK) was used with 0.2 M sodium chloride aqueous solution filtered though a 0.22-μm Millipore filter (Millipore, Billerica, Massachusetts) as eluent at flow rate of 0.40 mL/min using a Knauer HPLC pump model K-501 (Berlin, Germany). The gum solution (2 mg/mL) was hydrated overnight. Injection into the GPC column was made with a manual injection value (Rheodyne Model 7725i, supplied by Wyatt Technology, UK) equipped with a 100 μL sample loop. A value of 0.141 mL/g was used for the differential refractive index increment (dn/dc). Astra for Windows software (version 4.90.07, Wyatt Technology Corporation) was used to control data acquisition and the Berry fitting method was used for analysis. The GPC-MALLS system used in this study has been described previously (10,11). Emulsion composition was as follows: gum arabic, 20 w/w%; citric acid, 0.12 w/w%; sodium benzoate, 0.13 w/w%; and MCT, 20 w/w%. Detailed methodology has been described previously (12).
Results and discussion
A typical elution profile for A. senegal monitored using light scattering, refractive index, and UV detection is shown in Figure 2 and is summarized in the following sections.
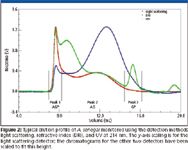
Figure 2
- The light scattering response reflects the mass and concentration and shows two distinctive peaks. The first peak has a high response because it corresponds to the high molecular weight material (AGP) content (see Figure 1). The second peak is broader with lower response and it accounts for the rest of the gum (AG+GP ~90%).
- The refractive index response also shows two peaks but the response is opposite to that in light scattering. This is because it is a concentration detector, and because the AGP is only 10% of the total gum, its peak is smaller than that of the AG and GP, which constitute ~90% of the total mass.
- The UV response shows three peaks. The first peak is for the AGP, which has the protein core and the carbohydrate attached to it (Figure 1). The second peak appears as a shoulder immediately after the AGP and corresponds to the AG. Finally, the third peak is eluted before the total volume and corresponds to the GP. The GP peak, which constitutes ~1% of the total gum, is not detected on the light scattering (mass detector) because it has low molecular weight. Also, it cannot be seen on the refractive index (concentration detector).
The GPC-MALLS technique has been applied for the characterization of >300 commercial samples supplied by primary supplier, producer, and user companies. The various molecular parameters can be obtained for the whole gum (AGP+AG+GP) and the individual peaks (processed as peak 1 AGP; peak 2 AG+GP) as shown in Table I. Our results showed wide variations between individual samples, which can be attributed to natural built-in variations in a natural product such as gum arabic (11).

Table I: Example of the molecular weight parameters of gum arabic determined by GPC-MALLS system obtained from spray dried samples. d is the polydispersity (Mw/Mn), Mw processed as two peaks means that the high molecular weight fraction (AGP) was processed separately and the remainder of the gum (AG1GP) processed as the second peak.
Additionally, we have identified the presence of large molecular weight material, which is eluted at the start of the elution volume, termed here the aggregate peak. This peak is detected occasionally in raw material due to the presence of green gum but is not present with the majority of gum arabic samples we have investigated. The presence of the aggregate peak in the spray dried samples is well represented and has been attributed to the processing conditions, which employ harsh treatments (11). We have demonstrated that upon controlling the drying conditions, the presence of the aggregate peak can be eliminated. Fractionation techniques such as GPC coupled online to an absolute macromolecular characterization detector such as MALLS is one of the best techniques to detect aggregation in polymer solutions. Detailed characterization of the aggregate peak shows that the Rg values at the start of the elution and at the peak height (6.87 mL and 7.25 mL in Figure 3 are 200 and 100 nm, respectively. Furthermore, we have found that the proportion of the aggregate peak can vary from 0.02% to >2% of the total injected mass and greatly contribute to increasing the average molecular weight.
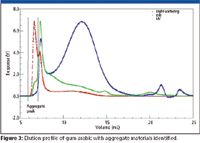
Figure 3
Filtration through a smaller pore size filter (0.1 μm) results in removing the aggregate peak and repeated filtration results in further disassociating the AGP peak. Aggregation is due to harsh temperature treatment in which the glycoprotein (GP) peak cannot be detected in its normal position (14–16 mL) and inevitably is eluted at the start of the elution volume, which could explain the UV response. This is demonstrated in Figure 4 for a sample in which the aggregate peak is compared with another spray-dried sample that did not show an aggregate peak. It is also possible that the AGP fraction also aggregates due to the high protein content present, forming the high molecular weight and large Rg characteristics of the aggregate peak.
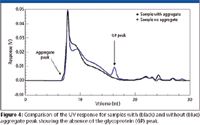
Figure 4
Determination of the AGP content is correlated directly with the emulsification performance for a number of A. senegal samples, as shown in Figure 5. High AGP content results in good emulsification performance as demonstrated by the low emulsion stability index. The emulsion stability index is calculated by the sum of the initial volume median diameter (VMD) plus the incremental changes after heating to 60 °C for three and seven days to accelerate possible destabilization processes in the emulsions. Thus, lower emulsion stability index corresponds to a better emulsification and stability. The results shown in Figure 5 demonstrate that a large proportion of the proteinaceous component (AGP) results in formation of elastic membrane around the oil droplet that prevents them from aggregating (flocculating or coalescing). By increasing the proportion of the AGP component, a large surface area of oil droplet can be covered. This has been the basis of a recent method to modifiy Acacia senegal to produce superior quality gum with enhanced performance (13). Additionally, Figure 5 shows the presence of two samples with inferior emulsification performance as a result of small proportion of AGP. This small AGP % is not typical for A. senegal and indicates an adulteration with a low AGP% usually found in other acacia gum species such as Acacia polycantha. A. polycantha also has levorotatory specific optical rotation and belongs to the same group known as Acacia senegal complex.
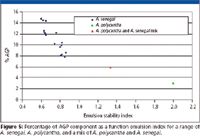
Figure 5
Conclusions
This study demonstrates the use of the GPC-MALLS technique for the characterization of Acacia gums. Valuable information about the gum characteristics can be obtained by the use of three detection systems. The light scattering detector is most suited for the detection of aggregates that could be produced as a result of harsh processing conditions during spray drying. The refractive index detector gives the proportion of the active component and the molecular weight characteristics. The UV detection is useful particularly for identifying the protein distribution throughout the gum. Finally, the molecular weight parameters correlate reasonably well with the actual emulsification performance and demonstrate that the GPC-MALLS technique can be used to predict the functionality.
Acknowledgment
Dr. Kevin Jackson of Wyatt Technology UK is acknowledged for his useful comments.
Saphwan Al-Assaf*‡ and Glyn O. Phillips†
*Glyn O.Phillips Hydrocolloids Research Centre, North East Wales Institute, Mold Road, Plas Coch Campus, Wrexham LL11 2AW, UK.
†Phillips Hydrocolloid Research Ltd, Cardiff CF15 8BL, UK
Please direct correspondence to Saphwan Al-Assaf at s.alassaf@newi.ac.uk
References
(1) R.C. Randall, G.O. Phillips, and P.A. Williams, Food Hydrocolloids 3, 65–75 (1989).
(2) G.B. Fincher, B.A. Stone, and A.E. Clarke, Ann. Rev. Plant Physiol. Plant Molec. Biol. 34, 47–70 (1983).
(3) M.E. Osman, A.R. Menzies, P.A. Williams, G.O. Phillips, and T.C. Baldwin, Carbohydrate Research 246, 303–318 (1993).
(4) S. Connolly, J.C. Fenyo, and M.C. Vandevelde, Comptes Rendus Des Seances De La Societe De Biologie Et De Ses Filiales 181, 683–687 (1987).
(5) A.M. Islam, G.O. Phillips, A. Sljivo, M.J. Snowden, and P. A. Williams, Food Hydrocolloids 11, 493–505 (1997).
(6) N. Garti, J. Dispersion Sci. Technol. 20, 327–355 (1999).
(7) M.J. Snowden, G.O. Phillips, and P. A. Williams, Food Hydrocolloids 1, 291–300 (1987).
(8) R.C. Randall, G.O. Phillips, and P.A. Williams, Food Hydrocolloids 2, 131–140 (1988).
(9) E. Dickinson, Food Hydrocolloids 17, 25–39 (2003).
(10) S. Al-Assaf, T. Katayama, G.O. Phillips, Y. Sasaki, and P. A. Williams, Food and Food Ingredients J. Japan 208, 771–780 (2003).
(11) S. Al-Assaf, G.O. Phillips, and P. A. Williams, Food Hydrocolloids 19, 647–660 (2005).
(12) H. Aoki, T. Katayama, T. Ogasawara, Y. Sasaki, S. Al-Assaf, and G.O. Philllps, Food Hydrocolloids 21, 353–358 (2007).
(13) S. Al-Assaf, G.O. Phillips, H. Aoki, and Y. Sasaki, Food Hydrocolloids 21, 319–328 (2007).
Analytical Challenges in Measuring Migration from Food Contact Materials
November 2nd 2015Food contact materials contain low molecular weight additives and processing aids which can migrate into foods leading to trace levels of contamination. Food safety is ensured through regulations, comprising compositional controls and migration limits, which present a significant analytical challenge to the food industry to ensure compliance and demonstrate due diligence. Of the various analytical approaches, LC-MS/MS has proved to be an essential tool in monitoring migration of target compounds into foods, and more sophisticated approaches such as LC-high resolution MS (Orbitrap) are being increasingly used for untargeted analysis to monitor non-intentionally added substances. This podcast will provide an overview to this area, illustrated with various applications showing current approaches being employed.
Study Examines Impact of Zwitterionic Liquid Structures on Volatile Carboxylic Acid Separation in GC
March 28th 2025Iowa State University researchers evaluated imidazolium-based ZILs with sulfonate and triflimide anions to understand the influence of ZILs’ chemical structures on polar analyte separation.


