Back to the Basics: Considering Carryover, Column Back Pressure, and Wavelength When Developing Chromatographic Methods
Special Issues
The parameters that should be considered in the optimization of HPLC methods are explained and then illustrated through the analysis of two commercial agricultural products.
High-performance liquid chromatography (HPLC) is a sophisticated technique. Chromatographers must not forget the basics of method development to reap the full benefits in practice. Obvious parameters to optimize include the choice of chromatographic column, mobile phase, injection volume, flow rate, and detector settings. However, it is also beneficial to know how to determine carryover, the properties of the needle wash solvent used, and the importance of monitoring instrument back pressure. This article will discuss issues related to carryover, instrument back pressure, and the choice of wavelength.
Wavelength selection, back pressure and injection to injection carryover were investigated to determine considerations during method development. The goal of the experiments was to control the overall precision of a technical assay measurement. We have investigated these parameters for two commercial agricultural products and report the results here.
Carryover
Carryover is a common problem in high-performance liquid chromatography (HPLC). Carryover is detected by the unexpected presence of small peaks when a blank sample is injected following the injection of analyte samples. It can also be detected by unexpectedly poor injection-to-injection precision following multiple sample injections. If a calibration curve is constructed, deviations from linearity may signal the presence of carryover (1).
The design of modern HPLC autosamplers has been greatly improved, decreasing the likelihood and magnitude of carryover from injection to injection. Manufacturers have changed the physical designs of instrument hardware to utilize features such as flow-through needles and active needle washes. In addition, instrument control software can offer different methods of washing the needle and the injector valves.
To make the best choices regarding carryover, operators should become familiar with the options installed on the instrument. Even if familiar, they still have to make the right choices to take full advantage of them.
The easiest way to determine if there is carryover in a method is to run blanks between sample injections. Blanks can be composed of the mobile phase organic modifier or sample diluent, among other options. It is important, during method development, to run blanks regularly, whether to identify the amount of carryover, or to show that it is non-existent or negligible. It is insufficient to assume that a clear chromatogram for one blank injection following the first sample injection means that carryover is not an issue for the sample and method being used. Even after method development completion, it is good practice to continue to inject blanks interspersed with your samples and standards. This guarantees the validity of the original determinations and that the sample matrix does not change chromatographic behavior.
If carryover is identified, many steps can be taken to correct it. First, it is important to determine what type of carryover is present. The problem may be hardware — a small amount of the sample may be held up in the system and injected onto the column in subsequent injections. Some solutions to this are to check: auto-sampler hardware; all compression fittings and tubing connections; and the wash solvent and station (2).
The problem may also be an issue with the chosen washing mechanism; autosamplers have active needle washes to rinse the outside of the needle to prevent carryover (2,3). Users need to follow the manufacturer's recommendation for priming and flushing these needle wash systems. An alternative option is to wash the needle in a vial of solvent. If used, it is important to change the vial often, depending on the analyte of interest. This paper shows how calculated injection-to-injection reproducibility can be compromised by carryover, simply because the optimum wash solvent was replaced with one that did not work as well.
Back Pressure
Another consideration for HPLC users is instrument back pressure. When high pressures are discussed in relation to HPLC, it is typically with a negative connotation. However, high pressure pumps are what allow the mobile phase to be pushed through the chromatographic column's packed bed, driving separation. Newer generation, fully porous columns are being produced with smaller particle sizes and longer lengths, increasing efficiency. Therefore the pressure required to force the mobile phase through these columns is increasing. Many manufacturers now offer instrumentation that offers much higher maximum pressures, allowing the user to achieve more efficient separations with current column technology. This makes it increasingly important to monitor back pressure and to pay special attention to the maximum back pressure rating on columns, fittings and instruments.
For years, it seemed that the maximum pressure rating on instruments, fittings, parts, and columns was 400 bar. This was also the maximum pump pressure for the instrument before it would shut itself off, so it may not have seemed important to check the pressure limits carefully. However, with the introduction of ultrahigh- pressure liquid chromatography (UHPLC) instruments, technology, and columns, products are now commercially available that each have their own maximum pressure rating. Special attention should be paid to the stated maximum pressure ratings when replacing fittings, and when purchasing and using columns. If columns are used at pressures above their maximum rating, the packing can be fractured, resulting in fine particles that can move through the column toward the outlet frit, increasing the back pressure. Possible causes of high back pressure were discussed along with ways to deal with these issues in a previous LCGC "Column Watch" article (4).
Back pressure should be initially checked when the column is installed and equilibrated. It should then be continually monitored before, during, and after the analysis. As a safety consideration, it is also important to check that maximum pressure settings on the instrument do not exceed the maximum pressures allowed for the fittings and columns so that these pressures are not exceeded during analysis. This can be particularly important for method transfers to other instruments and will be discussed later in more detail.
Wavelength
Lastly, this article will discuss the choice of wavelength for each analysis. The detector handbook for the two liquid chromatography instruments used gave all of the following information about optimizing detector wavelength (5,6):
- Choose a longer wavelength than the cutoff wavelength of the mobile phase. Solvents used as HPLC mobile phases have some absorbance in the UV region. The cut-off wavelength is the wavelength below which the mobile phase has high absorbance and could interfere with the analysis.
- Choose a wavelength where the analytes have strong absorptivity to achieve the lowest possible detection limit.
- Choose a wavelength with moderate absorptivity for high concentrations.
- Set the sample wavelength to coincide with a peak or valley in the spectrum to achieve the best linearity.
Analytical chemistry textbooks typically suggest choosing wavelength at an absorbance maximum and bandwidth that gives the required signal to noise ratio (S/N). Models representing the correlation between diode array UV detector responses, the detector band pass, and the analyte's absorbance spectra were presented in a paper published by Dose and Guiochon (7). The work shows that when using a UV detector, there has to be a compromise between the linearity of the response and the accuracy of the absorbance measurement. For chromatographers who typically use the calibration curve to quantitate, linearity is of utmost importance. As a result, the wavelength is typically chosen at a spectral maximum (7). We have performed a study to determine whether the choice of wavelength, whether at an absorbance maxima, at an absorbance valley, or on a sloped portion of the curve would have an effect on the precision of the results calculated from the experiment.
Experimental
Diuron and rimsulfuron standards were obtained from DuPont Crop Protection. Phenyl sulfone (Aldrich Chemicals) and 3–methyl-1,1-diphenylurea (Aldrich Chemicals) were the internal standards. HPLC-grade acetonitrile (EMD Millipore Corp.), and phosphoric acid (EM Science), and house deionized water were used for mobile phase preparation. Diuron sample solutions were used immediately or stored in the refrigerator. Rimsulfuron samples, because of solution issues, were used immediately.
Diuron
Diuron standards and samples were prepared in acetonitrile. The standards ranged in concentration from 0.75 to 1.25 mg/mL and samples were prepared at a concentration of 1 mg/mL. Precision data were calculated based on eight individually prepared samples with duplicate injections of each sample. The internal standard was 3–methyl-1,1-diphenylurea. The final internal standard concentration was 1 mg/mL The chromatographic conditions are given in Table I. The two HPLC systems used were an Agilent 1290 Infinity HPLC system and an Agilent 1100 HPLC system, both with diode array detection (Agilent Technologies Inc.).
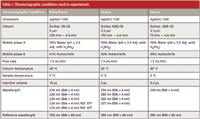
Table I: Chromatographic conditions used in experiments
Rimsulfuron
Rimsulfuron standards and samples were prepared in acetonitrile. The standards ranged in concentration from 0.25–1.5 mg/mL and the samples were prepared at a concentration of 0.75 mg/mL. Precision data were calculated based on eight individually prepared samples with duplicate injections of each sample. The internal standard was phenyl sulfone. The final internal standard concentration was 1.95 mg/mL The chromatographic conditions are given in Table I. The HPLC system used was an Agilent 1100 HPLC system with diode array detection (Agilent Technologies Inc).
Results and Discussion
Carryover
If carryover is detected, the options are to wash the needle wash in a flush port, in a sample vial, or wash in multiple sample vials. An active needle wash is best used when the analytes in the sample have similar solubility. The solvent or solvent mixture and the length of wash time can be optimized for the sample. It is important, if using an active needle wash, that the solvent reservoir be checked regularly and the needle wash system primed or flushed with the solvent prior to analysis (in the same way that it is necessary to prime and flush LC pumps). It is also good practice to rinse the needle flush port with at least two times its volume before the analysis. If an active needle wash is not available, or if more than one solvent is needed to clean the needle, then it may be necessary to wash the needle in solvent placed into capped solvent vials. If this method is used, it is important to regularly change the vials of solvent used, which can increase method execution time. For samples where carryover is a significant problem, it may be necessary to wash the needle after every few injections in a new vial of solvent. Figure 1 shows the results of an experiment where the analyte was known to have issues with carryover. The graph shows the specifications for injection precision for the instrument used. It also shows the difference in the method precision (based on %RSD of peak areas) based on eight replicate injections, when two different needle wash solvents were used. The results show that for this particular analyte, 50% acetonitrile in water was not the right choice. When the solvent was changed to 100% acetonitrile, the %RSD calculated for the method were closer to those expected for the instrument used.
Back Pressure
When developing methods, back pressure needs to be a consideration for several reasons. First, it is often one of the early signs of either instrument or column failure. If a column, guard column, needle seat, or a piece of instrument tubing is becoming clogged, the pressure may slowly creep up. Knowledge of the typical back pressure for the instrument, without the column installed, can help to quickly determine if the column or a portion of the instrument is the cause of high back pressure. The user should also have an idea of what back pressures to expect when using a particular method.
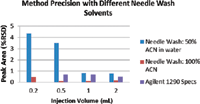
Figure 1: Method precision for a diuron UHPLC method when different needle wash solvents are used.
Monitoring back pressure can also be important for smooth method transfer and column longevity. When using a gradient method, the back pressure can vary greatly over the course of one run. This is especially true for methods involving methanol. The viscosity of binary methanol/water mixtures changes greatly as the percentage of each solvent in the mixture changes. If a method starts with low back pressure (within the range for the instrument and column), but during the method nears or exceeds the higher end of the range for the column, it can result in premature column failure and increased cost. When transferring a method to another instrument, this becomes even more important. If the second system (instrument and column) has a higher overall back pressure than the first, then the method may exceed the pressure maximum causing the method to fail, preventing successful method transfer. The method would then need to be modified and revalidated.
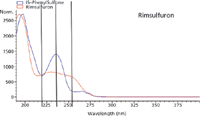
Figure 2: Rimsulfuron and phenyl sulfone (IS) absorbance spectra overlayed with detector wavelengths indicated.
Wavelength
Diuron and rimsulfuron were chosen for this portion of the study. Standard solutions of the analyte and an internal standard were prepared along with eight individually prepared samples. Data were simultaneously collected at several wavelengths. The wavelengths were chosen at a spectral maximum, at a spectral valley, and also on the sloped portion of the spectrum. Note that the wavelengths (shown in Figures 2 and 3) were picked by analyzing the spectra for the analyte and internal standard. Calibration curves were prepared for both an internal standard calibration and an external standard calibration. The calibration curves were then used to determine the percent recovery for the samples. The correlation coefficients and standard deviation values for the calculated percent recoveries are shown in Tables II and III. The results shown for the internal standard and external standard methods were calculated using data from the same experiments. Class A volumetric glassware was used for solution preparation so that data collected would give information for both methods. For the external standard method, only the data for the analyte were used and a calibration curve was prepared by plotting the peak area for the analyte against the concentration of the analyte in each standard solution. For the internal standard method, the calibration curve was prepared by calculating the ratio of the analyte peak area to the internal standard peak area and plotting this ratio against the ratio of the analyte amount to the internal standard amount. The resulting calibration curves were used to calculate the percent recoveries for each analyte. The standard deviations of the calculated percent recoveries are shown in Tables II and III; the correlation coefficients for the calibration curves are also included.
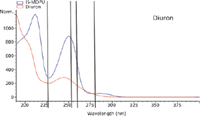
Figure 3: Diuron and 3-methyl-1,1-diphenylurea (IS) absorbance spectra overlay with detector wavelengths indicated.
Analysis of correlation coefficients for the calibration curves produced for different wavelengths showed no striking differences. Analysis of the standard deviations was not so clear, so we turned to statistics for a proper analysis.

Table II: Precision results (calculated from percent recovery results for eight standards injected in duplicate) and correlation coefficients for calibration curves for rimsulfuron. Data collected on an Agilent 1100 instrument.
For rimsulfuron samples there were slight differences in the calculated standard deviations at different wavelengths for both the internal standard method and the external standard method. Using the F-test, it was determined that the calculated standard deviations were not significantly different, independent of what wavelength was used and the method of calibration.

Table III: Precision results (calculated from percent recovery results for eight standards injected in duplicate) and correlation coefficients for calibration curves for rimsulfuron. Data collected on an Agilent 1100 instrument.
For diuron samples the F-test showed a significant difference in the standard deviations calculated using the internal standard method and the external standard method. However, the F-test did not show a significant difference between the results calculated at different wavelengths.
The choice of wavelength is known to be important as it determines how strongly the analytes absorb. Therefore it determines how large the signal and S/N ratio will be. However, this experiment suggests that as long as the S/N ratio meets requirements, and the peaks are large enough to be easily and accurately integrated, there is a lot of flexibility in wavelength choice. Therefore as long as the calibration curve is linear and the samples fall within the appropriate range of this calibration curve, the wavelength can be chosen to allow for other improvements in the experiment. For example: a wavelength where the analyte has lower absorbance may be chosen so that the amount of analyte being weighed for the experiment can be increased.
Conclusion
Chromatographers have a wide variety of new options in instruments and columns that allow for better separation and quantitation of their samples. However, we must not forget to go "back to basics" when developing methods, or the full effects of all the recent improvements may not be realized. Some essential factors to consider during method development, and also later as the methods are being used routinely, are: sample carryover, system back pressure, and wavelength choice.
References
(1) J.W. Dolan, LCGC Europe 19(3) (2001) http://www.lcgceurope.com/lcgceurope/data/articlestandard//lcgceurope/042002/7657/article.pdf
(2)J.W. Dolan, LCGC North Am. 19(10), 1050–1054 (2001).
(3)J. Dolan, LCGC Europe 19(10), 522–529 (2006).
(4) R. Majors., LCGC North Am. 25(11), 1074–1092 (2007).
(5) Agilent Technologies 1200 Series Variable Wavelength Detector Service Manual, 2nd edition (2006) G1314–90110.
(6) Agilent Technologies 1200 Series Diode Array and Multiple Wavelength Detectors, 2nd edition, (2006) G1315B / G1365B.
(7) E.V. Dose and G. Guiochon, Anal. Chem. 61, 2571–2579 (1989).
Karyn M. Usher is an Associate Professor of Chemistry at West Chester University (Pennsylvania, USA). She contributed to this work during a sabbatical as a visiting scientist at DuPont Crop Protection.
Steven W. Hansen is a Senior Research Associate at E.I. DuPont de Nemours and Company.
Mary Ellen P. McNally is a Technical Fellow at E.I. DuPont de Nemours and Company, and a member of the editorial advisory board of LCGC. Please direct correspondence to: Mary-Ellen.McNally@dupont.com

Study Explores Thin-Film Extraction of Biogenic Amines via HPLC-MS/MS
March 27th 2025Scientists from Tabriz University and the University of Tabriz explored cellulose acetate-UiO-66-COOH as an affordable coating sorbent for thin film extraction of biogenic amines from cheese and alcohol-free beverages using HPLC-MS/MS.
New Study Investigates Optimizing Extra-Column Band Broadening in Micro-flow Capillary LC
March 12th 2025Shimadzu Corporation and Vrije Universiteit Brussel researchers recently investigated how extra-column band broadening (ECBB) can be optimized in micro-flow capillary liquid chromatography.


