Practical Tips for Operating UHPLC Instruments and Columns
Special Issues
The authors explain modern UHPLC instrument design and outline simple procedures to identify causes of poor column and method performance.
Traditional high-performance liquid chromatography (HPLC) method development simply required careful definition of column, mobile phase and detector conditions. However, for ultrahigh-pressure liquid chromatography (UHPLC), which offers very high column efficiency and narrow sample elution bands, the UHPLC instrument components must be carefully matched in performance with columns to achieve desired resolution. If UHPLC underperforms, it can be difficult to determine whether the instrument or column is the problem. This article will describe the design of modern UHPLC instruments and offer simple procedures to identify the causes of poor column and method performance. Modern textbooks do not yet adequately address the complex topic of UHPLC, therefore the reader is encouraged to collect all references to learn important, additional details.
For almost two decades, high-performance liquid chromatography (HPLC) research has focused on smaller column particles. This coined the widespread use of the term ultra to describe the achievement of higher performance by using smaller particles and higher operating pressure. In 1987, Kirkland (1) published on the use of 2-μm porous, wide-pore silica for the separation of peptides and proteins, referring to the particles as ultramicrospheres. In 1994, Jorgenson began publishing on ultrahigh-pressure separations in capillary dimensions using 1.0 μm solid ODS silica (2) and has prepared a comprehensive review of his work (3).
In 1998, Poppe (4) compared retention and loadability advantages of Kirkland's 1.8-μm porous ODS silica over 1.5-μm solid ODS silica. In 2000, Kirkland (5) used the term ultrafast HPLC in a review article when comparing the performance of small porous and superficially porous silica particles. Swartz (6) described ultra-performance liquid chromatography columns and instruments in 2005. While many articles have documented the benefits of reducing particle size to improve column efficiency (N), practical applications require that all small particles must have adequate surface area and stationary phase loading to fully utilize retention and selectivity terms in the resolution equation.

The benefits of higher efficiency to achieve speed and resolution can be fully appreciated by examining the resolution and van Deemter equations. Figure 1 compares theoretical van Deemter plots for several particles using a simple form of the equation, and also shows the relationships between plates and pressure as particle size is reduced. Doubling the efficiency (by halving the particle size) creates a 40% increase in resolution for the same column length and flow rate, but requires about four times the amount of pressure. Particle size can be halved and still generate about the same efficiency and resolution with only half the column length, requiring about half the time at the same flow rate. The shorter column with smaller particles would require only slightly higher pressure. In addition to lower H and higher N, the van Deemter plot shows that smaller particles have the advantage of much flatter H values at higher flow velocities. This exciting result with small particle columns predicts that speed can not only be doubled by halving particle diameter, but can be doubled and doubled again by operating at higher flow velocities. No significant resolution will be lost as long as instruments can keep up with the flow rate and pressure requirements. Ultrahigh-pressure instruments were developed specifically to take full advantage of ultrahigh-performance columns operated at high linear velocities. Although the constraint of having to operate near the minimum in H has been removed by modern column technology, higher flow and pressure causes frictional heating and uneven temperatures inside the column that may alter both efficiency and selectivity. Gritti and Guiochon (7) have recently published an excellent overview of present and future issues in UHPLC.
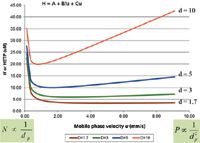
Figure 1: Van Deemter plots for porous particles. Note that only sub-2-μm porous particles fall below 5-μm plate height, H. Since N = L/H, column efficiency exceeds 200,000 plates/m, which can be considered the minimum performance level that defines a UHPLC column. Core-type particles in the sub-3-μm range and certain monoliths can also achieve this level of column performance when losses due to instrument dispersion are small or can be corrected.
Practical Operation of UHPLC Systems
In HPLC or UHPLC, there are clear distinctions between columns, instruments and systems that must be understood to appreciate what can happen in UHPLC experiments to create disappointing system performance. A modern column must be matched to the right instrument to create a system with good performance.
Instrument Band Spreading
Sample peaks spend time both outside and inside the column. The flow path outside the column promotes rapid band spreading and should be minimized relative to the flow path inside the column, which resists band spreading. Majors published a review in 2003 (8) of how uncontrolled HPLC instrument or extracolumn effects can reduce column performance. Majors used the following variance equation:

where column peak variance increases with k while instrument variance remains fixed for a given flow rate:

A certain amount of band dispersion, σ, from the different components always exists and can be estimated from equations or measured experimentally. The dispersion from each component must be added as the variance, σ2, as shown. For example, if each of the three components in equation 3 adds 5% extra bandspreading (σ) to the solute peak, the total peak dispersion added by the instrument would only be 8.6% (not 15%), as follows

In 1960, during the infancy of column chromatography, Klinkenberg (9) reported that instrument (extracolumn) dispersion should be maintained below 5% for good system performance. Variance and dispersion are usually estimated or measured from bandwidth of sample peaks and reported in volume units such as microliters (μL).
In about 2004, before the introduction of UHPLC instruments, columns with sub-2-μm particle performance could only be used effectively with research instruments that had optimized, low-volume components. Traditional instruments with 400 bar (6000 psi) pressure limits and 0–10 mL/min flow range were designed to barely meet the needs of columns with 3-μm particles and quickly exceeded pressure limits at high flow velocities with even short 3-μm columns. In addition, most traditional instruments used tubing with 0.010 in. (0.25 mm) or 0.007 in. (0.17 mm) i.d. When coupled with other components in the sample flow path, instrument band spreading became too large to be compatible with the narrow peak widths of early solutes emerging from modern columns. Although traditional instruments with factory components usually degrade efficiency of modern columns, they can be readily optimized by changing components. In 2005, Henry and Bell offered guidelines (10) to optimize liquid chromatography–mass spectrometry (LC–MS) and liquid chromatography–ultraviolet (LC–UV) systems for ultrafast analysis.
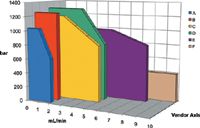
Figure 2: UHPLC instrument specifications: Five different UHPLC instrument brands (AâE) are shown compared in pressure limit and flow rate range to a classic or traditional 400 bar instrument (F).
In late 2004, commercial UHPLC instruments began to appear with higher pressure specifications over a reduced flow rate range, as shown in Figure 2 for five different vendors. A traditional HPLC instrument is included for comparison (labelled "vendor F"). As well as having components rated for higher operating pressure, UHPLC instruments feature much smaller volumes in the sample flow path and greatly reduced instrument bandwidth. Table I summarizes changes that have occurred in UHPLC instruments to meet the pressure and performance needs of modern columns with small particles operated at high flow velocities.

Table I: Changes in UHPLC versus traditional HPLC instruments
The performance of a modern UHPLC system (column plus instrument) is shown in Figure 3 for a 5-cm core-type column at two flow rates. Chromatogram A shows a 0.8 min separation with 11,000 plates (220,000 N/m) under optimum conditions at 0.6 mL/min while chromatogram B shows a 15 s separation with a very small loss of performance at 2.0 mL/min, which is made possible by the flat van Deemter plot in Figure 1. Note that peaks in run B are only about 1 s wide and elute in a volume of about 30 uL (measured by width at base). In this case, a normally fast detector response time of 0.1 s and data collection rate of 10 Hz may be too slow for accurate analysis. Users should investigate how detector and data system electronic settings affect efficiency, resolution and sensitivity for ultrafast separations.
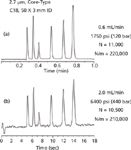
Figure 3: Ultrahigh speed UHPLC separation: 2.7-μm core-type C18 column, 50 mm à 3 mm i.d.; elution order: uracil, phenol, acetophenone, benzene, toluene, naphthalene; run (a) can be accomplished on a traditional HPLC instrument; run (b) requires a UHPLC instrument; both require very low instrument dispersion.
Direct Measurement of Instrument Dispersion
Excessive instrument dispersion and injection of large sample volumes are major operational problems that can rob LC systems of performance. Gritti and Guiochon have published detailed articles about extracolumn band-broadening effects (11,12). Dong (13) proposed measurement of instrument bandwidth to characterize instruments and allow the problem to be identified and addressed. Figure 4 describes how to measure instrument bandwith (IBW) by replacing the column with a very low volume union. By injecting a very small sample (≤ 1 μL) and recording an instrument peak at fast detector response time, one can estimate peak width at base in microliters at several operating conditions. A more accurate value for IBW can be obtained from a data system efficiency report and solving for σ in the equation, N =tR2/σ2, where retention time is converted to elution volume in microliters. Users can modify traditional instruments to approach UHPLC instruments in IBW, but not in pressure. Figure 5 shows that detector response setting can significantly impact measured instrument bandwidth.
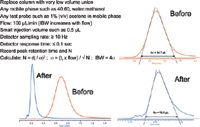
Figure 4: Measurement of instrument bandwidth, IBW: Two important elements of dispersion can be learned by sample injection with no column: 1) the internal volume of sample flow path can be estimated from retention time and flow rate; before optimizing, sample retention was 0.70 min à 100 μL/min = 70 μL; after optimizing, retention was 0.22 min à 100 μL/min = 22 μL; instrument bandwidth (width at base, 4Ï) was estimated manually to be 44.7 μL and 13.1 μL, respectively.
Scott has studied instrument dispersion extensively (14) and published a relationship derived from the Taylor-Aris equation:

where F is flow rate (mL/min), r is tube radius (cm), L is length of tubing path (cm) and D is solute diffusion coefficient (cm2/s), which changes with solute structure and solvent viscosity. Figure 6 plots band spreading (σ) for different lengths of tubing at several flow rates and tube diameters. Volume has been converted from milliliters to microliters for easier comparison to IBW. Just a few cm of 0.25 mm (0.010 in.) tubing can contribute more dispersion than the total amount present in a modern UHPLC instrument.

Figure 5: Peak broadening caused by slow detector electronics: IBW should be measured at several flow rates to match assays; measuring IBW at 1 mL/min is a tough test for a detector; at least 0.1 s and 20 Hz may be needed; users should confirm accuracy by changing settings as shown to determine whether results are affected; lowest IBW is the true instrument value.
Clearly, one should not try to optimize any other component in traditional instruments until the column connection tubing is reduced to 0.005-in. i.d. or smaller. Virtually all UHPLC instruments use smaller tubing than 0.005 in. Equation 6 is not highly accurate because there are unknown and uncontrolled variables (including temperature) in the high velocity sample flow path outside the column; however, the plots should be qualitatively correct and confirm that connection tube diameter is very critical to determining instrument dispersion. Connector length should also be reduced. Figure 7 illustrates that IBW increases significantly with flow rate, but flow rate is dictated by the column and method and cannot be optimized. IBW values should be recorded over a range of flows if instruments are to be evaluated and ranked for performance. IBW will improve at elevated temperature because solute diffusion rate increases, which is a possible argument for conducting UHPLC at higher temperature. Fountain and colleagues published a detailed paper about optimizing extracolumn effects in the design of a modern UHPLC instrument (15).
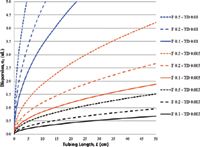
Figure 6: Dispersion caused by different tubing diameters: The use of 0.010-in. (0.25 mm) i.d. tubing in modern HPLC is clearly unacceptable because of excessive dispersion; note that tubing dispersion increases dramatically with tube diameter (TD) and substantially with flow (F); short lengths of 0.004â0.005-in. tubing are reasonable compromises between low dispersion and high flow resistance to optimize instrument IBW for good system performance.
Although dispersion decreases rapidly as tubing diameter becomes smaller, one must exercise restraint because pressure drop across that component increases rapidly. The Hagen-Poiseuille equation of pressure with flow is:

where F is flow rate, P is pressure, η is viscosity and r is tube radius (all in cgs units). The result is that UHPLC instruments achieve very low dispersion at the expense of high background pressure. Instrument back pressure makes the use of pressure to diagnose column blockage more complicated. Figure 8 shows the relative pressure that exists across a popular UHPLC instrument for several column and flow rate situations.
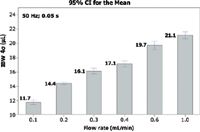
Figure 7: Effect of flow rate on measured IBW: IBW is often measured at low flows to show lowest values, but IBW increases with flow rate (equation 6); IBW measurement is rapid and should be made at several flows; two instrument designs may show differences in IBW flow sensitivity.
Detecting Excessive Instrument Dispersion
Sometimes the existence of excessive dispersion is obvious when high column efficiency measured with an optimized instrument is lower by 50% or more when the same column is installed on another, often older, instrument. Chester published (16) useful guidelines for optimizing a traditional HPLC instrument to allow use of a column with 2.7-μm, core-type particle. Solid-core particles can match the performance of smaller porous particles and operate at significantly lower pressure to permit use of optimized traditional instruments.
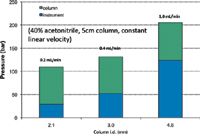
Figure 8: Breakdown of pressure drop in a UHPLC system: Flow resistance of column versus instrument is shown for 5-cm columns with three different column internal diameters in acetonitrile/water (40:60); note that the highest flow rate of 1.0 mL/min creates more pressure across the instrument than the column because of very low dispersion instrument components.
Performance of a 10-cm column with solid-core particles had already been measured by Chester at 24,000 plates (240,000 N/m) using a UHPLC instrument. When the column was installed in a traditional HPLC instrument with factory tubing, Chester measured low system efficiency of 8500 plates and estimated that the instrument was contributing more (ca. 70%) to peak width than the column (ca. 30%). He reported that IBW came almost entirely from column inlet and outlet tubing plus an unnecessary column selector valve. After changing system column tubing from 0.25-mm (0.010 in.) i.d. to 0.12-mm (0.005 in.) i.d. and removing the selector valve, Chester reversed the ratio to 70% bandwidth from column and 30% from instrument, with only about 8% of total bandwidth contributed by the tubing. System efficiency rose to over 20,000 plates. Modifying other components such as detector flow cell and heat exchanger tubing were not as convenient, but this performance level was quite acceptable to make the traditional instrument usable with high performance 4.6-mm i.d. columns. Chester's optimization approach could also be used for sub-2-μm porous particles in shorter columns to stay within 400 bar pressure limits. Gritti and colleagues (17) have recently published an article about optimizing traditional HPLC instruments for use with modern columns.
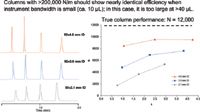
Figure 9: Detection of instrument dispersion using N vs. k plots: Peaks are clearly getting broader and system is losing efficiency as column i.d. becomes smaller; if columns are known to have about equal performance, this indicates too much instrument dispersion; after reduction of internal volume, plots should nearly overlay one another; traditional instruments can be optimized to perform very well with 4.6-mm-and 3.0-mm i.d. columns, but UHPLC designs will be essential to maintain performance with 2.1 mm and smaller columns.
There are several ways to detect the existence of excessive instrument dispersion without comparing it to an optimized instrument. Good methods involve the injection of small volumes of a multicomponent mixture. In one case, a column is installed and sample is injected with several resolved components from k = 1 to about k = 5. A plot of N vs k reveals excessive extracolumn dispersion in peaks with lower k values because they elute in smaller volumes and become a difficult test for the instrument. If the instrument has low variance compared to column peak variance (optimized traditional HPLC and UHPLC), all peaks should show nearly the same high efficiency. As instrument variance increases, early peaks will show reduced plates, but later peaks will still show close to the expected or true column efficiency for that particle. Figure 9 shows results with three columns. This instrument should be considered adequate for using short 4.6-mm i.d. columns, but it would be very marginal for using short 3-mm i.d. columns, and would not be suitable at all for using 2.1- mm i.d. columns. UHPLC instruments and those with very low IBW should plot with a nearly straight line for all three column internal diameters; even low dispersion instruments will likely show reduced efficiency with smaller i.d. columns at low k values. For a fair test of IBW, injection volumes should be reduced in proportion to void volume as column internal diameter is reduced.
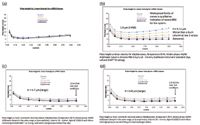
Figure 10: Detection of instrument dispersion using van Deemter plots with a multicomponent sample: (a) shows a plot for 50 mm Ã 4.6 mm column with 3.0-μm Zirconia-PBD column using a traditional HPLC instrument, where all five solute data plots overlay; this instrument with factory configuration has low enough dispersion to have negligible impact on efficiency, which is just noticeable for the shortest k (benzene) peak (lowest peak volume); (b) shows the same plot for a 50 à 4.6 mm column with 1.9-μm Zirconia-PBD column, where plots no longer overlay; this same factory instrument is therefore not suitable for this column because instrument dispersion is too large for the narrower peaks; (c) shows improvement created by adding a micro flow cell and replacing 0.007" tubing with 0.005" tubing to reduce dispersion to an acceptable level; (d) shows the effect of adding a short length of heat-exchange tubing to allow separation at elevated temperature; the instrument is now adequately optimized to perform an ultrahigh speed drug assay.
A van Deemter plot reveals valuable information about the measuring instrument when multiple component samples are studied. Figure 10a shows a fast separation of five components on a 5 cm × 4.6-mm column with 3-μm Zr-PBD (Zirchrom) particles at increasing flow rates. A 400 bar instrument with factory tubing and flow cell configuration was used. Note that all five solutes show the same high performance as indicated by curves that overlay at an approximate plate height of Hmin = 6 μm (the expected value for this particle size). Only the earliest eluting benzene peak shows slightly higher H (lower N) which indicates that this instrument has small enough variance to be suitable for use with this column. Figure 10b shows the same experiment with a column containing 1.9 μm Zr-PBD particles. Note that the sub-2-μm column seems to be worse than the 3-μm column with a range of Hmin values from 5–12, but another explanation is that instrument variance is not optimized for this higher performance column. Figure 10c shows the experiment repeated with the same column after replacing a standard flow cell with micro flow cell and factory tubing (0.007-in. i.d.) with 0.005-in. i.d. tubing. Figure 10d shows results when a short length of heat exchange tubing was added to allow elevated temperature operation. An ultrafast drug separation at high flow rate and elevated temperature is shown in Figure 11 at two different detector response times. The assay was significantly improved under these conditions by changing response time from 0.5 s in 10a to 0.1 s in 10b. The data collection rate was 10 Hz in A and 20 Hz in B. Further column efficiency improvements might have been possible by optimizing the sample injection volume of 5 μL.
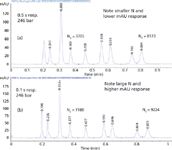
Figure 11: Ultrahigh-speed separation of β-blocker drugs with optimized traditional instrument: (a) 1-min. separation was performed with a Zirconia-PBD 50 mm Ã 4.6-mm i.d. column, acetonitrile/water, pH 12 buffer, 2.5 mL/min and 75 °C; increasing UV detector response from 0.5â0.1 s improved system efficiency and increased signal from 130 mAU to 180 mAU for peak 3.
Scott reported the following relationship for maximum injection volume:

where L is column length, dp is particle diameter, and r is column radius (cgs units). Scott defined the maximum volume as that which would cause a 5% increase in σ, which in turn would cause a 10% decrease in plates because N = (tr/σ)2. Scott also assumed a case where peaks elute at or near the void volume. Note in Figure 12 that a plot of Vmax (μL) indicates that a 5 μL injection is often too large for sub-2-μm particle columns without sacrificing efficiency. To estimate maximum injection volume for well retained peaks, one should multiply by (1 + k). Users should try very small injection volumes to achieve benchmark column efficiency and resolution for any separation with shorter columns, small internal diameter geometry, and small particles. Injection volumes larger than the maximum can be made without loss of efficiency by using weak sample solvents and step or programmed gradients to focus the sample on the column before separation. Like cryofocusing in GC, this method can be used in LC to completely eliminate precolumn dispersion and greatly facilitate analysis. This focusing technique for injecting large samples should be especially valuable for detection of trace impurities.
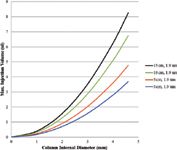
Figure 12: Maximum injection volume: True column efficiency for short, high performance columns can only be measured by injecting sample volumes in the low μL range; users should experiment with injection of different volumes to determine the effect on efficiency and resolution; allowable sample volume increases for longer columns and peaks that are well retained; sample injection volume will usually impact the resolution of an early eluting pair; weak solvent injection and use of mobile phase gradients can provide a convenient solution.
Conclusions
Some important advantages and challenges of practicing modern HPLC or UHPLC have been described. Major changes have occurred recently, so it is difficult to predict the future trend in HPLC column and instrument design until users gain more experience. It is very unlikely that HPLC users will return to using larger particles after experiencing ultrahigh performance; however, they should not abandon proven 3–5-μm particle columns and the installed base of reliable, traditional instruments until replacement products have been completely proven in use. An important question is whether we may have gone so high in pressure that frictional heating makes accurate temperature control no longer possible with standard column dimensions and current oven designs. The popularity of microbore and capillary columns may increase because of need for faster thermal equilibration. Another good question is whether higher operating pressure will affect UHPLC method accuracy and ruggedness. Several improvements are desirable: (1) better control of column temperature, (2) independent monitoring of column and instrument pressure without adding to instrument dispersion, and (3) improved fittings and accessories that can be installed many times with any column design over the full pressure range of UHPLC instruments.
Experience with sub-2-μm porous particles and higher operating pressure has also generated much interest in core-type particles and monoliths that can deliver high performance at significantly lower pressures. It remains to be seen which type of column particle will become preferred to achieve reliable ultrahigh performance. While beyond the scope of this article, important UHPLC papers have also been published about kinetic plots and sample throughput performance with modern particle and column designs (18,19), and throughput advantages of UHPLC columns and instruments are being demonstrated outside of reversed-phase mode for the separation of enantiomers (20,21).
Acknowledgement
The authors appreciate very helpful review comments by Professor Francesco Gasparrini (Francesco.Gasparrini@uniroma1.it) and Dr. Dorina Kotoni (dorina.kotoni@uniroma1.it), Dept. of Drug Chemistry and Technologies, Sapienza University of Rome, Rome, Italy.
References
(1) N.D. Danielson and J.J. Kirkland, Anal. Chem. 59(20), 2501–2506 (1987).
(2) J.W. Jorgenson, Anal. Chem. 76, 5777–5786 (2004).
(3) J.W. Jorgenson, Annu. Rev. Anal. Chem. 3, 129–150 (2010).
(4) R.M. Seifar, J.C. Kraak, W.T. Kok, and H. Poppe, J. Chromatogr. A 808, 71–77 (1998).
(5) J.J. Kirkland, J. Chromatogr. Sci. 38, 535–544 (2000).
(6) M.E. Swartz, J. Liq. Chromatogr. Rel. Technol. 28, 1253–63 (2005).
(7) F. Gritti and G. Guiochon, J. Chromatogr. A 1228, 2–19 (2012).
(8) R.E. Majors, LCGC North America 21(12), 1124–1133 (2003).
(9) A. Klinkenberg in Gas Chromatography 1960, R.P.W. Scott, Ed. (Butterworths Scientific Publications, London, 1960), p. 194.
(10) R.A. Henry and D.S. Bell, LCGC North America 23(5), 2–7 (2005).
(11) F. Gritti and G. Guiochon, J. Chromatogr. A 1218, 4452–4461 (2011).
(12) F. Gritti and G. Guiochon, J. Chromatogr. A 1218, 4632–4648 (2011).
(13) M.W. Dong, Modern HPLC for Practicing Scientists (Wiley-Interscience, New York, 2006).
(14) R.P.W. Scott and J. Cazes, Chromatographic Theory (Marcel Dekker AG, Basel, 2002).
(15) K.J. Fountain, U.D. Neue, E.S. Grumbach, and D.M. Diehl, J. Chromatogr. A 1216, 5979–5988 (2009).
(16) T.L. Chester, American Laboratory 41(4), 11–15 (2009).
(17) F. Gritti, C.A. Sanchez, T. Farkas, and G. Guiochon, J. Chromatogr. A 1217, 3000–3012 (2010).
(18) G. Desmet, D. Clicq, and P. Gzil, Anal. Chem. 77, 4058–4070 (2005)
(19) P.W. Carr, X. Wang, and D.R. Stoll, Anal. Chem. 81, 5342–5353 (2009).
(20) D. Kotoni, A. Ciogli, C. Molinaro, I. D'Acquarica, J. Kocergin, T. Szczerba, H. Ritchie, C. Villani, and F. Gasparrini, Anal. Chem. 84, 6805–6813 (2012).
(21) D. Kotoni, A. Ciogli, I. D'Acquarica, J. Kocergin, T. Szczerba, H. Ritchie, C. Villani, and F. Gasparrini, J. Chromatogr. A 1289, 226–241 (2012).
Richard A. Henry is a consultant based in Pennsylvania. Email: rhenry@psualum.com. Hillel K. Brandes is a Principal R&D Chemist at the Supelco Division of Sigma Aldrich Corporation, Pennsylvania. Email: hillel.brandes@sial.com. Daniel T. Nowlan is a Senior Research Scientist at ZirChrom Separations, Inc. and SarTec Corporation, Minnesota. Email: danielnowlan@zirchrom.com. John W. Best, is President of Best Instrument, Inc., Pennsylvania. Email: john@best-instrument.com.

Accelerating Monoclonal Antibody Quality Control: The Role of LC–MS in Upstream Bioprocessing
This study highlights the promising potential of LC–MS as a powerful tool for mAb quality control within the context of upstream processing.
Using GC-MS to Measure Improvement Efforts to TNT-Contaminated Soil
April 29th 2025Researchers developing a plant microbial consortium that can repair in-situ high concentration TNT (1434 mg/kg) contaminated soil, as well as overcome the limitations of previous studies that only focused on simulated pollution, used untargeted metabolone gas chromatography-mass spectrometry (GC-MS) to measure their success.
Prioritizing Non-Target Screening in LC–HRMS Environmental Sample Analysis
April 28th 2025When analyzing samples using liquid chromatography–high-resolution mass spectrometry, there are various ways the processes can be improved. Researchers created new methods for prioritizing these strategies.
Potential Obstacles in Chromatographic Analyses Distinguishing Marijuana from Hemp
April 28th 2025LCGC International's April series for National Cannabis Awareness Month concludes with a discussion with Walter B. Wilson from the National Institute of Standard and Technology’s (NIST’s) Chemical Sciences Division regarding recent research his team conducted investigating chromatographic interferences that can potentially inflate the levels of Δ9-THC in Cannabis sativa plant samples, and possible solutions to avoid this problem.

.png&w=3840&q=75)

.png&w=3840&q=75)


.png&w=3840&q=75)


.png&w=3840&q=75)


