When Peaks Collide
LCGC North America
This month's "GC Connections" addresses the effects of two overlapping tailing peaks on peak resolution and quantitation.
The goal of quantitative chromatography is to separate two or more substances sufficiently so that they can be measured with a desired degree of accuracy and precision. The resolution of a peak pair provides a standardized measurement of the extent of a separation but strictly speaking, resolution is defined only for two Gaussian peaks of equal size. This month's "GC Connections" discusses resolution and the effects that relative peak size have on area measurements.

John V. Hinshaw
Resolution
The resolution of a pair of adjacent peaks is defined in the chromatographic literature and in standard nomenclatures such as IUPAC (3) or ASTM E355 (4) as follows:

For a Gaussian shaped peak the width at half-height is related to the width at base by a factor of 1.699:

It is usually more convenient to calculate resolution from the width at half-height of the second peak using this related formula:

The width at half-height is more easily measured than the width at base, and it is measured and used by many chromatography data-handling systems in, for example, system suitability calculations. The width of the second peak is used because it generally will be either equal to or slightly greater than the first peak's width and thus, produces a the more conservative result while not requiring measurement of the widths of both peaks.
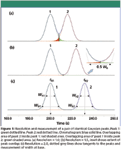
Most chromatographers are familiar with the appearance of partially resolved, baseline resolved, and fully resolved peak pairs. Figure 1 shows an ideal pair of generated Gaussian peaks of equal sizes and widths with partial resolution at Rs = 1.0 (Figure 1a), baseline resolution at Rs = 1.5 (Figure 1b), and full resolution at Rs = 2.0 (Figure 1c). In this illustration, resolution increases as the separation between the peaks increases, while the same peak shape is maintained. Keeping the same separation while decreasing the peak widths also would increase their resolution proportionately. Figure 1c illustrates the relationship between the peak width at half-height and base, and it also shows how the width at base is determined from the baseline intersection points of lines drawn tangent to the peak's upward and downward slopes. A common misconception is that the width of a peak at base is the time between when the peak starts to rise above the baseline until it subsides back into the baseline — the peak integration start and stop times — but in fact, the base width of a Gaussian peak is measured at 13.4% of the peak height above the baseline, at the times corresponding to the tangent–baseline intersection points.

Figure 1
Table I lists the retention times, peak width measurements, and resolution for the three cases shown in Figure 1.

Table I: Resolution measurements from Figure 1. (a), (b), and (c) refer to the parts of Figure 1.
At resolution of 1.0 the valley point between the peaks corresponds with the end of the first peak's base width and the start of the second peak's base width. At baseline resolution, where Rs = 1.5, the ending and starting base widths of the first and second peaks, respectively, are separated by 0.5 times the base width. At resolution 2.0, the ending and starting base widths of the first and second peak are each spaced at intervals equal to the base width.
Peak Identification: The identification of specific peaks by their retention times becomes more certain as resolution increases. It is possible to identify peaks on the basis of a partial separation, but the certainty of identification improves with increasing resolution. The detector signal comes closer to baseline between the peaks and the presence of additional components becomes more apparent. A mass-selective detector helps to identify merged peaks on the basis of their mass spectra, but closely eluted peaks often are isomeric or otherwise chemically similar. They may have similar spectra that preclude unambiguous identification by spectral library matching.
Each component in a group of two or more merged peaks should be identified with separate analyses of the pure components, and the influence of matrix components should be determined through blank injections. Bear in mind, too, that the elution order of close peaks will be influenced by changes in the column temperature conditions: a change in temperature program rate of as little as 2 °C/min can reverse elution order. When faced with the partial resolution of a critical peak pair, or with the presence of a new matrix compound that interferes, make sure that the current separation conditions are optimal and then consider upgrading the column resolving power by installing a longer or narrower-bore column. If all else fails, then try changing to a different stationary phase that better separates the peaks of interest.
Quantitative Analysis: Measurement of a partially resolved peak pair can be difficult to achieve with acceptable levels of accuracy. The simple but unrealistic case of two equal-sized peaks is a good starting point for understanding the effects that colliding peaks have on quantitative analysis. Both the influence of the portion of one peak that extends into another and the effects that merged peak shapes have on peak integration play strongly into the accuracy of quantitative measurement of merged peaks.
Returning to Figure 1, the degree of area overlap of the coinciding portions of the peaks decreases as resolution increases. At Rs = 1.0 in Figure 1, the contribution of either peak to the other's total area is about 2.3%, as measured from where a vertical dividing line for peak area integration is dropped from the valley point between the two peaks to the baseline. I measured the overlap areas with a measurement tool in my data system for the first generated peak alone by starting at the time of the valley point, which corresponds with the end of the peak's wb segment, and extending to the end of the peak. In this case, the peaks are symmetrical and identical so the overlap and total areas are the same for each.
The overlapping areas are highlighted in color in Figure 1a and in the inset in Figure 1b. As the resolution increases to 1.5 — baseline resolution — the overlap between the two peaks drops toward 0.1%, and at a resolution of 2.0 no measurable overlap remains. Table II gives the area measurements from Figure 1. The values for each peak are very close to the known areas as set when the peaks were generated.

Table II: Peak area measurements from Figure 1. Overlap is the amount of area or percentage of one peak into the other. (a), (b), and (c) refer to the parts of Figure 1.
In this idealized situation, there is no significant error between the measured and known peak areas, even down at a resolution of 1.0. However, real peaks are not equal in area and width because their amounts, detector response factors, and shapes vary. Also, real-world peaks incorporate uncertainty in their measurement due to injection variability, detector noise, and slight shifts in retention time from run to run. It is instructive to consider what happens when one peak is considerably larger than the other and what the effects imply about the influence of peak resolution on quantitative analysis.
Unequal Peak Sizes
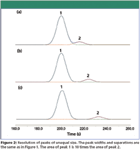
Increasing the size of the first peak in our example affects both the peak separation and area measurements. The disparity in peak sizes changes the degree of peak overlap, but more significantly, it has a profound effect on quantitative measurements. Figure 2 shows the same three cases as in Figure 1, but the first peak is now 10 times larger. A question arises of whether the classical resolution measurement, which is based upon two equal-sized peaks, is applicable when the peak sizes are significantly different.

Figure 2
We can use the degree of area overlap between the peak pair as an indicator of the degree of peak resolution, and compare the case of equal-sized peaks to that of unequal peaks. Looking first at Figure 2a (the case of partial resolution of 1.0 of peaks with a size ratio of 10:1), the first peak's percentage of overlap into the second, as listed in Table III, is similar to that of a pair of equal-sized peaks when there is a simple vertical division between the two peaks at the valley point. In the case of baseline resolution, in Figure 2b, Table III lists the overlap of the larger first peak into the smaller second peak at 0.31% of the second peak's area, while the second peak's overlap into the first is only 0.06%.

Table III: Peak areas and overlap of unequal peaks. Overlap is the amount of area or percentage of one peak into the other. (a), (b), and (c) refer to the parts of Figure 2.
The overlap for the unequal peaks is small and similar to the degree of overlap of 0.14% for a pair of equal-sized peaks, however, so the definition of the resolution of equal-sized peaks seems to extend to at least at a peak area ratio of 10:1. In the case of resolution equal to 2.0, in Figure 2c, there is no measurable influence of either peak on the other: they are indeed fully resolved and independent.
Quantitative area measurements in the case of baseline or better resolution of unequal peaks are fairly accurate. The measured and known areas in Table III for cases of baseline resolution (Figure 2b) and full resolution (Figure 2c) compare very well. Going from a 1:1 area ratio to a 10:1 area ratio with a pair of peaks at baseline resolution or better should yield a nearly linear trend between peak size and measured area. At some point, as the area ratio increases above 10:1, however, the degree of influence of the larger peak on the smaller one's measured area will become significant and the linear relationship between peak size and measured area will break down. Greater resolution between the peaks will raise this ceiling on linearity.
At a partial resolution of Rs = 1.0, the story is quite different. Now, there is a much larger overall error in measured area counts with a peak size ratio of 10:1, which was not hinted at when only the similar degree of area overlap for equal and nonequal peak sizes was considered. Not surprisingly, the largest errors occur for the smaller peak.

Figure 3
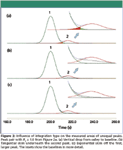
The error level depends strongly upon the type of baseline allocation selected for the data system. Figure 3 illustrates three common choices. First is a simple vertical separator dropped from the valley point to the baseline, which we've used throughout this discussion thus far, shown in Figure 3a. This choice produces an error of about +1 % for the larger peak, while the smaller peak comes back with an area that's about 10% smaller than the known amount, as listed in the first line of Table IV. This effect is seen graphically in the inset of Figure 3a, where the relative amount of the second peak that's overlapped into the first is a significant fraction of the second peak's size.

Table IV: Influence of integration type on areas of partially resolved unequal peaks Rs = 1.0. (a), (b), and (c) refer to the parts of Figure 3.
A tangent skim baseline choice puts a straight line at the valley point and tangential to its intersection with the declining side of the smaller peak. When a tangent skim is selected, the error in the second peak's area becomes unacceptably huge at –63%. This effect is visualized easily by examination of the inset in Figure 3b, where a very large portion of the second peak is lost into the area of the first. This shift of area also biases the first peak's area upward by 4.5%.
Finally, using an exponential skim or curve fit off of the first peak reduces the error relative to the tangent skim, but for the second peak the loss of area is still very large at –31%. Looking at the inset in Figure 3c, the curve-fit of the exponential skim to the first peak is fairly good and overestimates the peak size by only 1%. The loss of a significant portion of the second peak is obvious.
The errors associated with these three different baseline allocation choices depend on the relative sizes of the peaks and their resolution. What I've shown here is just a snapshot of one artificial situation. Chromatography data-handling systems include conditional code that allows users to select boundaries for cases in which different baseline allocations are to be applied, based upon relative peak heights, valley points, and other parameters. This means that the choices for baseline allocation must be made carefully and validated across the entire targeted range of analyte concentrations.
Conclusion
The resolution of a pair of Gaussian chromatographic peaks provides a useful metric for gauging the ability to achieve reliable qualitative peak identification as well as predicting the accuracy of area measurement. As long as peak resolution is at baseline or better levels, quantitative errors can be very low, even for adjacent peaks at size ratios up to 10 to 1. When the resolution falls below the baseline level, the measurement of peak areas becomes difficult. Careful choices for area integration in data-handling systems can minimize the errors, but must be checked across the entire operating range of a method. Selecting conditions and columns that better resolve critical peak pairs can be a better choice than relying upon the data system's rules of area integration to slice away partially resolved peaks from each other.
John V. Hinshaw "GC Connections" editor John V. Hinshaw is senior Research Scientist at Serveron Corp., Hillsboro, Oregon, and a member of LCGC's editorial advisory board. Direct correspondence about this column to LCGC, Advanstar Communications, 485 Rt. 1 S, Bldg F, 1st Floor, Iselin, NJ 08830, or contact the author via e-mail:lcgcedit@lcgcmag.com.
References
(1) J.V. Hinshaw, LCGC North America 27(5), 402–413 (2009).
(2) J.V Hinshaw, LCGC North America 27(7), 542–549 (2009).
(3) A.D. McNaught and A. Wilkinson, IUPAC Compendium of Chemical Terminology (International Union of Pure and Applied Chemistry, Research Triangle Park, North Carolina 27709-3757, USA, 1997).
(4) "ASTM E355-96 (2007) Standard Practice for Gas Chromatography Terms and Relationships," Annual Book of Standards, Vol. 03.06 (ASTM International, American Society for Testing and Materials, Conshohocken, Pennsylvania).

Detecting Hyper-Fast Chromatographic Peaks Using Ion Mobility Spectrometry
May 6th 2025Ion mobility spectrometers can detect trace compounds quickly, though they can face various issues with detecting certain peaks. University of Hannover scientists created a new system for resolving hyper-fast gas chromatography (GC) peaks.
Altering Capillary Gas Chromatography Systems Using Silicon Pneumatic Microvalves
May 5th 2025Many multi-column gas chromatography systems use two-position multi-port switching valves, which can suffer from delays in valve switching. Shimadzu researchers aimed to create a new sampling and switching module for these systems.
New Study Reviews Chromatography Methods for Flavonoid Analysis
April 21st 2025Flavonoids are widely used metabolites that carry out various functions in different industries, such as food and cosmetics. Detecting, separating, and quantifying them in fruit species can be a complicated process.

.png&w=3840&q=75)

.png&w=3840&q=75)


.png&w=3840&q=75)


.png&w=3840&q=75)


