Simultaneous Headspace-GC–FID Analysis for Methanol and Ethanol in Blood, Saliva, and Urine: Validation of Method and Comparison of Specimens
LCGC North America
An HS-GC-FID method for the determination of ethanol and methanol content in biological fluids is presented.
Evaluation of ethanol in biological samples such as blood, urine, and saliva is requested frequently for legal purposes such as driving under the influence, postmortem alcohol evaluation, and so forth. (1,2). Ethanol intake also has been associated with violent death (3,4). In addition, recently methanol determination has gained a great deal of importance and has become an interesting scientific area with regard to unintentional oral ingestion by food and beverages causing blindness, coma, and death by respiratory and cardiac arrest (5).
Methanol and ethanol testing has been done by using blood as the biological material for years. However, there is increasing interest in urine and saliva as a biological specimen because both are obtained in a noninvasive way (6). No significant endogenous ethanol production is observed in urine from healthy patients (7). Furthermore, postmortem ethanol production in urine is less when compared with blood, because negligible quantities of glucose are excreted in urine from individuals having normal carbohydrate metabolism. However, the probability of diabetes must always be kept in mind (8). The concentration of ethanol in saliva accurately reflects blood ethanol concentration as the ratio of the blood flow to the tissue mass of the salivary gland is high (9).
Numerous chemical and enzymatic methods have been described to determine volatiles in biological materials (10). Furthermore, chromatographic methods certainly stand out with higher precision (11). For instance, liquid chromatography (LC) still has been used as an analytical technique for the assessment of ethanol in matrixes other than human specimens, as well (12). On the other hand, combining ease of application with precision gas chromatography (GC) equipped with headspace is the most reliable method in use (13–15).
Extraction is the most important step for an analytical procedure for separation of the organic compound from the biological material. Regarding the volatile compounds, such as alcohols, headspace-GC analysis allows direct injection of specimens and is the most common procedure used (14). On the other hand, in this technique, depending upon the sample matrix, the resulting data can vary mildly, which is explained by matrix effect (16).
In this study, a simultaneous and reliable headspace-GC–flame ionization detection (FID) method was validated to establish methanol and ethanol assessment in blood, urine, and saliva as a routine forensic–toxicological analytic application. In addition, the influence of the specimen matrix onto the chromatographic response was also investigated for each of the biological fluids used for routine analysis. Therefore, the main purpose and the novelty of this article fundamentally depends upon validation and comparison of specimens in this respect.
Experimental
Materials and Instrumentation: GC-grade methanol, ethanol, and n-butanol were obtained from Merck (Gernsheim, Germany). Headspace vials were purchased (Agilent Technologies, Palo Alto, California). GC was performed on an HP 6890 series II gas chromatograph (Agilent Technologies) with a flame ionization detector. The system was equipped with an HP 7694 E Headspace Sampler (Agilent Technologies). A 30 m × 320 µm, 0.25-mm df HP-Innowax (Agilent Technologies) column was used. Headspace conditions were adjusted according to the parameters described in the study conducted by Wasfi and colleagues (15). Vial equilibrium time was set to 10 min. The sample volume was 1 mL and sample loop was 3 mL in volume. Headspace oven temperature, sample loop temperature, and transfer line temperature were fixed to 70 °C, 80 °C, and 90 °C, respectively, to avoid the possibility of condensation until injection. The GC oven temperature was held constant at 110 °C for 6 min. The GC system had an injection temperature of 180 °C and a detector temperature of 250 °C.
Collection of Biological Specimens: All biological specimens were collected by the volunteer laboratory crew of Ankara University Institute of Forensic Medicine. For collection of saliva and urine, clean polypropylene vessels were used by each volunteer; urine and saliva samples were collected, providing a pool. Blood samples from each volunteer were collected in anticoagulant tubes and pooled prior to analysis. Each pooled specimen was mixed by vortex before use. All specimens were kept at +4 °C until the time of analysis.
Sample Preparation: Blank specimens (namely water, blood, urine, and saliva) (800 µL) were placed into clean glass headspace vials containing 100 µL of 800 mg/dL n-butanol as internal standard (IS). In the next step, 100 µL of ethanol and methanol standards was spiked, yielding concentrations of 50, 100, 200, 300, and 400 mg/dL. The total volume was 1 mL, achieving an IS concentration 10 times diluted to 80 mg/dL. Each vial was sealed with a rubber cap and an aluminum crimp seal immediately after addition of the methanol and ethanol standards. Calibration standards were prepared five times for each specimen at each concentration. The precision within-run and between-run tests were performed with five replicates at concentrations of 50, 200, and 400 mg/dL. For evaluations of recovery, 200 mg/dL was chosen as mid-concentration and 10 replicates of this concentration were tested.
Evaluation of Analytical Signal: To overcome the risks of any artifacts during analysis, the IS was used. Thus, peak areas were measured and calculations were carried out considering peak ratios of analyte to IS.
Results and Discussion
Validation: The method for each specimen was validated fully, as were previous validation studies (17), to follow criteria in agreement with ICH guidelines (18).
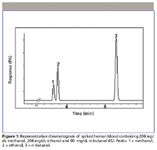
Specificity and Selectivity: The method demonstrated excellent chromatographic specificity with no endogenous interference at the retention times of, methanol, ethanol, and the IS (3.78, 3.61, and 5.30 min, respectively). The representative chromatogram of blood spiked with ethanol and methanol is displayed in Figure 1. Retention times for other specimens observed exactly the same revealing lack of matrix affect on retention time and duration of the analysis.

Figure 1: Representative chromatogram of spiked human blood containing 200 mg/dL methanol, 200 mg/dL ethanol and 80 mg/dL n-butanol (IS). Peaks: 1 = methanol, 2 = ethanol, 3 = n-butanol.
Linearity: After establishing the chromatographic conditions, separate calibration curves were prepared for each specimen at ethanol and methanol concentrations of 50–400 mg/dL. For each concentration, five individual replicates were injected and linearity was obtained with the correlation coefficients (r2) equal to 0.998 and 0.999, respectively, for methanol and ethanol in all biological specimens.
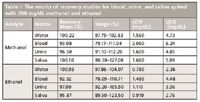
Recovery: The recovery tests of this analytical procedure were performed by spiking blank water, blood, urine, and saliva specimens with 200 mg/dL of methanol and ethanol. A recovery rate of over 90% was obtained, and the recovery results are shown as percentages and ranges in Table I.

Table I: The results of recovery studies for blood, urine, and saliva spiked with 200 mg/dL methanol and ethanol
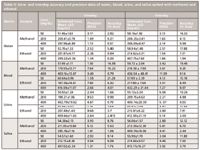
Precision and Accuracy: Precision, defined as relative standard deviation (RSD), was determined by five individual replicates at three different concentrations (n = 5). Accuracy, defined as % bias, was also determined at the same concentrations (n = 5). Intraday and interday accuracy and precision studies were carried out as well. Samples solutions of biological specimens were freshly prepared on the same day (intra) and on five consecutive days (inter). Detailed data of accuracy and precision studies are tabulated in Table II.

Table II: Intra- and interday accuracy and precision data of water, blood, urine, and saliva spiked with methanol and ethanol
Limit of detection and quantification: The limit of detection (LOD) and lowest limit of quantification (LOQ) were determined based on the standard deviation of the response and the slope of the calibration curve, according to ICH guidelines (18) (LOD = 3.3 σ/S, LOQ = 10 σ/S, where σ is the standard deviation of the response and S is the slope of the calibration curve). Table I shows LOD and LOQ values of methanol and ethanol calculated for water, blood, urine, and saliva.
Comparison of Specimens and Matrix Effects: Regarding different specimens, dissimilarities in resulting data of validation parameters (Table I and Table II) were observed. Intraday studies showed that for methanol and ethanol analysis, urine conduces to most precise results at mid-concentration in contrast to blood. For interday studies, high precision was obtained in saliva as well. Similar to precision data, analysis of both methanol and ethanol in urine and saliva had the highest accurate results for intra- and interday studies (Table II). No matrix effect was presumed for water in this study due to constant homogeneity and no other molecule in its composition other than water itself. On the other hand, with rich protein content, blood certainly has the strongest matrix, affecting the volatile substance to be analyzed in the headspace-GC system. In this respect, detection and quantification limits and recovery data were affected as well. Table I shows that blood has the lowest recovery rate and highest detection-quantification limits.
In headspace-GC analysis, in addition to the phase transition between liquid and gas phase, volatile analytes are affected only by the physical and chemical properties of the sample. Therefore, the effect of matrix content on analytical signal should be considered in particular (19). As performed in the present study, addition of IS is one of the suggested solutions for minimization of matrix effect (16).
Conclusion
A headspace-GC–FID method was established for simultaneous measurement of methanol and ethanol and was validated in terms of reproducibility, sensitivity, accuracy, precision, and detection limits. It was revealed that headspace GC for methanol and ethanol determination in all routinely available biological fluids is applicable as a reference method and also in routine diagnostics and monitoring for forensic–toxicological and analytical purposes. For nonadvanced local toxicology laboratories, the method presented here stands out as simple and easily applicable.
The influence of the matrix composition on the chromatographic response was investigated for each biological fluid. The matrix effect on headspace analysis of methanol and ethanol was determined in blood in comparison to saliva and urine, and had less protein content.
The presence of proteins indicated stronger matrix effects in headspace-GC analysis. Matrix effect of blood was determined more in comparison to saliva and urine, which have less protein content.
Acknowledgments
This study was supported by grants from the Ankara University Institute of Biotechnology Research Fund, project number 2004-118.
Görkem Mergen*, Zeliha Kayaalti*, Emrah Dural*, Vugar Aliyev*, Seda Kaya*, Serap Yalçin†, Ayşe Karakuş*, and Tülin Söylemezoğlu*
*Ankara University Institute of Forensic Medicine, Ankara, Turkey.
† Ahi Evran University, Kirsehir, Turkey.
Direct correspondence to: mergen@medicine.ankara.edu.tr.
References
(1) A. Tangerman, Clin. Chem. 43, 1003–1009 (1997).
(2) D. Zuba, A. Parczewski, and M. Reichenbacher, J. Chromatogr., B. 773, 75–82 (2002).
(3) C.L. Winek Jr., C.L. Winek, and W.W. Wahba, Forensic Sci. Int. 71, 1 (1995).
(4) S.J. Heishman, E.G. Singleton, and D.J. Crouch, J. Anal. Toxicol. 20, 468 (1996).
(5) J.A. Sales and C. Lourdes. Food Addit Contam A 20, 519–523 (2003).
(6) W. Gubala and D. Zuba, Pol. J. Pharmacol. 55, 639–644 (2003).
(7) M. Zilly, P. Langmann, U. Lenker, V. Satzinger, D. Schirmer, and H. Klinker, J. Chromatogr., B 798, 179–186 (2003) .
(8) A.W. Jones, Forensic Sci. Int. 135, 206–212 (2003).
(9) W. Gubala and D. Zuba, Pol. J. Pharmacol. 54, 161–165 (2002).
(10) A.W. Jones, Scand. J. Clin. Lab. Invest. 39, 199–203 (1979).
(11) H.M. Chen and C.M. Peterson., Alcohol 11, 577–582 (1994).
(12) T. Yaritaa, R. Nakajimab, S. Otsukac, T. Iharaa, A. Takatsua, and M. Shibukawa, J. Chromatogr., A. 976, 387–391 (2002).
(13) C.L. Correa and R.C. Pedroso, J. Chromatogr., B 704, 365–368 (1997).
(14) B.S. Martinis, M.A.M. Ruzzene, and C.C.S. Martin, Anal. Chim. Acta 522, 163–168 (2004).
(15) I.A. Wasfi, A.H. Al-Awadhi, Z.N. Al-Hatali, F.J. Al-Rayami, and N.A. Al Katheeri, J. Chromatogr., B 799, 331–336 (2004).
(16) S. Strassnig and E.P. Lankmayr, J Chromatogr., A 849, 629–636 (1999).
(17) G. Mergen, T. Söylemezoglu, I.Ilhan, and Y.B. Dogan, LCGC Eur. 22, 180–188 (2009).
(18) ICH. International Conference on Harmonization (ICH) of Technical Requirements for the Registration of Pharmaceuticals for Human Use, Validation of Analytical Procedures: Methodology (ICB-Q2B) (ICH, 1996).
(19) B. Kolb and L.S. Ettre, Static Headspace Gas Chromatography: Theory and Practice, (Wiley–VCH, Hoboken, New Jersey, 1997), 187–189.

New Study Reviews Chromatography Methods for Flavonoid Analysis
April 21st 2025Flavonoids are widely used metabolites that carry out various functions in different industries, such as food and cosmetics. Detecting, separating, and quantifying them in fruit species can be a complicated process.


