Utility of Hydrogen-Deuterium Exchange Together with Mass Spectrometry for Determining Higher Order Structures of Proteins: Comparisons Between Biosimilar and Innovator Biopharmaceuticals
LCGC North America
Hydrogen–deuterium exchange–mass spectrometry enables determination of higher order structures of biopharmaceuticals and direct comparisons between a biosimilar and its proprietary analog.
The topic of higher order structures (HOS) of biopharmaceuticals has emerged to be extremely important and pervasive for both the biopharmaceutical industry and the regulatory agencies. This overview discusses how the combination of hydrogen-deuterium exchange (HDX) and mass spectrometry (MS) may be used to make direct comparisons between biosimilars (biogeneric) and their proprietary analogs.
J. Auclair, A.S. Rathore, and I.S. Krull
The biopharmaceutical world has, over the past decade or two, given rise to another subset of protein derived products besides the original, innovator proteins, monoclonal antibodies (mAbs), and derived offspring (1–5). Several publications suggest that “copies of these products, termed biosimilars or follow-on biologics, are not truly equivalent, and cannot gain market approval through the procedure typically applied to generic drugs (3).” Due to this fact, the US FDA defines a biosimilar on its website as a product “highly similar to the reference product, with no clinically meaningful differences.” To date, this lack of equivalency appears to hold sway in most regulated countries, but particularly in Europe and the United States. To reduce the time, money, and effort needed to gain marketing approval for biosimilars, eventually most regulatory agencies are likely to accept analytical data that strongly suggests equivalent, macromolecular structures, absence of impurities, and stability assays, but without any actual clinical trials or human studies (4,5).
A number of analytical methods are routinely utilized by biosimilar firms to demonstrate chemical equivalency between their biosimilars and someone else’s proprietary products (4,5). These most often include the use of various forms of ultrahigh-pressure liquid chromatography (UHPLC), high performance capillary electrophoresis (HPCE), and mass spectrometry (MS) techniques. Usually, these techniques are used to determine the presence or absence of variants, known molecular weights or ions, amino acid sequences, glycosylation patterns, glycation patterns, glycoforms present, disulfide locations, and so forth. Readers are encouraged to review some of our past LCGC columns that cover such analytical methods and references therein. Suffice to say, at present, that such methods have become very commonplace, and are routinely utilized in regulatory submittals. However, such approaches do not and cannot provide evidence for higher order structures (HOS), which attempt to delineate the three-dimensional structure of the proteins. In recent columns, we covered this topic in some depth (6–7). It is covered in greater depth, by far, in a recent, excellent book on the same subjects (5), a second edition of which is now available.
Why the Enormous Interest in Securing the HOS?
It has become commonplace to be able to very closely replicate the specific structural features of a proprietary biopharmaceutical, once the structures have been adequately defined. However, regulators realized that such detailed, structural information does not, in and by itself, define the HOS. This subject has been discussed at numerous MS meetings, often involving those scientists seeking to compare their biosimilar to the innovator product (8), as well as attempting to define which analytical methods will suffice to meet the regulatory requirements for equivalency of HOS. At one such meeting, when two FDA panelists and industry colleagues were asked which newer methods they see increasingly appearing in biosimilar filings, the answer was hydrogen-deuterium exchange with mass spectrometry (HDX-MS). Why the crying need to define HOS, and why are regulatory agencies demanding to see experimental data to support close HOS structures between a biosimilar and the proprietary product? The simple answer is that HOS defines the three-dimensional structure of the biologically active form of the biosimilar; in other words, as we learned in introductory biochemistry courses, structure equals function, and HDX-MS appears to provide this information more securely than most other analytical methods available today (6–8). If the HOS of a biosimilar, as suggested by HDX-MS, does not agree with that of the innovator drug, then the FDA and other regulatory agencies will (most likely) not approve the biosimilar, because it most likely will not have the same therapeutic index and biological activity against the targeted disease as the proprietary or innovator drug. It appears that this approach has been or is being adopted by all regulatory agencies around the world today. It also suggests that of all possible, analytical methods for determining HOS, HDX appears to be most acceptable to both the industry and the regulatory agencies. Why is that?
It is because nuclear magnetic resonance (NMR) has a serious problem in handling all of the possible data needed to define HOS for large mAbs. And, more importantly, NMR does not define HOS; rather, it defines where each proton lies in 2D space, but not in 3D space. NMR does not define the 3D space sufficiently. The other likely competitor to HDX-MS is X-ray crystallography, which requires that the protein of interest form crystals, and the HOS derived is for the crystals not for the protein in solution-that is, it gives a snapshot of the likely most energetically favorable structure, thus not representing the dynamic motions of the protein, or in other words, a protein’s HOS.
The only other possible competitor might be cryo-electron microscopy (cryo-EM), which could yet become a winner, but it is yet too soon for it to be readily adopted by the biosimilar industry. And so, that leaves HDX-MS, which we will now discuss in more detail to explain why it seems to work so well for comparing a biosimilar to its proprietary relative, or to other biosimilars of the same innovator protein.
Why Does HDX-MS Work Well to Compare a Biosimilar to a Proprietary Product?
We have recently discussed how and why HDX-MS is so useful in defining the HOS of proteins in a recent LCGC column (9). A significant amount of literature already exists on this technique, and numerous review articles elucidate how HDX-MS works to compare a biosimilar to the proprietary, innovator molecule. In essence, the goal is to provide a two-dimensional representation of the biosimilar’s HOS, which is three-dimensional (9). The challenge is to derive the 3D structure via a 2D plot of H-D exchanges under a certain set of experimental conditions. Such conditions are well defined in the HDX literature to produce the plot of H/D exchanged as a function of experimental conditions and time (10).
In actuality, it is not possible to derive the actual 3D structure; only X-ray crystallography and perhaps cryo-EM have such abilities. What HDX does is to indicate which protons on the protein can undergo exchange under optimal conditions, and to then compare that exchange map, side-by-side between the two candidates, biosimilar and innovator. This is known as a mirror plot, as we will shortly display. We are not yet binding the biosimilar or proprietary protein to a target, as in surface plasmon resonance (SPR), though that too can be pursued. Rather, we are just taking both the reference biotherapeutic and its candidate biosimilar, and as a function of time and temperature, allowing them to undergo native hydrogen-deuterium (H/D) exchange until the process has stopped, or, as a function of time and temperature, to further show that these two proteins show identical H/D exchange rates and stable products.
If it were needed, one could first allow the two proteins individually to complex with the known target, in solution, and then perform H/D exchange. That would then indicate what specific parts of each protein have bound, and which parts are not bound. Those bound to the target will then have the active portion of the mAb bound, and it will not undergo H/D exchange as rapidly as in the absence of the target. If this study were done with both proteins of interest against the same target, the results could indicate which protein has bound more fully, quickly, and directly to that specific region of the target protein, as a result of comparing the heat maps, side-by-side. Heat maps show how much of a protein has undergone H/D exchange as a function of the temperature under the exchange conditions. All of these studies are possible, and have already been (partially) demonstrated, but not always for the pair of biosimilar and proprietary mAbs or proteins together.
Comparing a Biosimilar to its Proprietary Analog Using HDX
In searching the available literature, we were able to uncover at least three different reports on using HDX to compare a biosimilar to its proprietary analog in the absence of any target. In fact, most studies using this approach have not reported results wherein each antibody was first bound to its intended target as a biopharmaceutical, and then HDX was pursued on the already-bound mAb. Such a study might be a more interesting one than a study without the target present. For regulatory purposes, HDX is being utilized only to compare HOS of the separate mAbs or proteins, without any target bound to them. In the first study, without a target present, Remicade (as the reference) and Inflectra (as the biosimilar) were analyzed by traditional HDX approaches (11). We mentioned before the use of heat maps in doing HDX studies, which relates to changing the temperature of the exchange process for a single protein or mAb alone. Heat maps are useful in indicating what may be the optimal temperature and time (seconds), so as to obtain maximal exchange of different carbon-hydrogen sites. Heat maps are used to optimize HDX conditions, but have little utility once that is ascertained and little utility for doing HDX to compare two different proteins or mAbs, as here.
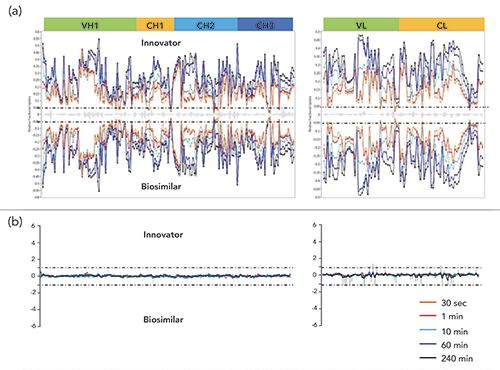
In the present instance, we are comparing two proteins, biosimilar versus proprietary, and Figure 1 illustrates the amount of exchange recorded after different times at a given temperature of deuteration. The goal is to optimize the rate and completion of exchange for all regions of the protein undergoing HDX, and to show that these two proteins have, basically, the same kinetic plots of exchange. Part (a) of Figure 1 illustrates different known regions of each protein, innovator on top and biosimilar on bottom, with each wavy line related to the time of exchange, from 30 s to 60 min. After each exposure of both proteins, separately, the proteins are digested by standard enzymatic techniques, into the individual peptides, already known from previous studies (not having anything to do with HDX), and each peptide map, again as a function of time of exchange, is analyzed by UHPLC with electrospray ionization (ESI) mass spectrometry (UHPLC–ESI-MS) to determine the amount of H/D exchange. The y-axis shows relative fractional uptake of D as a function of the time allowed for that exchange study. Thus, at shorter time points, less exchange takes place, while at longer time points, more exchange takes place. If the two HOS are identical for both innovator and biosimilar, then the difference plots (b) for these would be a flat, straight line, as in Part (b) of Figure 1.
Again, we are not determining HOS, as is possible by X-ray crystallography and perhaps by two-dimensional NMR (2D NMR) for very simple proteins, but are only interested in showing that the two proteins in question have the same conformations by HDX. Again, it is the differential plot, Part (b), that tells the full story regarding equivalency or not of the HOS. In comparing these differential plots for the innovator and biosimilar, the goal is a flat line, indicating identical HOS. However, that scenario may be the exception and not the norm; therefore, you may discuss or show how similar or identical the two HOS have to be, between an innovator and biosimilar, to obtain regulatory approval. As far as the authors know, there is no current rule regarding such direct comparisons that defines the allowable amount of variation. However, any differences cannot result in any clinically meaningful differences between the two products.
Comparing a Second Biosimilar to its Proprietary Analog Using HDX
In a recent, second publication (12), two separate biosimilars to bevacizumab were compared to the reference product using two separate methods of performing peptide sequencing, top-down sequencing (TDS), and bottom-up sequencing (BUS). Both of these sequencing approaches have become well established. In the first, bottom-up, long used for doing protein sequencing or proteomics, each protein is enzymatically cleaved. The resulting mixture of peptides is then sequenced using UHPLC–ESI-MS, with a wide variety of instrumentation possible. This has also become known as shotgun protein sequencing because it is not always the case that all peptides are realized, and because the actual, parent protein is determined using various databases and those peptides measured. However, total sequencing using the peptides alone is rarely achieved. Hence, incorrect protein assignments are not uncommon, unless one first measures the intact molecular weight (MW) via MS, and then correlates the peptides realized against that MW.
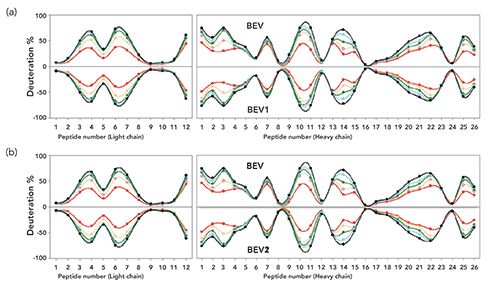
In the top-down approach, only intact proteins are measured using a wide variety of fragmentation routes, but it is rare very large proteins are ever fully fragmented. Thus, as seen in Figure 2, the mirror plots of the average HDX level of peptides are reported as a function of the time of deuterium exchange versus given peptide numbers from the light and heavy chains of this mAb. Using the bottom-up approach, which is often full of holes, a sequence coverage of 87% was obtained for the heavy chain, and 74% for the light chain. The other peptides were, presumably, just not found by HPLC–ESI-MS. However, the amount of deuterium incorporation in these peptic peptides from the three bevacizumab samples were compared side-by-side, and they showed no differences at the various time points.
TDS of the intact proteins were performed using subzero temperature LC–MS, and the deuterium incorporation of the intact light and heavy chains was obtained. Ideally, TDS should, in theory, provide amino acid level HDX information covering 100% of the light chain, but only 50% coverage was possible for the heavy chain. The problem, still today, is that none of the TDS methods has proven to be always successful in sequencing 100% of intact proteins, larger than about 40 kDa, and 100% for the light chain of about 25 kDa is not uncommon. If the heavy chain of this antibody is 50 kDa, then a 50% sequencing coverage is not unusual. This is not TDS of the intact mAb, which is about 150 kDa, and which would give much less than 50% sequencing coverage. TDS has apparently reached a stalemate in terms of the maximum MW of the intact protein that can be 100% sequenced, at about 25-35 kDa. A recent ASMS workshop in Boston (2017), dedicated to improving TDS for larger proteins, did not indicate any improvements from the above steady-state. We and others have discussed this situation in a recent monograph (13). Suffice to say that, at times, especially for very large proteins, neither BUS or TDS can provide 100% sequencing efficiency, but the combination of the two can approach this.
Results shown in Figure 2 suggest that there are no differences between these three bevacizumab samples, at least with respect to their HOS, and the peptide level information from the BUS approach, as well as the residue level and intact, subunit level information from the TDS approach, were complementary and covered the entire mAb sequence. In all of the data, especially Figure 2, the mirror plot of the average HDX levels of peptic peptides compared the two bevacizumab biosimilar samples, and this showed them to be virtually identical, and that they were also identical to the proprietary mAb, in terms of amino acid sequences and peptic peptide maps from both TDS and BUS methods. It is the actual mirror plots that are the most important results from all of these HDX-MS studies, whatever the starting proteins or mAbs. These studies have now become very commonplace for comparing a biosimilar to its proprietary cousin for regulatory approval.
Conclusions
The general area of HOS has become the focus of various, scientific, and technical meetings in recent years. Thus, in 2018, the California Separations Society (CaSSS) offered a meeting on HOS, as part of a series of such meetings (14). There has been another series of meetings offered through the Gordon Research Conferences, held every other year, also dedicated to HOS, at venues throughout New England (15). There is also an annual meeting, devoted to HDX-MS, now held every year, that moves from country to country, during June, 2019 (16).
In particular, HOS of recombinant proteins or mAbs has become very important. The biopharmaceutical industry has now been able to produce large scale batches of their protein products, in a very reproducible and efficient manner. This has led to the same, desired product each time, and biosimilars of those products can now easily be shown to have the same HOS as the original, proprietary product. Even though the exact HOS is not being determined, it is not needed, so long as it can be proven to be identical to the proprietary product, and as biologically and medically efficient, which is now by inference, rather than by clinical, human studies. Thus, the biosimilar can then be marketed faster, more efficiently, and more cheaply, without the exhaustive clinical studies of humans or animals required for its predecessor, the proprietary, original biopharmaceutical product. This is a significant step forward, which will continue to evolve and become more commonplace, as more and more biosimilars can be brought to market.
Acknowledgments
The authors are most grateful to our esteemed colleagues at Northeastern University, in Boston, Massachusetts, Distinguished Professor John Engen and his group, who have provided us with prior publications, other literature relevant to this column, and numerous discussions and emails reviewing available literature.
References
- T. Cross, Current and Future Biopharmaceuticals, analyteguru.com/current-and-future-biopharmaceuticals (Thermo Fisher Scientific, April 3, 2017) analyteguru.com/current-and-future-biopharmaceuticals
- H. Schellekens, Nephrol. Dial Transplant, 20(s4), iv31–iv36 (2005).
- C. Combe, R.L. Tredree, and H. Schellekens, Pharmacotherapy January, 16, 2012. https://doi.org/10.1592/phco.2005.25.7.954
- S.A. Berkowitz, J.R. Engen, J.R. Mazzeo, and G.B. Jones, Nat. Rev. Drug Discov. 11(7), 527–540 (2012).
- D.J. Houde and S.A. Berkowitz (Eds.), Biophysical Characterization of Proteins in Developing Biopharmaceuticals (Elsevier Science Publishers, Amsterdam, The Netherlands, 2015).
- J. Auclair, A. Rathore, and I.S. Krull, LCGC North Am. 37(1), 34–43 (2019).
- A.S. Rathore, I.S. Krull, and S. Joshi, LCGC North Am. 36(11), 814–822 (2018).
- 2016 National Meeting, American Society of Mass Spectrometry (ASMS), San Antonio, TX, June, 2016, Workshop on Higher Order Structure Determinations.
- R.E. Jacob, J.R. Engen, I.S. Krull, and A. Rathore, LCGC North Am. 35(6), 392–390 (2017).
- E. Largy, C. Cajot, and A. Delobel, Current Trends in Mass Spectrometry 16(4), 8–14 (2018).
- J. Fang, C. Doneanu, W.R. Alley, Jr., Y.Q. Yu, A. Beck, and W. Chen, mAbs, 8(6), 1021–1034 (2016). http://dx.doi.org/10.1080/19420862.2016.1193661
- J. Pan, S. Zhang, and C.H. Borchers, Biochim. Biophys. Acta 1864, 1801–1808 (2016).
- I.S. Krull and J. Auclair, Advances in Chromatography, N. Grinberg and P.W. Car, Eds. (Taylor and Francis Group, Boca Raton, Florida, 2017), pp 69–86.
- California Separations Society, Inc., Higher Order Structure (CaSSS Providence, RI, 2018). https://www.casss.org/page/HOS1801/Higher-Order-Structure-2018.htm
- Gordon Research Conferences (Grand Summit Hotel at Sunday River, 2018). https://www.grc.org/venues/north-america/sunday-river-grand-summit-hotel
- Hydrogen-Deuterium Exchange Mass Spectrometry (HDXMS) 2019, 2nd International Conference on Hydrogen Deuterium Exchange Mass Spectrometry (HDXMS2019), May 21-24, 2019, Banff Centre, Banff, AB, Canada.Society for HDX-MS, hdxms2019.org

Anurag S. Rathore is a professor in the Department of Chemical Engineering at the Indian Institute of Technology in Delhi, India.

Ira S. Krull is a Professor Emeritus with the Department of Chemistry and Chemical Biology at Northeastern University in Boston, Massachusetts, and a member of LCGC’s editorial advisory board.
Jared Auclair is an Associate Teaching Professor in the Department of Chemistry and Chemical Biology at

Northeastern University, within the Department of Chemistry and Chemical Biology at Northeastern University in Boston, Massachusetts. He is also the Director of Biotechnology and Informatics, as well as the Director of the Biopharmaceutical Analysis Training Laboratory.

Polysorbate Quantification and Degradation Analysis via LC and Charged Aerosol Detection
April 9th 2025Scientists from ThermoFisher Scientific published a review article in the Journal of Chromatography A that provided an overview of HPLC analysis using charged aerosol detection can help with polysorbate quantification.
Removing Double-Stranded RNA Impurities Using Chromatography
April 8th 2025Researchers from Agency for Science, Technology and Research in Singapore recently published a review article exploring how chromatography can be used to remove double-stranded RNA impurities during mRNA therapeutics production.


