Chromatography Fundamentals, Part VIII: The Meaning and Significance of Chromatographic Resolution
LCGC North America
The effectiveness of a separation can be quantified by measuring the resolution. This article explains the factors influencing resolution and the equation for predicting the required number of theoretical plates to obtain a given esolution.
From a practical point of view, just glancing at a chromatogram can often reveal whether or not a separation has been achieved by noting the depth of the valley between peaks of interest, or if there are hints of partially resolved components. The effectiveness of a separation, however, can be quantified by measuring the resolution, a commonly used parameter found in many disciplines. This review offers insight into the meaning and significance of chromatographic resolution, and factors that influence it. Also presented is the equation for predicting the required number of theoretical plates to obtain a given resolution.
Howard G. Barth
Our goal as chromatographers is to develop methods that have sufficient resolution to separate components of interest, for both qualitative and quantitative analyses. To increase resolution, we must either increase the distance between peak maxima of adjacent peaks or decrease peak width, or both; the former is best accomplished by increasing the relative retention, such as selectivity, of the two components, and the latter is achieved by decreasing peak broadening. Although we can usually determine whether or not a separation has been achieved by inspecting a chromatogram, a quantitative assessment of resolution is indeed required for optimizing a separation. In this paper, we examine definitions of
resolution
, and develop equations that are needed to measure the influence of peak broadening on resolution.
Basic Concepts
Resolution
Resolution is a measure of the degree of separation between two adjacent signals, detector responses, or, in the case of optical instruments, objects. The general resolution equation is defined as

where âs is the spacing between the apex of two signals with respect to their average baseline width, wav = (w1+w2)/2. This equation is applicable to all signal shapes; however, the significance of the calculated value depends upon the geometry or shape of the signal. By convention, sizes of adjacent signals are normalized, that is, they have similar intensities or areas. Signals also can be generated temporally or spatially; that is, with respect to time or position.
The major limitation of resolution, as applied to chromatography, is that it is restricted to pairs of signals, considering that solutes of interest typically appear as multiple peaks, rather than binary populations. Chromatographic resolution also assumes that peaks are symmetrical and have Gaussian distribution, which are approximations at best. Furthermore, adjacent peaks do not have equal areas. Since resolution is a function of peak width and retention time, both of which are inherent properties of the chromatographic process, resolution measurements can be used for optimizing separations.
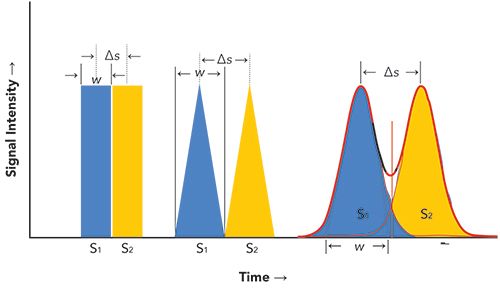
To help put the concept of resolution into perspective with the use of equation 1, we will consider three types of signals that can be generated as a function of time: 1) rectangular pulses of equal widths, 2) isosceles triangles with equal bases, and 3) normalized Gaussian peaks. (Please note that isosceles triangles have been used as rough models for chromatographic peaks.) These signals or peaks are illustrated in Figure 1.
- For rectangular signals, in which âs = wav and R = 1, separation would be complete, even though both signals are conjoined. However, except for an increased peak width, no underlying signals would be detected, if present, between s1 and s2.
- For isosceles-shaped signals, in which âs = wav and R = 1, the bases of the two triangles would abut one another, and separation of these signals also is complete. Furthermore, because of their geometry, we would be able to detect intermediate signals via the appearance of their apexes, if present between s1 and s2. In this case, the two outer peaks would be distorted.
- For Gaussian peaks, in which âs = wav and R = 1, the two peaks would be only partially resolved, as their baseline widths would overlap by 2.2%; however, depending upon detector response difference between peaks, R = 1 can result in a maximum 50% error if response of these peaks differ considerably from one another (see Table I and the corresponding text). In order to obtain nearly complete resolution, peak separation would have to be increased to ≥ 6σ (R ≥ 1.5), where σ is the standard deviation of a Gaussian distribution (1).
The reason why Gaussian-shaped signals, such as chromatographic peaks, are not easily baseline separated is because, unlike discrete signals with regular geometries, they broaden with time, as a result of molecular diffusion. Because peak dispersion is governed by the laws of probability, from a purely theoretical point of view, injected solute molecules could be found anywhere along the length of a column.
Resolving Power
Although the term resolving power is not explicitly used in chromatography, it is important, nevertheless, to distinguish it from resolution, since both terms are occasionally used interchangeably. The resolving power of a method or an instrument is its ability to differentiate between two adjacent signals or objects (2). The general equation of resolving power is

where sav is the average value of two adjacent signals and âs is the distance or separation between them. Equation 2 appears to be the reciprocal of equation 1; however, it usually does not take into account the width of a signal, only its location or position. Resolving power is mainly used in mass spectrometry, as well as with optical instruments, such as microscopes, telescopes, spectrographs, and spectrophotometers.
The explanation for why we cannot attribute a unique resolving power to a chromatographic method or column is that there would be an unlimited number of possible values to take into account all possible solutes and chromatographic conditions. Thus, resolving power in chromatography has limited utility.
Alternative Resolution Equations
According to Giddings (3), the counterpart of resolving power in chromatography is essentially peak capacity, nc, which is defined as the number of peaks with a resolution of one that can be “crowded into the available separation space.”

Here, Vmin and Vmax refers to the minimum and maximum elution volumes of a column; this ratio is also equivalent to tmax/t0, where tmax is the maximum practical retention time and t0 is the retention time of an unretained peak. For typical HPLC columns using isocratic elution, peak capacity is less than 100, but much higher for gradient elution. In size-exclusion chromatography, however, peak capacity is limited to approximately 18, because the available separation volume is limited to the pore volume of a column.
A different resolution concept, proposed by Watson and Carr (4,5), measures the “goodness” of a separation, which considers multiple pairs of peaks and a desired analysis time. This equation, which is called the chromatographic resolution factor (CRF), uses the ratio Pi/P0 for each pair of peaks, in which Pi = f/g, where f and g are height-related parameters of the two peaks and P0 is the desired value of P. Also included in this equation are the actual analysis time, tL, the maximum acceptable analysis time, tM, and a weighting factor, β, which is related to the importance attributed to the analysis time:

In a subsequent study, Glajch and coworkers (6) modified this equation by replacing the P terms with the chromatographic resolution, Rs,i of each pair (see equation 6) and a desired resolution, Rs,0 with a corresponding weighting factor, Ai. The equation was renamed the chromatographic optimization factor (COF):

Although the last two equations require more experiments and judgement calls to evaluate, as compared to peak capacity, they nonetheless provide chromatographers with an additional parameter to gauge, compare, and optimize separations, especially for HPLC involving multicomponent analysis.
Chromatographic Resolution
Chromatographic resolution is a measure of the degree of separation between two adjacent peaks, with retention times t1 and t2 and corresponding peak widths w1 and w2:

where ât = t2−t1 and wav is the average peak width. Because chromatographic peaks assume a Gaussian distribution, peak widths are expressed in units of standard deviation, σ. By convention, the peak width at baseline is approximately 4σ, which includes 95.4% of the total peak area (1). Thus, equation 6 becomes

Here t and σ must have the same units, or expressed as standard deviation units.
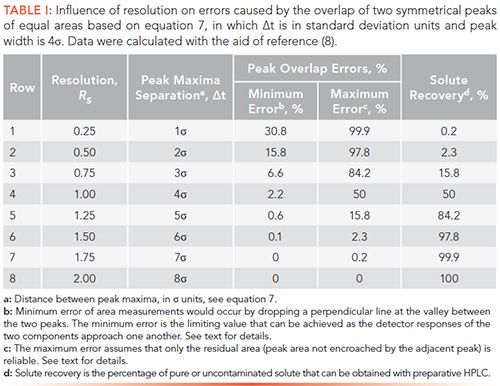
To achieve near baseline separation of two adjacent peaks, the distance between the two peak maxima must be equal to 6σ. At this value, each peak would overlap its neighbor by only 0.1% (Table I), which occurs when Rs = ât/4σ = 6σ/4σ = 1.5. As discussed in the next section, satisfactory quantitation can be achieved when 1.5 > Rs > 1, depending upon peak symmetry, area ratios of the two peaks (7), and detector response-factor difference of the two components. (If chromatographic peaks were geometrically shaped, complete separation would occur at Rs = 1, as previously discussed.)
Influence of Resolution on Peak Overlap
As resolution deteriorates, peaks begin to merge, making it difficult to accurately determine areas of each peak. Thus, the purpose of this section is to demonstrate the critical nature of peak broadening with respect to the overlapping of adjacent peaks, assuming that both peaks have Gaussian distributions. Our treatment is also limited to peaks that are symmetrical and have equal areas; asymmetrical peaks of unequal areas are more problematic, and are not discussed in this paper.
There are three ways of considering the effect of peak broadening on pairs of adjacent peaks:
1. From a geometric perspective, we can simply drop a perpendicular line through the valley formed between overlapping peaks (see Figure 1). Using this method, we can compute peak area errors attributed to peak overlap, as summarized in Table I, columns 4 and 5. At Rs ≥ 1.0 (row 4), the percent of peak overlap would be ≤2.2%. However, because components typically have different detector response factors, errors can indeed be substantial. Thus, data given in column 4 would be the minimum expected error caused by peak broadening.
2. Because peaks generally have different areas and response factors, it is not possible to predict errors, a priori, without knowing both of these values. Nonetheless, we can estimate a maximum, percent error incurred by peaks having different detector responses, as a function of resolution, shown in Table I, column 5. (Please note that there would be no peak-area errors, regardless of resolution, if both peaks had the same area and detector response. In this case we would just measure the area of the total peak envelope and divide by two.)
The percent of peak area that is not compromised by its neighbor is simply the maximum error (column 5) subtracted from 100%. For example, at Rs = 0.25 (row 1), only 0.1% of the peak tail would be unaffected by the adjacent peak. In other words, we could incur a maximum error of 99.9% for quantitative measurements depending upon the detector response-factor difference of the two components. With this tighter specification, an acceptable error of 2.3% could be achieved only at Rs ≥ 1.5 (row 6).
3. The last column of Table I is the percentage of pure or uncontaminated product that can be recovered with preparative HPLC. At Rs = 0.25, only the tail of each peak, that is, 0.1%, can be obtained in pure form. In order to recover an acceptable value of 84% of each solute, a resolution of Rs = 1.25 would be required. For complete recovery, we would need a resolution of Rs > 1.5.
Relationship Between Peak Broadening and Resolution
The relationship between peak broadening, as measured via peak variance, σ2, and the number of theoretical plates, N, is given by

where t is the peak maximum retention time of a solute. After rearranging and taking the square root, we obtain

We next substitute equation 9 into equation 7 to obtain

Here, tav refers to the average retention time of two adjacent peaks, and ât is the retention time difference between the two peak maxima.
Equation 10 shows that resolution is proportional to the square-root of column efficiency, a classical relationship in chromatography. On rearranging, we obtain

This equation gives us the required number of theoretical plates, Nreq, needed to obtain a specified resolution, Rs, of two adjacent peaks with a relative retention ratio of tav/ât. To increase resolution between adjacent peaks that are separated by ât, column efficiency must be increased.
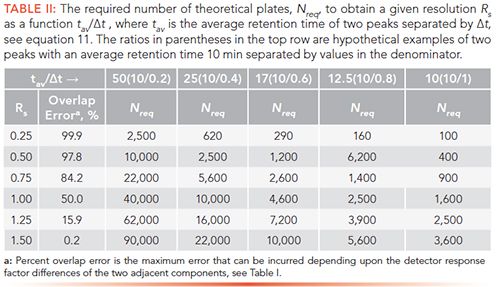
Table II lists examples of plate counts that are required to separate pairs of adjacent peaks to achieve a given resolution (column 1) as a function of tav/ât. (The ratios in parentheses along the first row are hypothetical examples of two peaks with an average retention time 10 min separated by values in the denominator.) These calculations assume that the areas of the two peaks are equivalent. The percent overlap of the two adjacent peaks is given in the second column.
For a pair of adjacent peaks with an average retention time of 10 min but only slightly separated by 0.2 min, 40,000 plates would be needed to achieve Rs = 1.0. To attain near baseline resolution (Rs = 1.5), 90,000 plates would be required for this example. For a separation of 1 min (last column), only 1600 plates would be required to obtain Rs=1.0, whereas 3600 plates would be necessary for Rs = 1.5.
These data show the importance of developing chromatographic methods of high selectivity or maximum ât. In fact, the last term of equation 11 can be recast in terms of the average retention factor, kav = (tav–t0)/t0, and the separation factor, α = (t2−t0)/(t1−t0),

Because the rate of change of [α/(α-1)]2 with respect to α is much greater than the rate of change of [(k+1)/k]2 with respect to k, the separation factor exerts a much greater influence on Nreq than the retention factor.
Equation 12 can serve as a guide for HPLC method development; for example, if the initial resolution is about 1.0, a possible strategy would be to increase the retention factor, k, by lowering the percentage of strong solvent in the mobile phase. However, if the initial resolution is too low or the required efficiency calculated from equation 12 is too high, then the separation factor, α, should be increased by changing the separation mechanism, via a different the stationary phase and mobile phase composition. This iterative process would be repeated until the desired separation is achieved.
Conclusions
Although there are several ways of calculating resolution, the equation used in chromatography specifically takes into account both peak broadening and relative retention between peaks of interest. We have shown also that specifying a resolution or “resolving power” of a given column has limited applicability since any calculated value would pertain exclusively to the target solutes being analyzed using a specific chromatographic method. Any changes to either would greatly alter the resolving power of a system.
An obvious limitation to chromatographic resolution is that it can only be applied to pairs of peaks. Although several alternative relationships have been proposed for multicomponent analysis, peak capacity, first proposed by Giddings (3), has been successfully used.
Since chromatographic peaks assume a Gaussian distribution, peak broadening becomes a critical factor when developing methods of adequate resolution. Equations are available, however, that allows chromatographers to estimate the desired number of theoretical plates to produce a separation with a given resolution.
Because peak broadening is an inherent property of the chromatographic process, the best approach for developing high-resolution methods would be to select columns with high efficiencies. Furthermore, experimental parameters, such as flow rate and column temperature, could be optimized, to some extent, to help mitigate the effects of peak broadening, the subject of a future paper.
Forthcoming articles in this series will be a review of molecular diffusion and random walk theory, which will be followed by the origin of peak broadening, as formulated by Giddings.
References
- H.G. Barth, LCGC North Am. 37(4), 269–273 (2019).
- D.A. Skoog and D.M. West, Principles of Instrumental Analysis (Saunders College, Philadelphia, Pennsylvania, 2nd ed., 1980).
- J.C. Giddings, Unified Separation Science (Wiley-Interscience, New York, New York, 1991).
- M.W. Watson and P.W. Carr, Anal. Chem. 51(11), 1835–1842 (1979).
- S.G. Weber and P.A. Carr, High Performance Liquid Chromatography, P.R. Brown and R.A. Hartwick, Eds. (Wiley-Interscience, New York, New York, 1989).
- J.L. Glajch, J.J. Kirkland, K.M. Squire, and J.M. Minor, J. Chromatogr. 199, 57 (1980).
- L.R. Snyder, J.J. Kirkland, and J.W. Dolan, Modern Liquid Chromatography (Wiley, Hoboken, New Jersey, 3rd ed., 2010).
- J.G. Smith and A.J. Duncan, Elementary Statistics and Applications: Fundamentals of the Theory of Statistic (McGraw-Hill, New York, New York, 1944).
Howard G. Barth is with Analytical Chemistry Consultants, Ltd., in Wilmington, Delaware. Direct correspondence to: howardbarth@gmail.com

Regulatory Deadlines and Supply Chain Challenges Take Center Stage in Nitrosamine Discussion
April 10th 2025During an LCGC International peer exchange, Aloka Srinivasan, Mayank Bhanti, and Amber Burch discussed the regulatory deadlines and supply chain challenges that come with nitrosamine analysis.


