Tips, Tricks, and Troubleshooting for Separations of Biomolecules, Part II: Contemporary Separations of Proteins by Size-Exclusion Chromatography
LCGC North America
Much of the conventional wisdom regarding size-phase separations of proteins has been negated thanks to development of superior chemistries and advances in research. In this article, details that the authors have found to be especially beneficial in achieving effective SEC separations are examined.
Several new materials and columns have been introduced in recent years for size-exclusion separations of proteins. How do I know which one to choose, and which separation conditions will be the best for my protein separation?
In Part I of this series (1), we focused on reversed-phase separations of proteins. In recent years, many new materials and columns have been introduced that provide potential for substantially better separations compared with those from one or two decades ago. Although some things have stayed the same, much of the old conventional wisdom has been overturned with the development of better stationary-phase chemistries and new research that has provided deeper insights into why we observe some phenomena (for example, low recovery of proteins from reversed-phase materials under some conditions). This research has also led to new guidance for operating conditions that improve the likelihood of obtaining acceptable chromatographic results.
Over the past few years, we have seen tremendous expansion in commercially available offerings for size-based separations of proteins as well. These separations are most commonly referred to as size-exclusion chromatography (SEC), and we will use that term here. As with reversed-phase separations of proteins, the upside to having more commercially available columns to choose from is that we can more precisely tailor our column choices to the needs of our applications. However, the downside to more options is that we have to choose which one is the most suitable, and in some cases, this can be a challenging task in itself. On the other hand, recent research studies have added considerable insights to the existing knowledge base to support this decision-making process. Even if we don't fully understand why SEC materials behave the way they do in every situation (for example, see reference 2), we are in a much better position today to make good choices about columns and operating conditions than we were five years ago.
For this installment of "LC Troubleshooting," I have asked two of my collaborators in the biomolecule application space, and genuine experts in SEC separations of proteins, to join me in sharing some of the details that we have found to be particularly important to successful SEC separations.
Dwight Stoll
Basics of SEC Separations
From a theoretical point of view, SEC is arguably the simplest of all chromatographic separation modes. In reversed-phase mode and other separation modes, we spend a lot of time thinking and talking about retention (that is, retention factors greater than zero are very important!), which is a function of differences between the strength of intermolecular interactions between analytes, mobile phase, and stationary phase. It is differences between the way one analyte interacts with the mobile and stationary phases compared to another analyte that give rise to differences in retention (that is, selectivity) and ultimately resolution of two analytes. In this way, resolution in reversed-phase and similar separation modes (sorptive modes) is inherently chemically driven. SEC, on the other hand, is completely different, at least in the ideal case. Here, resolution has a physical basis, rather than a chemical one, and in the ideal case, there is no retention of the analyte by the stationary phase (that is, retention factors are zero or apparently negative). Instead, separation arises from differences in the physical limitations that analytes of certain sizes experience, preventing them from exploring the entire pore network of porous particles used in SEC columns. Very small analytes in a sample will be able to explore most of the pore network. On the other hand, larger analytes that are too big to explore all of the pores will travel through the column with a higher velocity, and be observed flowing from the column earlier than the small analytes. From the point of view of the large analytes, the mobile phase volume inside the column is effectively smaller. Under ideal circumstances (that is, no retention due to intermolecular interactions), very small analytes will be eluted at what we would normally refer to as the dead time (tm) in reversed-phase separations. The mobile-phase volume associated with this time (that is, tm × F) is referred to as the inclusion volume (corresponding to the total porosity of the column). Larger analytes will elute at earlier times, before the inclusion volume.
Decision 1-Choosing the Column
Before we dive into the details here, we want to be clear about our intent for this installment. A tremendous amount of very good information on the following topics has been published in recent years. Our discussion here is limited to a survey of highlights of that work. Readers interested in the details behind our discussion are strongly encouraged to engage the literature cited here to learn more.
Particle Size and Column Length
Before the advances in column technology for SEC in recent years, most SEC columns in use were relatively large-typically 7.8 mm in diameter, and 150 to 300 mm in length. The long column lengths were required because of the large particles that were used, most of which did not have high mechanical strength and had to be used at relatively low pressures. The recent trend in column technology for SEC has been focused on the development of columns with smaller particles (<3 µm), in shorter columns (the standard now is 15 cm), and in smaller diameters (typically 4.6 mm). This trend has been supported by the development of particle chemistries that are both sufficiently mechanically stable to be used at the higher pressures that accompany the smaller particle sizes, and sufficiently inert toward biomolecules, to produce separations based mostly on molecular size. The move to smaller particle diameters also provides opportunities to improve separation speed by using higher flow rates through these columns. With larger particles, using high flow rates tends to result in decreases in efficiency (that is, plate number) and resolution, but the price paid for doing so with smaller particles is not as severe.
Although we must be careful with generalizations, it is useful to think a bit about what the trend toward the use of small particles can do for us, in a practical sense. In rough terms the plate height scales with the particle diameter. So, upon moving from a 5-µm particle to a 2-µm particle, the plate height should decrease by about a factor of two (3). There are two main ways we can capitalize on this improvement in plate height-we can either improve resolution while using a column of the same length, or we can decrease analysis time while maintaining resolution. In the first case, if we use two columns of the same length-one with 5-µm particles and one with 2-µm particles-the plate number for the 2-µm particle should be approximately double that of the column with 5-µm particles. Since resolution scales with the square root of plate number, we should expect the resolution to improve by about 40%. In the second case, the plate number is directly proportional to column length, and inversely proportional to plate height. If the plate height decreases by a factor of two with the smaller particles, then we can decrease the column length by a factor of two, while maintaining the same plate number and resolution. If the same flow rate is used in both cases, we should expect this to immediately result in a 50% decrease in analysis time. This is a simple but useful view of these scenarios. There are number of other factors to think about when considering the move to smaller particles, including the pressure limitations of the column and particles, and specifications of the instrument. More-detailed discussions of the theory relevant to these considerations can be found elsewhere (4,5).
Average Pore Size and Distribution
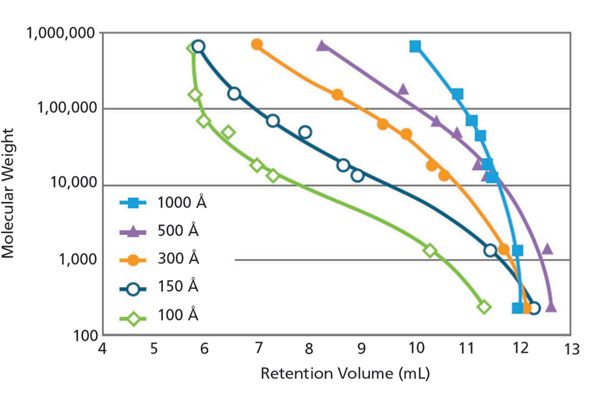
As described above, the velocity of a particular molecule through a SEC column depends on the extent to which it can explore the pores of the particles. For particles with a well-defined pore size distribution, there is a range of molecular sizes for which a particular particle will be effective for size-based separations. The calibration curve shown in Figure 1 shows the selectivity (that is, difference in elution volume for a given change in molecular weight) for particles with different average pore diameters. We see that with small-pore columns there is good selectivity for small molecules, but the largest molecules will effectively be coeluted. On the other hand, the very large pore materials effectively separate the largest molecules, but the smallest molecules are coeluted. This type of plot can be used to decide which pore size will be most effective for the application at hand. For protein characterization, typical pore sizes between 150 and 500 Å are used. For common therapeutic proteins (MW ≈ 15–80 kDa), a pore size of 150–200 Å works well, while a 200–300 Å pore size is usually used for monoclonal antibodies (mAbs, MW ≈ 150 kDa). For very large proteins (MW > 200 kDa, for example, pegloticase or PEGylated proteins), typically the 500–1000 Å materials offer the most appropriate selectivity.

Figure 1: Molecular weight vs. retention volume plots for SEC columns having particles with different average pore sizes. The smallest two molecules in the dataset are uracil (112 Da) and vitamin B12 (1350 Da), and the largest two molecules are gamma-globulin (158 kDa) and thyroglobulin (670 kDa). Adapted with permission from reference 6.
The pore size distribution has an impact on the slope of the calibration curves. The wider the pore size distribution, the steeper the curve is. Therefore, with a wide pore size distribution, the selectivity will be lower but the range of the analytes that can be separated will be broader. A narrow pore size distribution provides higher selectivity between species with slight differences in size, but only a limited size range of analytes can be separated.
The challenge in practice is that the only information that is readily available from column manufacturers is the nominal pore size. Unfortunately there is not broad agreement about how exactly to report pore size, and most of these measurements are based on gas adsorption/desorption measurements and may not be very meaningful for protein analyses. Thus, from the point of view of users of these columns, it is practically useful to experimentally determine the calibration curve by injecting a mixture of standard proteins in order to get a good sense for the selectivity that can be expected for a given protein sample.
Decision 2-Choosing the Mobile Phase
After choosing the column, the next most important decision involves choosing exactly what will go into the mobile phase. As described above, one of the basic tenets of SEC separations is that conditions should be chosen so that retention (in a chemical sense) is minimized. If achieved, this approach ensures that the elution volume is an indicator of molecular size (as in a calibration curve of the type shown in Figure 1) and nothing else. At first glance, this seems like it should be straightforward-we should just choose a stationary phase that does not interact strongly through specific types of interactions with the analyte, and choose a mobile phase in which the analyte has a high solubility and that is able to minimize analyte–stationary phase interactions. But, if we've learned anything from 50 years of liquid chromatography, one of the big lessons has been that apparently tiny changes in the chemistry or structure of a stationary phase or analyte can lead to big changes in retention. Indeed, we often exploit these interactions to great effect in reversed-phase separations when developing a new method. However, implementing this approach also means that achieving the "no retention" condition in SEC separations of proteins can be quite difficult in practice. There is a rich literature describing studies that have explored the use of different mobile phase modifiers and conditions to minimize stationary phase–analyte interactions.
It has been our experience that many of the specific effects of different mobile-phase conditions are protein- or stationary-phase specific (or both), and thus some amount of exploration of variables is a necessary part of method development when starting work with a new molecule. However, based on our experience and the literature available to date, we can provide some suggestions for starting conditions:
- pH: When the isoelectric point (pI) of the protein is known, the mobile-phase pH should be adjusted to approximately match the pI of the protein. If the pI is not known, pH 6.5 is a good starting point. One should ensure, either based on existing literature or by experiment, that the protein is both highly soluble and chemically stable at the pH that is planned for.
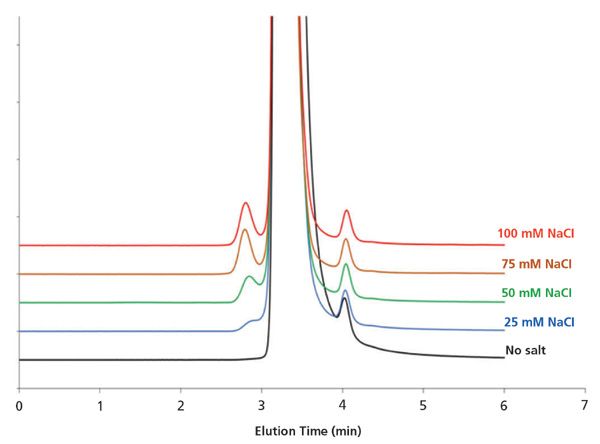
- Salts: Various additives have been tested as a means to reduce nonspecific interactions and retention of proteins under SEC conditions. For example, high concentrations (~0.2 M) of arginine have been used in the past (7). Arginine and other amino acids can interact with the protein and therefore decrease the accessible charges and possible electrostatic (ion-exchange) interactions. More commonly though, significant concentrations of sodium and potassium salts are used to suppress electrostatic interactions between the stationary phase and protein (8,9). An example of the effect of adding increasing levels of sodium chloride to a phosphate buffered mobile phase at pH 6.8 is shown in Figure 2 for the therapeutic protein adalimumab. Here, we see two major effects, both of which evidently result from decreased interactions between the protein and the stationary phase. First, the detected concentration of the mAb dimer (peak eluted before the monomer) increases dramatically (higher recovery) from barely detectable with no salt added, to easily detected at 100 mM sodium chloride added. Second, the elution volume of the dimer also decreases, again because interactions with the stationary phase are decreased, such that the resolution of the dimer and monomer increases.
- Organic solvents: Although most proteins are sufficiently hydrophilic that completely aqueous mobile phases will yield acceptable SEC results, hydrophobic proteins may require small additions of solvent to improve recovery and peak shape. In particular, antibody–drug conjugates (ADCs) are a class of molecules of current interest that may benefit from addition of organic solvent (10). In these cases, addition of 10–15% of isopropanol to the mobile phase is a good starting point.

Figure 2: Impact of mobile phase salt concentration on detected concentration of aggregates in a sample of the therapeutic protein adalimumab. Conditions: Column: 150 mm × 4.6 mm, 2.7-µm Agilent AdvanceBioSEC; mobile phase: 100 mM phosphate buffer, pH 6.8, + indicated concentrations of sodium chloride; flow rate: 350 µL/min. Peaks in order of elution: Dimer, monomer, and fragment (3). Unpublished data from the laboratory of D. Guillarme.
And What About the Instrument?
There are at least two major issues we could discuss here-the impact of system dispersion on the performance of high-quality SEC separations, and the impact of instrument construction and the use of bioinert, biocompatible materials. The latter topic is complex and we will reserve that discussion for a later date. On the topic of system dispersion, we have to recognize that SEC separations are particularly prone to the negative effects of peak dispersion outside of the column (that is, extracolumn dispersion) because, again, the peaks are eluted with no retention or even before the inclusion volume. In separation modes where retention is desirable, the effects of extracolumn dispersion are less severe for peaks that are more retained, and in the case of gradient elution in many cases nearly all precolumn dispersion can be eliminated. Not so in SEC, because no peaks are retained, and all separations are isocratic.
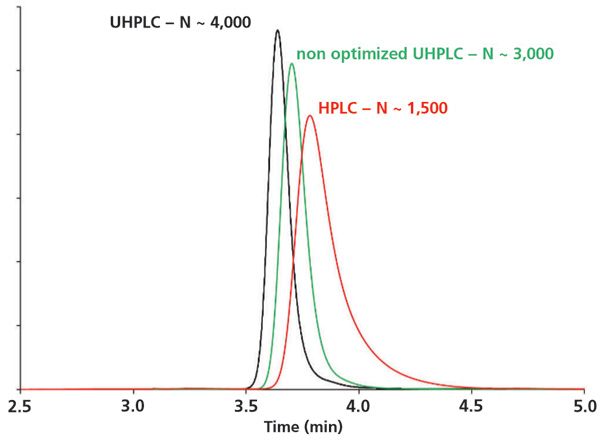
As discussed above, until relatively recently most SEC columns in use were large in diameter (~7.8 mm) and long (300 mm). This resulted in separations where the peak volumes (that is, the peak width in time units, times the flow rate) were large enough in comparison to the injector-to-detector volumes of LC systems they were connected to. However, with the improved plate heights and smaller volumes of state-of-the-art columns, the peak volumes are small enough that extracolumn dispersion has become a very important issue again (11). Figure 3 shows a comparison of the detected peak for a monoclonal antibody monomer obtained on three different LC systems with different levels of extracolumn peak dispersion. Given that resolution is often very valuable in SEC separations, this comparison makes it clear that one should seriously consider the effect of extracolumn dispersion on the observed chromatography, particularly when using modern SEC columns with small volumes and small particles.

Figure 3: Observed chromatograms for a mAb monomer on three different LC systems. Column: 150 mm × 4.6 mm, 1.8 µm; flow rate: 0.3 mL/min; temperature: ambient. Adapted with permission from reference 11.
When working with a state-of-the-art 150 mm × 4.6 mm SEC column, for a small analyte that is eluted near the inclusion volume, only 25–60% of the intrinsic column efficiency can be attained on conventional high performance liquid chromatography (HPLC) systems. The situation is even worse with a partially excluded analyte. Optimized ultrahigh-pressure liquid chromatography (UHPLC) systems having very low extracolumn volumes (typically Vec < 10 µL) have to be used to properly operate these columns. Therefore connector tubing volume and detector cell volume must be as low as possible. As most SEC separations are performed at ambient temperature, the mobile-phase preheater unit can also be removed to further gain in apparent efficiency. Another interesting finding is that conventional HPLC systems also have a big impact on the apparent elution time of proteins-and therefore on mass-calibration curve-when working with 150 mm × 4.6 mm columns. Under these conditions the resulting calibration data will not be reliable, except if corrected for extracolumn residence time.
Summary
Developing effective and high performing SEC separations for proteins requires attention to all facets of the method, including choices around stationary phase, particle size, and column dimensions, mobile-phase conditions, and instrument effects on chromatographic efficiency and resolution. Several research groups are continually contributing to our understanding of the effects of all of these decisions on separation performance. Although we certainly are very far from a complete understanding, we are in a better position than ever before to leverage the information we do have to develop the best methods possible today.
A Note to Readers
With this installment of "LC Troubleshooting," I am approaching my first full year of writing monthly columns that address some of the pain points we experience as practitioners of liquid chromatography. As I have said many times already here, some new problems emerge as technology changes and we adapt to the new behaviors of instruments and columns, but there are also many problems that nominally remain the same over time. I will continue working to bring a mix of discussions of old and new topics to the column, but I am also particularly interested to hear what you, as a regular consumer of the column, have to say about topics you would like to see addressed here. Are there topics that are emerging challenges that you have not seen addressed in the past? Are there "old" topics that you would like to see addressed in more depth? I'd love to hear your topic suggestions! Please send them along to LCGCedit@ubm.com.
Dwight Stoll
References
(1) S. Fekete, D. Guillarme, and D.R. Stoll, LCGC North Am. 36(7), 440-446 (2018).
(2) A. Goyon, S. Fekete, A. Beck, J.-L. Veuthey, and D. Guillarme, J. Chromatog. B 1092, 368–378 (2018). doi:10.1016/j.jchromb.2018.06.029.
(3) A. Goyon, A. Beck, O. Colas, K. Sandra, D. Guillarme, and S. Fekete, J. Chromatog. A 1498, 80–89 (2017). doi:10.1016/j.chroma.2016.11.056.
(4) K. Broeckhoven and G. Desmet, TrAC, Trends Anal. Chem. 63, 65–75 (2014). doi:10.1016/j.trac.2014.06.022.
(5) P.W. Carr, X. Wang, and D.R. Stoll, Anal. Chem. 81, 5342–5353 (2009). doi:10.1021/ac9001244.
(6) How to Guide for Size Exclusion Chromatography for Biomolecule Analysis, (n.d.). https://www.agilent.com/cs/library/primers/public/5991-3651EN_LR.pdf (accessed June 30, 2018).
(7) D. Ejima, R. Yumioka, T. Arakawa, and K. Tsumoto, J. Chromatog. A 1094, 49–55 (2005). doi:10.1016/j.chroma.2005.07.086.
(8) A. Goyon, A. Beck, J.-L. Veuthey, D. Guillarme, and S. Fekete, J. Pharm. Biomed. Anal. 144, 242–251 (2017). doi:10.1016/j.jpba.2016.09.031.
(9) F. Bickel, E.M. Herold, A. Signes, S. Romeijn, W. Jiskoot, and H. Kiefer, Eur. J. Pharm. Biopharm. 107, 310–320 (2016). doi:10.1016/j.ejpb.2016.07.020.
(10) A. Goyon, L. Sciascera, A. Clarke, D. Guillarme, and R. Pell, J. Chromatog. A 1539, 19–29 (2018). doi:10.1016/j.chroma.2018.01.039.
(11) A. Goyon, D. Guillarme, and S. Fekete, J. Pharm. Biomed. Anal. 135, 50–60 (2017). doi:10.1016/j.jpba.2016.12.004.
ABOUT THE AUTHORS
Szabolcs Fekete

Szabolcs Fekete holds a PhD degree in analytical chemistry from the Technical University of Budapest, Hungary. He worked in the analytical R&D department of the Chemical Works of Gedeon Richter Plc for 10 years. Since 2011, he has been working at the University of Geneva in Switzerland. He contributed to more than 100 journal articles and authored book chapters and edited handbooks. His main interests include liquid chromatography (reversed-phase, IEX, SEC, HIC, SFC, HILIC), column technology, method development, pharmaceutical, and protein analysis.
Davy Guillarme

Davy Guillarme holds a PhD degree in analytical chemistry from the University of Lyon, France. He is now senior lecturer at the University of Geneva in Switzerland. He has authored more than 200 journal articles related to pharmaceutical analysis. His expertise includes HPLC, UHPLC, HILIC, LC-MS, SFC, analysis of proteins and mAbs. He is an associate editor of Journal of Chromatography B and editorial advisory board member of several journals including Journal of Chromatography A, Journal of Separation Science, LCGC North America, and others.
ABOUT THE COLUMN EDITOR
Dwight R. Stoll

Dwight R. Stoll is the editor of "LC Troubleshooting." Stoll is a professor and co-chair of chemistry at Gustavus Adolphus College in St. Peter, Minnesota. His primary research focus is on the development of 2D-LC for both targeted and untargeted analyses. He has authored or coauthored more than 50 peer-reviewed publications and three book chapters in separation science and more than 100 conference presentations. He is also a member of LCGC's editorial advisory board. Direct correspondence to: LCGCedit@ubm.com

Polysorbate Quantification and Degradation Analysis via LC and Charged Aerosol Detection
April 9th 2025Scientists from ThermoFisher Scientific published a review article in the Journal of Chromatography A that provided an overview of HPLC analysis using charged aerosol detection can help with polysorbate quantification.
Removing Double-Stranded RNA Impurities Using Chromatography
April 8th 2025Researchers from Agency for Science, Technology and Research in Singapore recently published a review article exploring how chromatography can be used to remove double-stranded RNA impurities during mRNA therapeutics production.
Troubleshooting Everywhere! An Assortment of Topics from Pittcon 2025
April 5th 2025In this installment of “LC Troubleshooting,” Dwight Stoll touches on highlights from Pittcon 2025 talks, as well as troubleshooting advice distilled from a lifetime of work in separation science by LCGC Award winner Christopher Pohl.


