Data Integrity in the Chromatography Laboratory, Part VI: Open Culture, Training, and Monitoring Metrics
LCGC North America
The final part of the series discusses the importance of an open culture, training, and monitoring metrics in the establishment and support of a regulated laboratory.
This is the last of six articles on data integrity in a regulated chromatography laboratory. The first article introduced a four-layer data integrity model and then discussed sampling and sample preparation (1), the second focused on preparing the instrument for analysis and acquiring data (2) and the third discussed integration of acquired chromatograms (3). Article four discussed calculation of the reportable result (4) and the fifth one presented second-person review (5).
The Foundation of Data Integrity
A data integrity model was presented in that first article that consisted of four layers: a foundation layer and three levels above it (6,7). The model works like building a house: A firm foundation allows the three levels above it to function correctly. Therefore, for the final part of this series, we look at three topics within the foundation layer that are essential for supporting data integrity throughout the analytical process:
- An open culture
- Training for data integrity
- Metrics to monitor the analytical process and data integrity.
Establishing and Maintaining an Open Culture
Establishing and maintaining an open culture is the hardest part of a data integrity program. You can have all the procedural and technical controls plus training, but if you don't have the open culture and ethos, it will be wasted because management can put pressure on staff to cut corners.
The following sections discuss some of the key elements of an open culture.
Leading from the Top
Data integrity comes from the top of the organization. Senior management must ensure that they communicate their requirements for data integrity, and obtain feedback to ensure that their requirements are met. Communication is not a single e-mail to all staff, but is reinforced by including data integrity requirements in everybody's job description and objectives; also, an individual's performance for data integrity, in part, should be linked to pay.
In parts I–V of this series (1–5), we have had a running section "Is Management the Problem?" to discuss the impact management can have on a laboratory's approaches to data integrity. These are additional areas where management must be aware, to ensure that the laboratory staff protect data integrity and don't just pay lip service.
Changing the Mindset
A laboratory must move from a blame culture to a learning organization. This approach is illustrated by a quote from Deming (8):
“Fear invites wrong figures. Bearers of bad news fare badly. To keep his job, anyone may present to his boss only good news.”
There must be the ability to allow staff members to own up if they have made a mistake without the fear of being ridiculed or pointed out as inept. At this point, it is worth quoting from the U.S. Food and Drug Administration's (FDA's) Out of Specification (OOS) guidance on analyst responsibilities (9):
“If errors are obvious, such as the spilling of a sample solution or the incomplete transfer of a sample composite, the analyst should immediately document what happened. Analysts should not knowingly continue an analysis they expect to invalidate at a later time for an assignable cause (that is, analyses should not be completed for the sole purpose of seeing what results can be obtained when obvious errors are known).”
Here is a requirement from the FDA for openness and honesty. The move to a learning organization now allows you to ask why a mistake was made. Can we learn from this and improve and prevent the situation from re-occurring? Following are a few examples of reasons for a mistake:
- A procedure is too complex to follow consistently.
- There is too much pressure to release a batch as production is waiting to ship.
- Missing a turnaround target time has too much influence on data integrity and data quality.
The GAMP Guide on Records and Data Integrity details the types of mistakes and their impact (10).
Observing Actual Practices
Closely linked to management leadership is a gemba walk, where managers get out of their offices and see what is happening first hand, rather than filtered through organizational layers. This practice is an opportunity for management to encourage data integrity, and for staff to inform management of problems with processes and systems. In part V (5), we mentioned that, without investment in laboratory automation and systems, the second-person review now can take longer than the actual analysis, slowing release of product to the market. Management must be made aware of such issues.
Equally so, a gemba walk can be an opportunity or staff to show management where data integrity successes have occurred, say by the elimination of a hybrid system as a result of automation. For more information on an open culture, see the ISPE Cultural Excellence Report (11).
Training for Data Integrity
One of the keys to success, ensuring both data integrity and regulatory compliance, is adequately trained and competent analysts. There are several policies and procedures that we first need to introduce, and then we can discuss how training needs to take place. First, we will consider procedures at a corporate level and second, discuss chromatography laboratory standard operating procedures (SOPs).
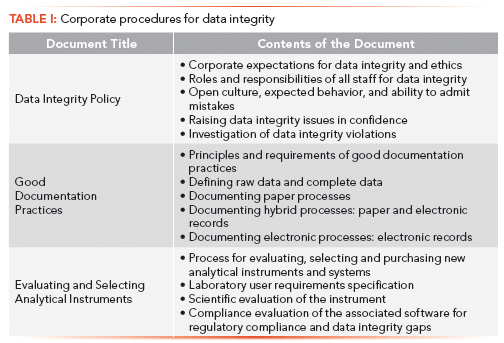
There are three high-level policies or procedures shown in Table I that we will discuss first along with the approaches for training.

A Data Integrity Policy lays out the principles for data integrity and ethos within the organization along with the expected behavior of all staff (6,7,10). This document is too important for a read-and-understand approach when training the staff; additionally, such an approach will not lead to consistency of action. A much better approach is offered by the National Environmental Laboratory Accreditation Conference (NELAC) (12), and outlined in more detail (6,7). There needs to be an introduction to the session by management in which the policy is viewed and explained with examples of both required and prohibited actions. To reinforce the training, copies of the policy and all training materials should be given to each attendee to make their own notes. Because of the importance of this subject, we recommend an assessment at the end with a high pass mark. After the training has been passed, each employee should sign a form declaring that he or she understands the training and the consequences of failing to follow the policy. Staff that fail the assessment should retake the whole of the training and assessment.
Good Documentation Practices (GDocP) training needs to be undertaken in a similar way to the data integrity policy with a copy of the procedure and the training materials followed by an assessment (6,7). Although most laboratories have a procedure for GDocP, those procedures focus mainly on paper records. This policy needs to be extended to include hybrid systems (including record–signature linking) and electronic systems. The procedure needs to cover what is meant by complete data and raw data (13) in a laboratory.
Evaluation and Selection of Analytical Instruments and Systems. With the issue of the new version of USP <1058> on Analytical Instrument Qualification (14), there is an opportunity to update laboratory procedures to ensure correct specification, evaluation, and selection of new instruments and systems (15). There is little point in assessing and remediating current processes and systems if the laboratory continues to purchase inadequate systems that also require remediation before they are operational. Accepting these inadequate systems increases the use of logbooks, which slows the second-person review, as discussed in the fifth article of this series (5).
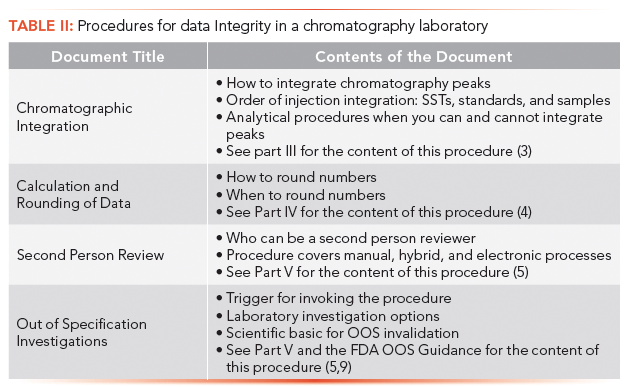
Focusing on the chromatography laboratory, there are four main SOPs that impact data integrity, as shown in Table II:
- Chromatographic integration
- Calculation and rounding
- Second-person review
- OOS investigations.
Because these SOPs have been covered earlier in this series, we do not propose to discuss them further and readers are referred to the applicable part of this series in Table II.

Data Integrity Metrics
As background for data integrity metrics, Newton and McDowall published an overview on the subject in LCGC Europe (16). This article contains the requirements from the various data integrity guidance documents on quality metrics (17,18). It is worth quoting the following note of caution before any metrics are considered (18):
“Caution should be taken when key performance indicators are selected, so as not to inadvertently result in a culture in which data integrity is lower in priority.”
Metrics should be collected automatically to prevent bias. When starting to use metrics, keep it simple at first (16). Some key metrics can be used to monitor the calculation process, as described below.
Runs Aborted
Reporting runs that were started, but not concluded, can point toward analysts looking at data during the run, then making the decision to terminate the run to avoid accepting data they believe may be OOS, out of trend (OOT) or out of expectation (OOE). Aborted runs, in a well-controlled GMP environment, should always be viewed with a suspicious eye.
Short Runs
Reporting runs that have fewer than an accepted number of injections (for example, three injections) is a means of detecting analysts who re-inject a sample to obtain a new result that can replace one from a previous injection.
Run Evaluation Sequence
As mentioned in part III of this series (3), there should be a procedural order for processing a chromatography run:
1. evaluation of system suitability
2. evaluation of reference standard acceptability
3. evaluation of method acceptance criteria
4. evaluation of sample results.
It is possible to create reports that ensure this sequence of events is happening, based on time stamps of events. This report can point toward analysts evaluating sample results before other acceptance criteria, then finding means to reject the run, such as manipulating standards or suitability to ensure failure of the run-a type of "testing into compliance."
Recalculated Dataset
Monitoring runs that are calculated more than once has two benefits: It is one means of looking across runs for potential improper activities, but it also can point out methods that are not well configured, and therefore require additional manual intervention. Recalculations and manual integrations not only have data integrity impact, but lab efficiency as well.
Manual Integration
For each analytical method at each site, report the number of peaks automatically integrated and manually integrated. This metric provides insights that lead to more automated integration. For example, Site A automatically integrates 80% of all peaks for method Y, whereas all other sites using the same method automatically integrate only 30% of their peaks. What do analysts at Site A know about this method that permits such a high level of automated integration?
Benchmarking
For each report type, generate a summary report that compares the number of records found by site. This summary report permits comparisons, and reveals sites that have unusually high (or low) activity compared to other sites. For example, a site with twice the number of aborted runs as other sites might lead to a quality assurance inquiry to understand the high number of aborts. Perhaps equipment issues, a fragile method, or poor behaviors are the root of the issue, but the report creates the signal that starts the investigation.
Metrics Governance
For companies with multiple sites of operation, a supervisory layer of metrics should be created to provide a view of metrics reports. At a minimum, this supervisory layer should provide counts for the type and number of reports generated (either visually or on paper) for each site. This provides insight to the question, "Are people using the reports in our operations?" Failure to use reports indicates either a lack of understanding about the reports, or a lack of report effectiveness. In addition to use frequency, the number of investigations and number of issues uncovered should be monitored to assess the effectiveness of metrics. Reports that seldom lead to discovering real issues should be modified or replaced with more effective reports.
Ideas for Metrics
The best ideas for monitoring metrics often come from regulatory enforcement actions (for example, Warning Letter, Notice of Concern, and so forth). The only twist is to read the cited deficiency and ask yourself, "How would we detect this situation in our own operation?" This question will cause you to think about the data patterns that accompany the behavior and then to formulate a query that could detect the data pattern. For example, a firm is cited for manipulating the system clock to falsify timestamps in audit trail records. If this falsification happens, there could be a series of system audit trail entries, one for each clock adjustment. In addition, there will be some frequently written audit trails (such as intersystem messages) where the clock will appear to go backward because of the clock manipulation. So, a query that checks for clock entries that do not continue to increase could flag clock manipulation behavior.
Limitations of Metrics
It is important to remember that all metrics are not created equal; some will prove more effective than others in your operation. In addition, metrics seldom identify a true issue with every reported record in a report. Rather, they highlight suspicious records that require a human to investigate. This investigation requires a time investment, and therefore becomes a limitation on reporting effectiveness. Finally, some real issues will not be detected in a report, such as reanalyzing a sample on a simple instrument (for example, a pH meter), picking the desired outcome and forwarding it to laboratory information management system (LIMS). This data integrity issue will not be detected on any report.
Summary
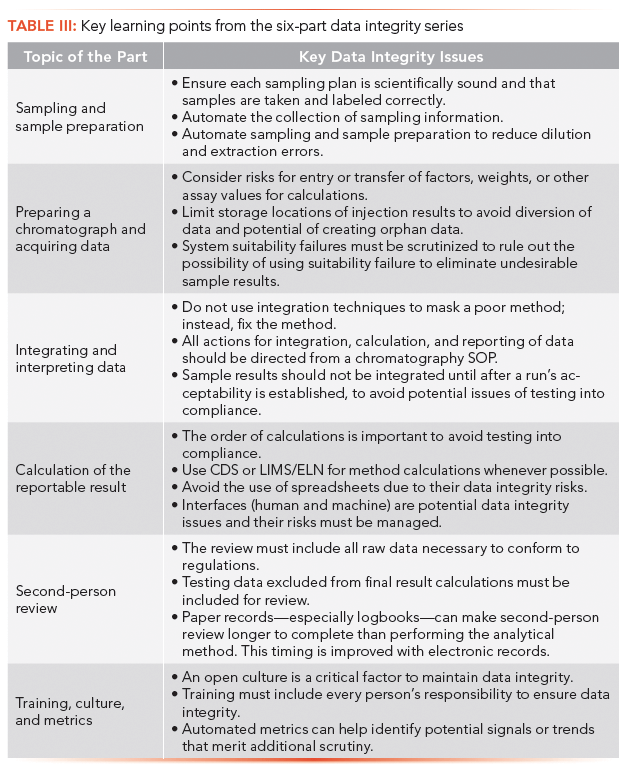
Over the six parts of this series, we have covered the whole of the analytical process for chromatography. To conclude, we would like to summarize the key points from each article (see Table III).

Data integrity in the chromatographic process requires a holistic look at the end-to-end process, identifying places in the process where actions can impact the integrity of the reportable results, then putting controls in place to mitigate the risks. In addition, metric reports must be identified from known issues, to observe the process at a more abstract level, looking for potential signals or trends that deserve closer investigation by qualified personnel.
These actions require the support of senior management, who provide the needed resources for governance and training, and more importantly, who lead by example and regularly inspect the operation to ensure that controls are both used and effective for their purpose.
References
(1) M.E. Newton and R.D. McDowall, LCGC North Am. 36(1), 46–51 (2018).
(2) M.E. Newton and R.D. McDowall, LCGC North Am. 36(4), 270–274 (2018).
(3) M.E. Newton and R.D. McDowall, LCGC North Am. 36(5)“Caution should be taken when key performance indicators are selected, so as not to inadvertently result in a culture in which data integrity is lower in priority.” , 330–335 (2018).
(4) M.E. Newton and R.D. McDowall, LCGC North Am. 36(7), 458–462 (2018).
(5) M.E. Newton and R.D. McDowall, LCGC North Am. 36(8), 527–531 (2018).
(6) R.D. McDowall, Validation of Chromatography Data Systems: Ensuring Data Integrity, Meeting Business and Regulatory Requirements (Royal Society of Chemistry, Cambridge, UK, 2nd Ed., 2017).
(7) R.D. McDowall, Data Integrity and Data Governance: Practical Implementation in Regulated Laboratories (Royal Society of Chemistry, Cambridge, UK, 2018).
(8) W.E. Deming, The New Economics for Industry, Government, Education (MIT Press, Cambridge, Massachusetts, 2nd Ed., 2000)
(9) U.S. Food and Drug Administration, Guidance for Industry Out of Specification Results (FDA, Rockville, Maryland, 2006).
(10) GAMP Guide Records and Data Integrity (International Society for Pharmaceutical Engineering, Tampa, Florida, 2017).
(11) ISPE Cultural Excellence Report (International Society for Pharmaceutical Engineering, Tampa, Florida, 2017).
(12) NELAC Quality Standard (National Environmental Laboratory Accreditation Conference, Weatherford, Texas, 2003).
(13) R.D. McDowall, Spectroscopy, 31(11), 18-21 (2016).
(14) USP 41 General Chapter <1058> Analytical Instrument Qualification (U.S. Pharmacopeial Convention, Rockville, Maryland, 2018).
(15) R.D.McDowall, Spectroscopy, 32(9), 24-30 (2017).
(16) M.E. Newton and R.D. McDowall, LCGC Europe, 30(12), 679–685 (2017).
(17) WHO Technical Report Series No.996 Annex 5 Guidance on Good Data and Records Management Practices (World Health Organization, Geneva, 2016).
(18) PIC/S PI-041 Draft Good Practices for Data Management and Integrity in Regulated GMP/GDP Environments Pharnaceutical Inspection Convention/Pharmaceutical Inspection Co-Operation Scheme, Geneva, 2016).
Mark E. Newton is the principal at Heartland QA in Lebanon, Indiana. Direct correspondence to: mark@heartlandQA.com
R.D. McDowall is the director of RD McDowall Limited in the UK. Direct correspondence to: rdmcdowall@btconnect.com

New Method Explored for the Detection of CECs in Crops Irrigated with Contaminated Water
April 30th 2025This new study presents a validated QuEChERS–LC-MS/MS method for detecting eight persistent, mobile, and toxic substances in escarole, tomatoes, and tomato leaves irrigated with contaminated water.
Accelerating Monoclonal Antibody Quality Control: The Role of LC–MS in Upstream Bioprocessing
This study highlights the promising potential of LC–MS as a powerful tool for mAb quality control within the context of upstream processing.
University of Tasmania Researchers Explore Haloacetic Acid Determiniation in Water with capLC–MS
April 29th 2025Haloacetic acid detection has become important when analyzing drinking and swimming pool water. University of Tasmania researchers have begun applying capillary liquid chromatography as a means of detecting these substances.

.png&w=3840&q=75)

.png&w=3840&q=75)


.png&w=3840&q=75)


.png&w=3840&q=75)


